Chapter 5 Stratified Random Sampling Advantages of stratified


 Data from the National Center for Education Statistics results in the")


 Selecting the stratified random sample. Recall: • approximately 15 million students")


")
 Strat. random sample")


")
")


- Slides: 28
Chapter 5 Stratified Random Sampling Advantages of stratified random sampling n How to select stratified random sample n Estimating population mean and total n Determining sample size, allocation n Estimating population proportion; sample size and allocation n Optimal rule for choosing strata n
Stratified Random Sampling n The ultimate function of stratification is to organize the population into homogeneous subsets and to select a SRS of the appropriate size from each stratum.
Warmup You are doing a project to study grade inflation in the STEM disciplines. A quick internet search shows that average GPA differs by STEM major. In addition, overall GPA differs by school, so you don’t want to limit your sample to “convenient” schools. Major Avg GPA Public School Avg. GPA Private School Avg. GPA Education 3. 36 UVA 3. 32 Harvard 3. 65 Foreign Lang 3. 34 UNC 3. 23 Brown 3. 63 Physics 3. 15 South Car 3. 18 Stanford 3. 57 Biology 3. 02 Va Tech 3. 15 Duke 3. 51 Engineering 2. 90 NCSU 3. 11 Princeton 3. 39 Math 2. 90 UNC-A 3. 11 MIT 3. 39 Comp Sc 2. 83 App St 3. 10 Johns Hop 3. 38 Chemistry 2. 78 UNC-G 2. 95 Wake For 3. 36
Warmup (cont. ) Data from the National Center for Education Statistics results in the following percentages of majors among STEM disciplines: • Computer Science 24% • Engineering 21% • Bio/Life Sciences 17% • Math/Stat 15% • Technology 12% • Chemistry 7% • Physics 4% Approximately 15 million students are in public colleges and 5 million are in private colleges. Suppose you would like to use a sample size of n = 1, 000 students.
Stratified Random Sampling n Often-used option b/c … – May produce smaller BOE than SRS of same size – Cost per observation may be reduced – Obtain estimates of population parameters for subgroups n Useful when the population is heterogeneous and it is possible to establish strata which are reasonably homogeneous within each stratum
Chapter 5 Stratified Random Sampling Improved Sampling Designs with Auxiliary Information Chapter 5 Stratified Random Sampling Chapter 6 Ratio and Regression Estimators
Stratified Random Sampling: Notation
Warmup (cont. ) Selecting the stratified random sample. Recall: • approximately 15 million students are in public colleges and 5 million are in private colleges. • Suppose you would like to use a sample size of n = 1, 000 students. Major(%) % of 1000 Public Private CS(24%) 240 n 1 =. 75× 240 = 180 n 2 =. 25× 240 = 60 Eng(21%) 210 n 3 =. 75× 210=157. 5→ 158 n 4 =. 25× 210=52. 5→ 52 Bio (17%) 170 n 5 =. 75× 170=127. 5→ 128 n 6 =. 25× 170=42. 5→ 42 Math/Stat(15%) 150 n 7 =. 75× 150=112. 5→ 113 n 8 =. 25× 150=37. 5→ 37 Tech(12%) 120 n 9 =. 75× 120=90 n 10 =. 25× 120=30 Chem(7%) 70 n 11 =. 75× 70=52. 5→ 53 n 12 =. 25× 70=17. 5→ 17 Physics(4%) 40 n 13 =. 75× 40=30 n 14 =. 25× 40=10
Stratified Random Sampling
Stratified Random Sampling: Estimate of Mean �
Stratified Random Sampling: Estimate of Mean � , BOE
Stratified Random Sampling: Estimate of Population Total �
Stratified Random Sampling: BOE for Mean � and Total � , t distribution n When stratum sample sizes are small, can use t dist.
Degrees of Freedom(worksheet cont. )
Compare BOE in Stratified Random Sample and SRS (worksheet cont. ) Strat. random sample has more precision
Approx. Sample Size to Estimate µ
Approx. Sample Size to Estimate
Summary: Approx. Sample Size to Estimate µ,
Example: Sample Size to Estimate µ (worksheet cont. )
Example: Sample Size to Estimate (worksheet cont. )
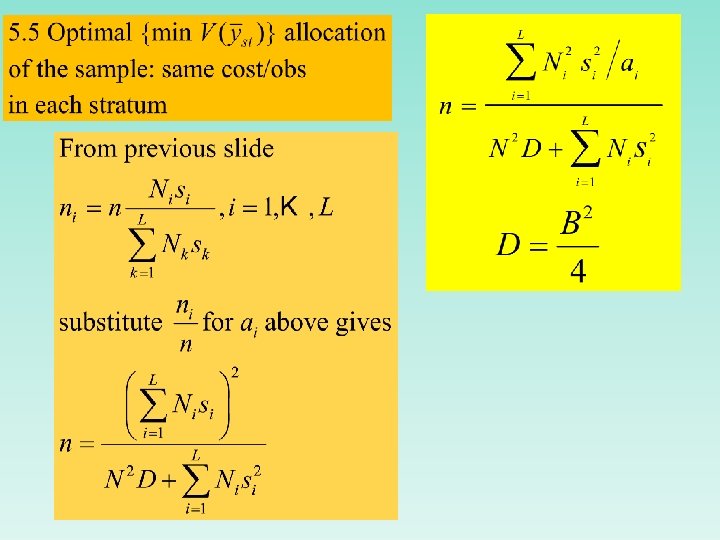
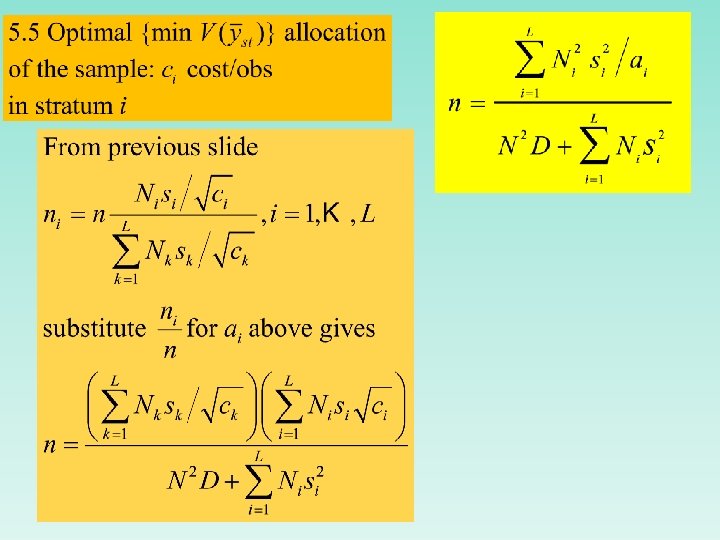
5. 5 Allocation of the Sample Objective: obtain estimators with small variance at lowest cost. n Allocation affected by 3 factors: n 1. Total number of elements in each stratum 2. Variability in each stratum 3. Cost per observation in each stratum
5. 5 Allocation of the Sample: Proportional Allocation n If don’t have variability and cost information for the strata, can use proportional allocation. In general this is not the optimum choice for the stratum sample sizes.
Directly proportional to stratum size and stratum variability
n Worksheet 12
Directly proportional to stratum size and stratum variability Inversely proportional to stratum cost/obs
n Worksheet 13