Chapter 5 Section 1 Understanding Supply I Law


 O If the price of a")


- Slides: 13
Chapter 5 Section 1 Understanding Supply
I. Law of Supply O A. Supply: The amount of goods available O Quantity Supplied: the amount of the good offered for sale at a specific price O B. Law of Supply: the higher the price the larger the quantity produced O Price goes up supply goes up O Price goes down supply goes down
O C. Two movements create the Law of Supply O 1. Higher production O Firms already producing a good will produce more of it if the price goes up O EX: if the price of pizza goes up and production costs stay the same, you will try to produce more pizza O If the price goes down the owner will choose to sell less or produce something else
O 2. Market Entry (firms entering and exiting) O If the price of a good/service rises then people see that as a chance to earn more money and enter the market O Increase the amount supplied O Open a new business O New artists may start singing a certain type of music that is popular O Enter the market to make a quick buck
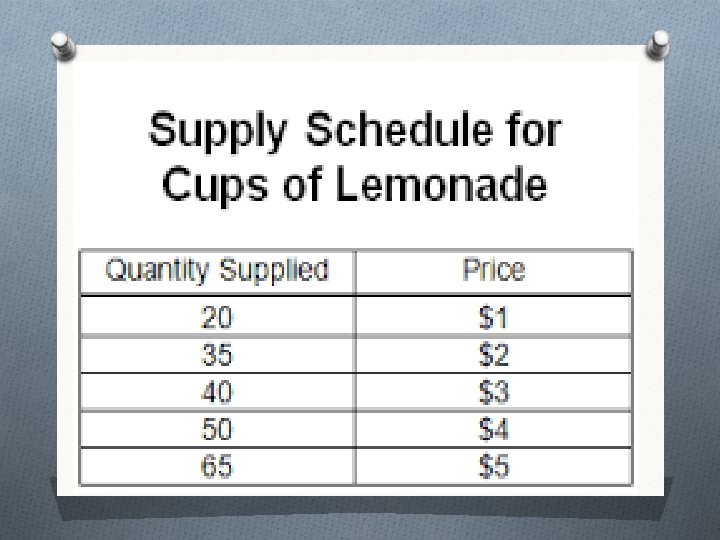
II. Supply Schedule O A. Shows the relationship between price and quantity supplied for a specific good O 1. Just looks at price and then quantity supplied
O B. Change in Quantity Supplied O 1. Rise or fall in prices will cause movement ALONG the supply curve O C. Change in Supply O For every price suppliers supply a different quantity than before
O D. Market Supply Schedule O 1. Chart that lists how much of a good all suppliers will offer at different prices O Becomes Important when we want to determine the total supply of something at a certain price in a large area O Looks similar to a supply schedule just larger numbers
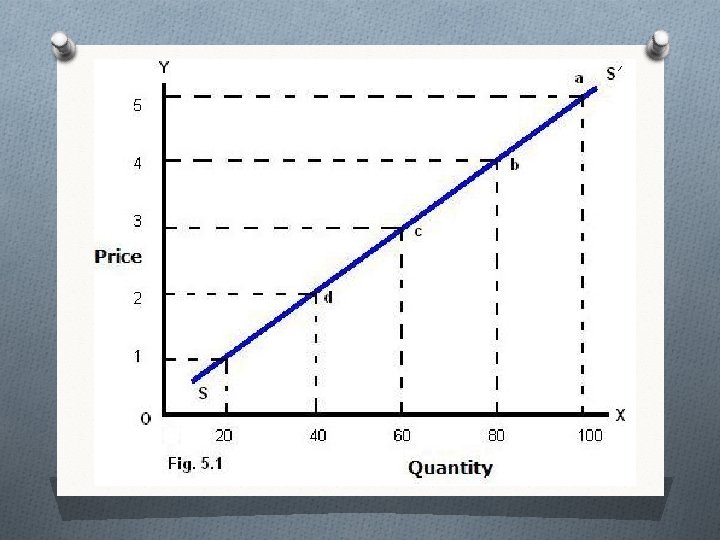
III. Supply Graph O A. Graphical representation of a supply schedule O 1. Similar to a demand graph O 2. Vertical Axis is still price O 3. Horizontal Axis is quantity SUPPLIED O 4. Curve will run the opposite direction as demand O B. Market Supply Graph: Same as a supply graph but has larger quantities
IV. Supply and Elasticity O A. Elasticity of Supply: is a measure of how consumers respond to a change in price O 1. Same meaning for elastic and inelastic O Elastic: Very sensitive to change in price O Inelastic: Not very sensitive to a change in price O 3. Elastic, inelastic, and Unitary elastic are the same values as demand (<1 inelastic, >1 elastic, =1 unitary elastic) O 2. The key factor affecting elasticity of supply is time
V. Elasticity of Supply and Time O A. Elasticity in the Short Run O 1. Firms can’t react quickly to a change in price in the short term O Crops: can’t quickly change the amount produced either higher or lower O 2. This would make supply inelastic: can’t easily change is output
B. Elasticity in the Long run 1. Firms are more flexible so supply can become more elastic a. Can afford to hire more workers