Chapter 5 Review Probability What are the Chances

Chapter 5 Review Probability – What are the Chances?

5. 1 The Idea of Probability I can interpret probability as a long-run relative frequency.

The probability of drawing a jack, queen or king from a standard deck of playing cards is approximately 0. 23. a) Explain what this probability means in the context of drawing from a deck of cards. If you were to repeatedly draw cards, with replacement, from a shuffled deck, you would draw a jack, queen, or king about 23% of the time. b) Does this mean if we repeatedly draw a card, replace it, shuffle, and draw again 100 times that we will draw a jack, queen, or king 23 times? No, we would expect to draw a jack, queen, or king 23 times out of 100, but we are not guaranteed exactly 23.

5. 1 Simulation I can use simulation to model chance behavior.

A popular airline knows that, in general, 95% of individuals who purchase a ticket for a 10 -seat commuter flight actually show up for the flight. In an effort to ensure a full flight, the airline sells 12 tickets for each flight. Design and carry out a simulation to estimate the probability that the flight will be overbooked, that is more passengers show up than there are seats on the flight. Let the digits 01 -95 represent a passenger showing up for the flight. Let 9600 represent a “no show. ” Select 12 two digit numbers from a line of the random number table or a random number generator. Ignore repeats until you have 12 numbers selected. Count how many times 96 -00 occurs. If 96 -00 occurs less than two times, the flight is overbooked. Repeat this procedure 20 times. Determine how many of the 20 trials result in an overbooked flight.

5. 2 Probability Models and the Basic Rules of Probability I can describe a probability model for a chance process. I can use basic probability rules such as the complement rule and addition rule for mutually exclusive events.

Consider drawing a card from a shuffled fair deck of 52 playing cards. How many possible outcomes are in the sample space for this chance process? What’s the probability of for each outcome?

Consider drawing a card from a shuffled fair deck of 52 playing cards. Define the following events: A: the card drawn is an Ace B: the card drawn is a heart a) Find P(A) and P(B). b) What is P(AC)? c) Are events A and B mutually exclusive? Why or why not?

5. 2 Two-Way Tables and Venn Diagrams

Consider drawing a card from a shuffled fair deck of 52 playing cards. Define the following events: A: the card drawn is an Ace B: the card drawn is a heart. 1. Use a two-way table to display the sample space. Ace (A) Not an Ace (Ac) Heart (B) 1 12 Not a Heart (Bc) 3 36

Consider drawing a card from a shuffled fair deck of 52 playing cards. A B 3 1 12 36

5. 3 Conditional Probability and Independence I can compute conditional probabilities. I can determine whether two events are independent.

Is there a relationships between ender and candy preference? Suppose 200 high school students were asked to complete a survey about their favorite candies. The table below shows the gender of each student and their favorite candy. Male Female Total Skittles 80 60 140 M & M’S 40 20 60 Total 120 80 200 Define A to be the event that a randomly selected student is male and B to be the event that a randomly selected student likes Skittles. Are the events A and B independent? Justify your answer.

5. 3 Tree Diagrams and the Multiplication Rule I can use a tree diagram to describe chance behavior. I can use the general multiplication rule to solve probability questions.

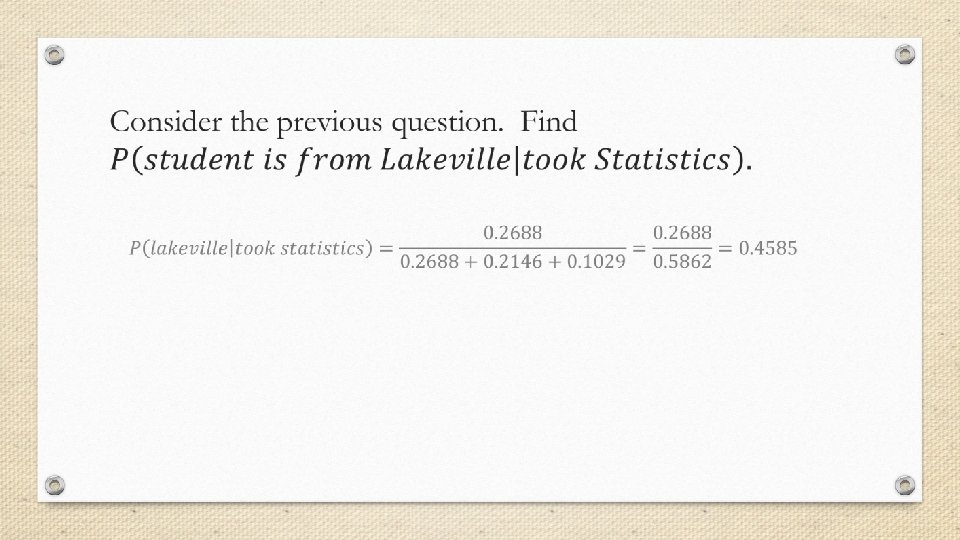
A study of high school juniors in three districts – Lakeville, Sheboygan, and Omaha – was conducted to determine enrollment trends in AP mathematics courses – Calculus or Statistics. 42% of students in the study came from Lakeville, 37% came from Sheboygan, and the rest came from Omaha. In Lakeville, 64% of juniors took Statistics and the rest took Calculus. 58% of juniors in Sheboygan and 49% of juniors in Omaha took Statistics while the rest took Calculus in each district. No juniors took both Statistics and Calculus. Describe this situation using a tree diagram and find the probability that a randomly selected student from in the study took Statistics.

5. 3 Calculating Conditional Probabilities I can compute conditional probabilities.
- Slides: 17