Chapter 5 Review NORMAL STANDARD NORMAL DISTRIBUTIONS Find

Chapter 5 Review NORMAL & STANDARD NORMAL DISTRIBUTIONS

Find the area of the indicated region under the standard normal curve. Use the table and show your work. Find the areas to the left of the z-scores using the z-score table. Subtract the two areas.

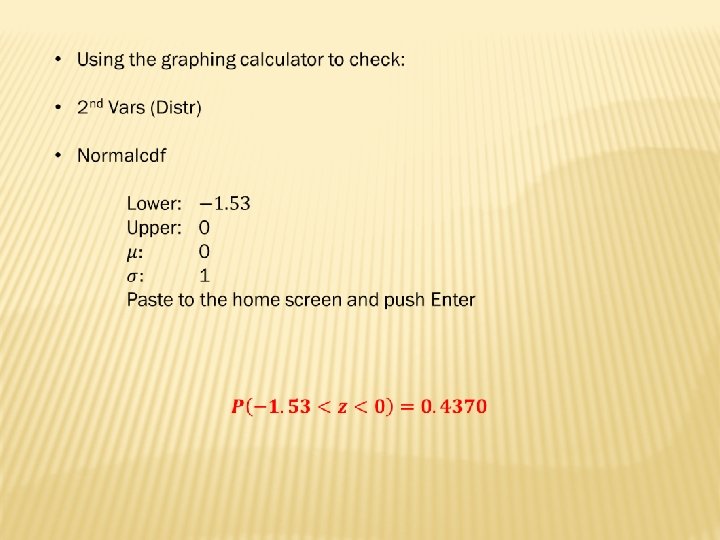
Find the indicated area under the standard normal curve. You may find the area using the table and check it in the calculator using normalcdf. Sketch the standard normal curve

• The area to the left of �� = 1. 36 is. 9131

Find the indicated area under the standard normal curve. Use the table and show your work for credit. Sketch the standard normal curve To find the area to the right of the z-score, subtract from 1.

§ To find the area to the right of the z-score, subtract from 1.

Find the indicated area under the standard normal curve. Use the table and show your work for credit. Sketch the standard normal curve Find the areas to the left of the two z-scores using the table. Subtract the two areas.

Find the indicated area under the standard normal curve. Use the table and show your work for credit.

What is the clue word? or Which means we’re going to do what? add

Find the probability of z occurring in the indicated region. Show your work for credit. Use the table. The four-digit number in the table is also the probability. Find the areas to the left of both z-scores and subtract.

Find the indicated probability using the standard normal distribution. Show your work for credit. Use the table. The four-digit number in the table is also the probability.

Find the indicated probability using the standard normal distribution. Show your work for credit. Use the table. The four-digit number in the table is also the probability.

Find the indicated probability using the standard normal distribution. Sketch the curve. Find the area to the left of the z-scores and subtract. The four-digit number represents both area and probability, so subtract the two areas.

Here we need to convert the x-value to a z-score in order to find the probability.

Find the probability that the member selected at random is from the shaded area of the graph. Assume the variable x is normally distributed. We need to convert the two x-values to z-scores.

Find the probability that the member selected at random is from the shaded area of the graph. Assume the variable x is normally distributed. We need to convert the other x-value to a z-score.

Find the probability that the member selected at random is from the shaded area of the graph. Assume the variable x is normally distributed. Use the table to find the probabilities to the two z-scores and subtract.

Find the probability that the member selected at random is from the shaded area of the graph. Assume the variable x is normally distributed.

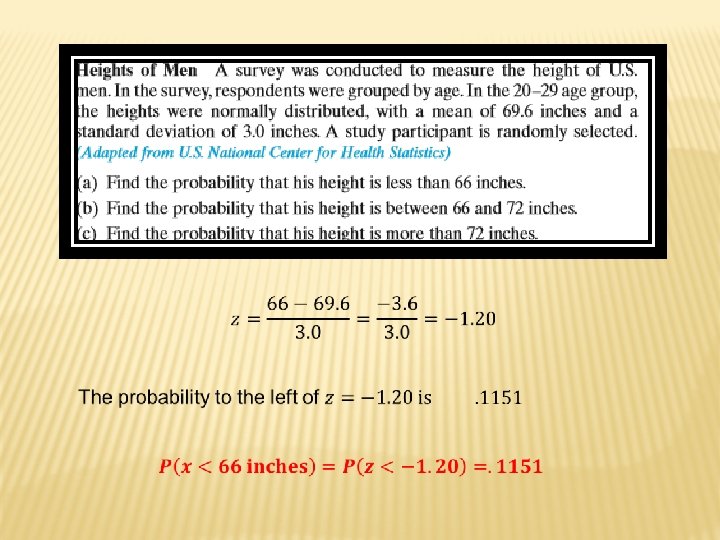
We have been given x-values, a mean, and a standard deviation. The heights are normally distributed. So in order to find the probabilities, we need z-scores. And we will need to sketch three curves. Have fun! a) Find the probability that his height is less than 66 inches. We need to find the z-score and go to the table.
 Find the probability that his height is between 66 and 72 inches. We")
b) Find the probability that his height is between 66 and 72 inches. We need to find two z-scores and go to the table. We already know one of the z-scores.

Now find the other z-score.
.")
Subtract the two areas (probabilities).
 Find the probability that his height is more than 72 inches")
c) Find the probability that his height is more than 72 inches

Find the z-score that corresponds to the given cumulative area. If the area is not in the table, use the entry closest to the area. Go to the table and look for the area. Match it with the z-score. . 7580 can be found in the table. The z-score which matches up with. 7580 is 0. 70 Missing Homework Assignments

Find the z-score that corresponds to the given percentile. This is the 20 th percentile, which converts to an area of. 2000 Go to the table and find the area nearest to. 2000. The area nearest to. 2000 is. 2005

Find the z-score that has 11. 9% of the distribution’s area to its left.

Find the z-score that has 23. 7% of the distribution’s area to its right. This is the area to the right. We need to find the area to the left and find its z-score.
 What height represents the 95 th percentile? We need to find the x-value.")
a) What height represents the 95 th percentile? We need to find the x-value. We also need to find the z-score. The 95 th percentile converts to an area of. 9500 The area in the table closest to. 9500 is. 9505, which is a z-score of 1. 65

Use the following formula to find the value, x:
 What height represents the first quartile? We need to find the x-value. We")
b) What height represents the first quartile? We need to find the x-value. We also need to find the z-score. The first quartile converts to an area of. 2500

Use the following formula to find the value, x:

Use the Central Limit Theorem to find the mean and standard error of the mean of the indicated sampling distribution. Then sketch a graph of the sampling distribution. The consumption of processed fruits by people in the United States in a recent year was normally distributed, with a mean of 144. 3 pounds and a standard deviation of 51. 6 pounds. Random samples of size 35 are drawn from this population.

118. 14 126. 86 135. 58 144. 3 153. 02 161. 74 170. 46

I’m not going to school today.

A binomial experiment is given. Decide whether you can use the normal distribution to approximate the binomial distribution. If you can, find the mean and standard deviation. If you cannot, explain why. A survey indicates that 59% of men purchased perfume in the past year. You randomly select 15 men and ask them if they have purchased perfume in the past year. We can use the normal distribution to approximate the binomial distribution

A binomial experiment is given. Decide whether you can use the normal distribution to approximate the binomial distribution. If you can, find the mean and standard deviation. If you cannot, explain why. In a recent year, the American Cancer Society said that the five-year survival rate for new cases of stage 1 kidney cancer is 95%. You randomly select 12 men who were new stage 1 kidney cancer cases this year and calculate their five-year survival rate. Because one of the conditions is not met, we cannot use the normal distribution to approximate the binomial distribution.

Decide whether you can use the normal distribution to approximate the binomial distribution. If you can, use the normal distribution to approximate the indicated probability. Five percent of workers in the United States use public transportation to get to work. You randomly select 250 workers and ask them if they use public transportation to get to work. Find the probability that exactly 16 workers will say yes. Because both conditions are met, we can use the normal distribution to approximate the binomial distribution.

We need to find the mean of our binomial distribution. We need to find the standard deviation of our binomial distribution. We now need to set up the correction for continuity.

We will use the z-score formula to help find the probability.

Subtract the two probabilities. The probability that exactly 16 workers will say yes is. 0692

Decide whether you can use the normal distribution to approximate the binomial distribution. If you can, use the normal distribution to approximate the indicated probabilities and sketch their graphs. Five percent of workers in the United States use public transportation to get to work. You randomly select 250 workers and ask them if they use public transportation to get to work. Find the probability that at least 9 workers will say yes. We know the mean is 12. 5 and the standard deviation is 3. 45.

Cat Burglars
- Slides: 46