
CHAPTER 5 Regression Basic Practice of Statistics 7
CHAPTER 5: Regression Basic Practice of Statistics 7 th Edition Lecture Power. Point Slides 1
In chapter 5, we cover … � Regression lines � The least-squares regression line � Examples of technology � Facts about least-squares regression � Residuals � Influential observations � Cautions about correlation and regression � Association does not imply causation � Correlation, prediction, and big data* 2
Linear Regression �Objective: To quantify the linear relationship between an explanatory variable (x) and response variable (y). �We can then predict the average response for all subjects with a given value of the explanatory variable. 3
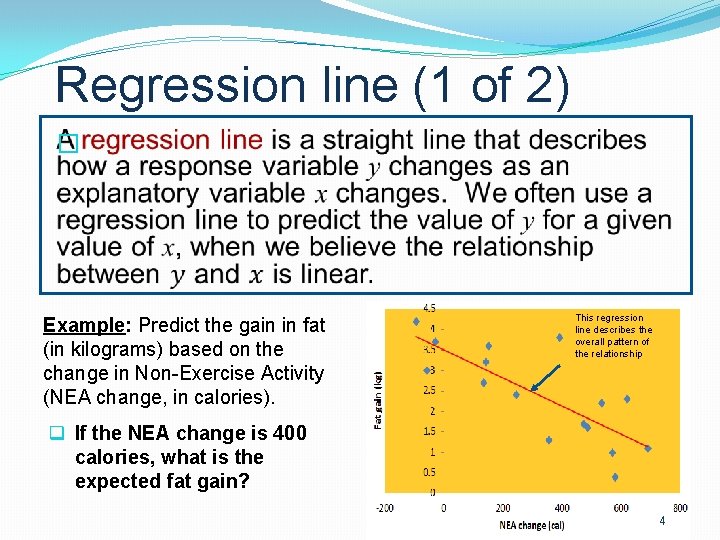
Regression line (1 of 2) � Example: Predict the gain in fat (in kilograms) based on the change in Non-Exercise Activity (NEA change, in calories). This regression line describes the overall pattern of the relationship q If the NEA change is 400 calories, what is the expected fat gain? 4
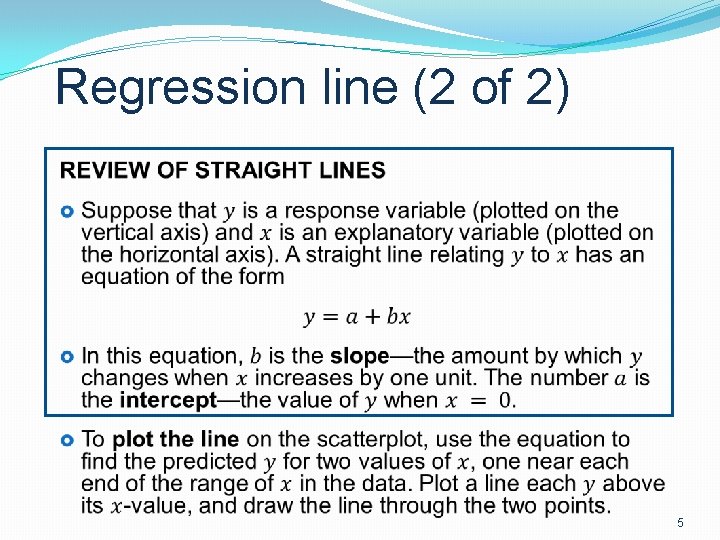
Regression line (2 of 2) 5
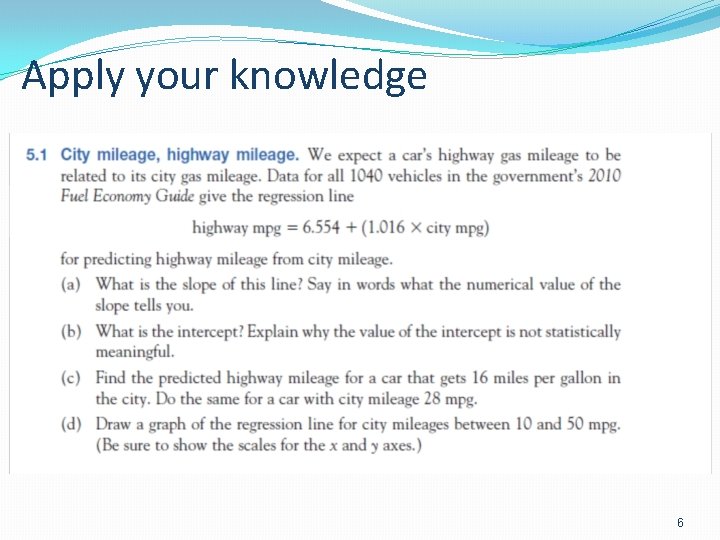
Apply your knowledge 6
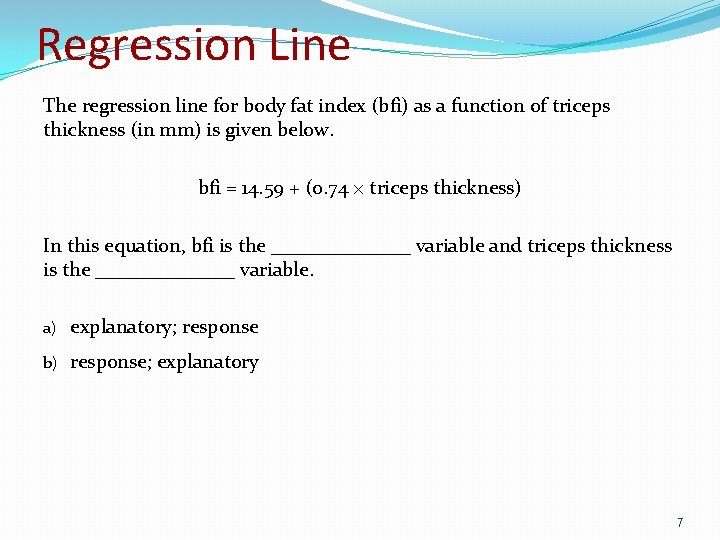
Regression Line The regression line for body fat index (bfi) as a function of triceps thickness (in mm) is given below. bfi = 14. 59 + (0. 74 × triceps thickness) In this equation, bfi is the _______ variable and triceps thickness is the _______ variable. a) explanatory; response b) response; explanatory 7
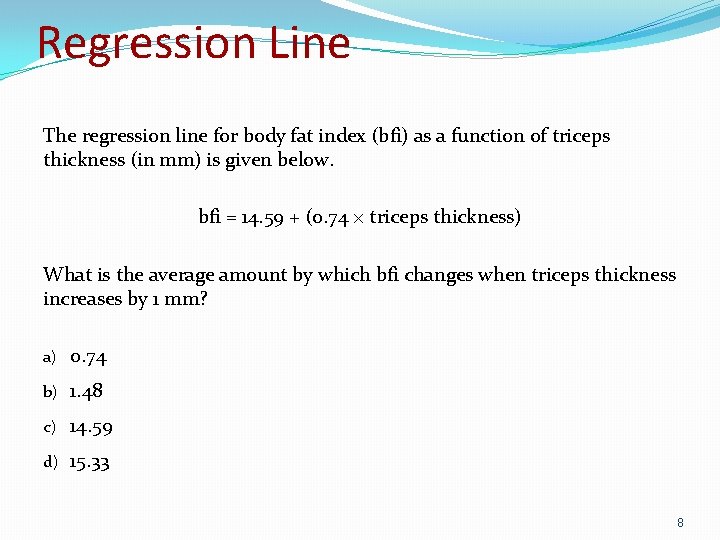
Regression Line The regression line for body fat index (bfi) as a function of triceps thickness (in mm) is given below. bfi = 14. 59 + (0. 74 × triceps thickness) What is the average amount by which bfi changes when triceps thickness increases by 1 mm? a) 0. 74 b) 1. 48 c) 14. 59 d) 15. 33 8
Regression Line The regression line for body fat index (bfi) as a function of triceps thickness (in mm) is given below. bfi = 14. 59 + (0. 74 × triceps thickness) Predict the bfi for individuals with triceps thickness of 35 mm. a) 14. 59 + 0. 74 = 15. 33 b) 14. 59 + 35 = 49. 59 c) 14. 59 + (0. 74 × 35) = 40. 49 d) 0. 74 × 35 = 25. 9 9
Regression Line The regression line for body fat index (bfi) as a function of triceps thickness (in mm) is given below. bfi = 14. 59 + (0. 74 × triceps thickness) What is 14. 59 in this equation? a) the predicted bfi when triceps thickness = 0 mm b) the bfi intercept c) Both of the answer options are correct. 10
Regression Line Consider the following regression line. MPG = 48. 74 − 0. 0082 (weight) Calculate the predicted value of MPG when the weight is 3000 pounds. a) b) c) d) 30. 5 24. 14 28. 2 17. 5 11
Regression Line Consider the following regression line, where y is motor vehicle fatalities per 100, 000 residents and x is percent population for ages 18 to 24. y = − 10 + 2. 7 x Which of the following correctly predicts the number of motor vehicle fatalities in a state with 25% population age 18 to 24? a) b) c) d) 2. 7(25) = 67. 5 − 10 + 2. 7(25) = 57. 5 − 10(25) = − 250 − 10(25) + 2. 7 = − 247. 3 12
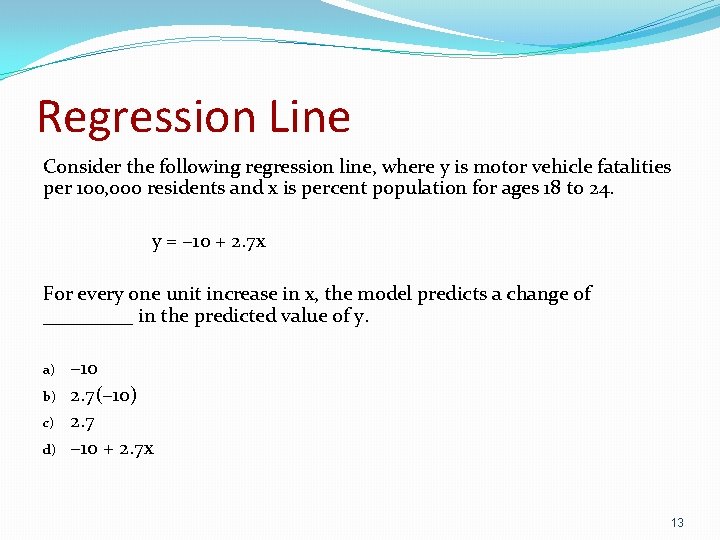
Regression Line Consider the following regression line, where y is motor vehicle fatalities per 100, 000 residents and x is percent population for ages 18 to 24. y = − 10 + 2. 7 x For every one unit increase in x, the model predicts a change of _____ in the predicted value of y. a) b) c) d) − 10 2. 7(− 10) 2. 7 − 10 + 2. 7 x 13
Least Squares �Used to determine the “best” line �Least Squares: use the line that minimizes the sum of the squares of the vertical distances of the data points from the line �Draw a picture 14
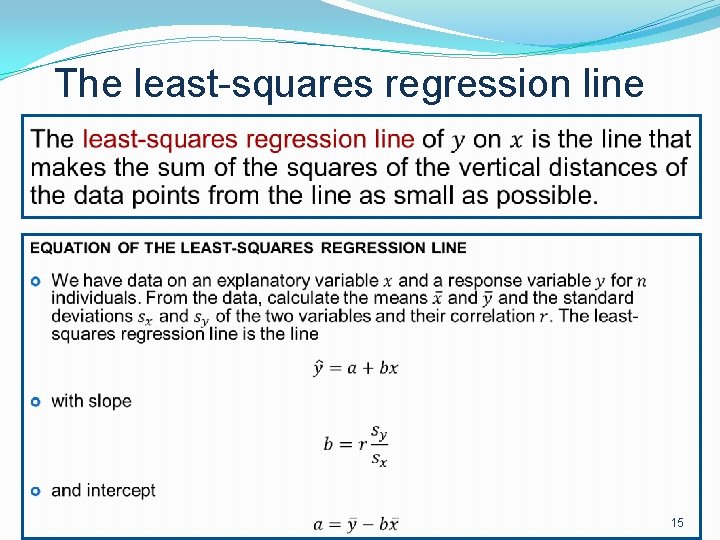
The least-squares regression line 15
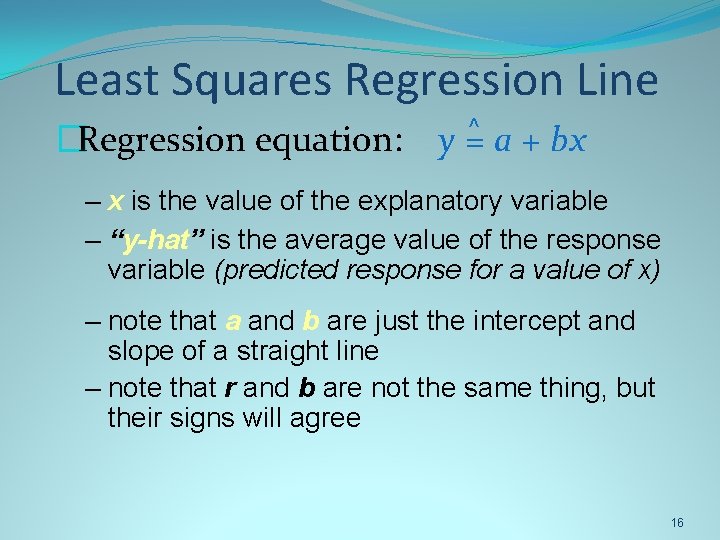
Least Squares Regression Line ^ �Regression equation: y = a + bx – x is the value of the explanatory variable – “y-hat” is the average value of the response variable (predicted response for a value of x) – note that a and b are just the intercept and slope of a straight line – note that r and b are not the same thing, but their signs will agree 16
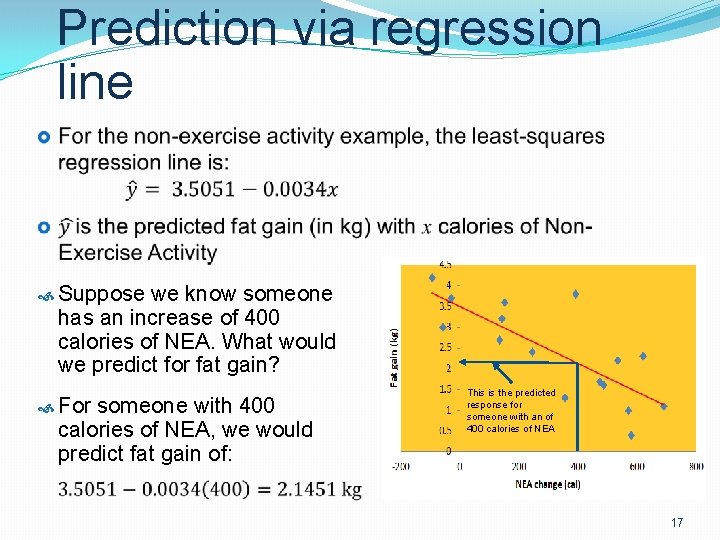
Prediction via regression line Suppose we know someone has an increase of 400 calories of NEA. What would we predict for fat gain? For someone with 400 calories of NEA, we would predict fat gain of: This is the predicted response for someone with an of 400 calories of NEA 17
Regression Calculation Case Study Per Capita Gross Domestic Product and Average Life Expectancy for Countries in Western Europe 18
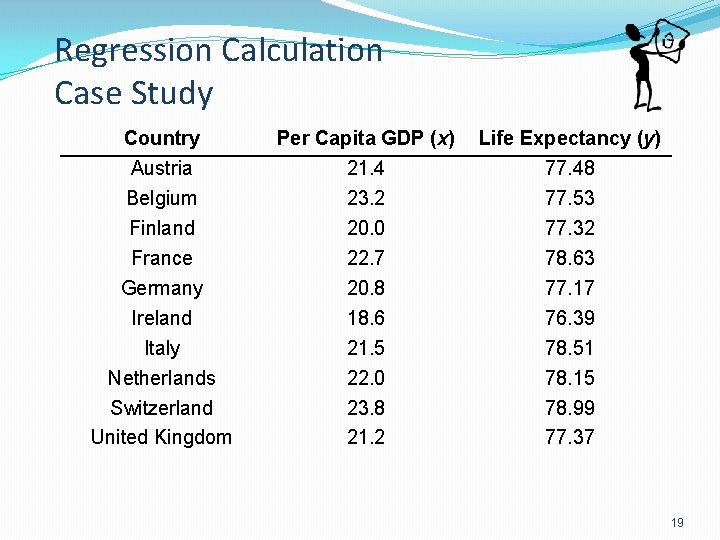
Regression Calculation Case Study Country Austria Belgium Finland France Germany Ireland Italy Netherlands Switzerland United Kingdom Per Capita GDP (x) 21. 4 23. 2 20. 0 22. 7 20. 8 18. 6 21. 5 22. 0 23. 8 21. 2 Life Expectancy (y) 77. 48 77. 53 77. 32 78. 63 77. 17 76. 39 78. 51 78. 15 78. 99 77. 37 19
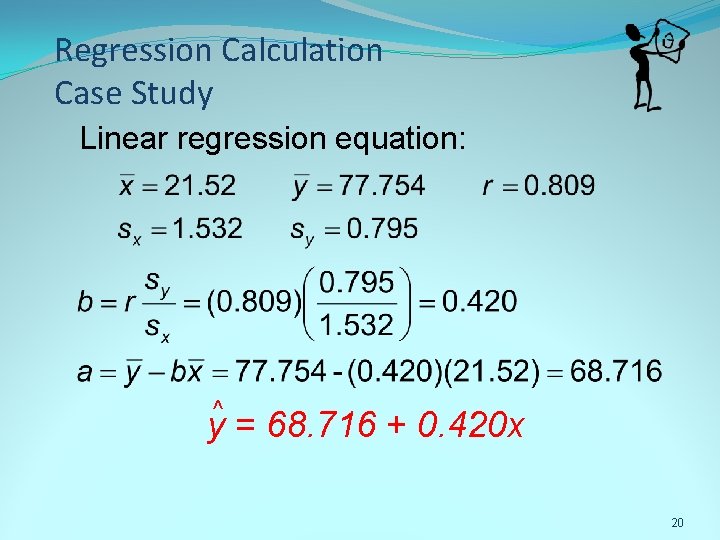
Regression Calculation Case Study Linear regression equation: ^ y = 68. 716 + 0. 420 x 20
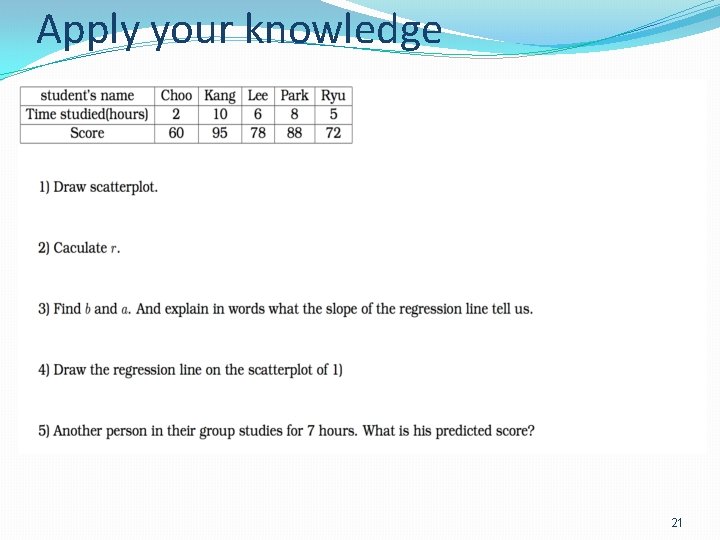
Apply your knowledge 21
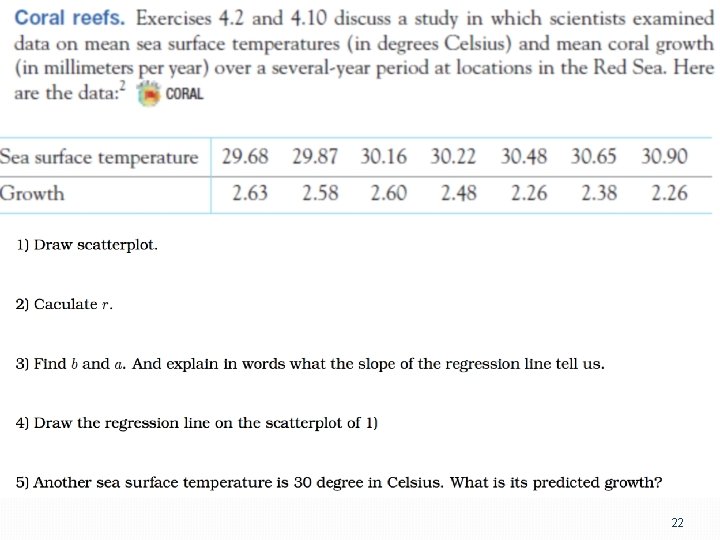
22
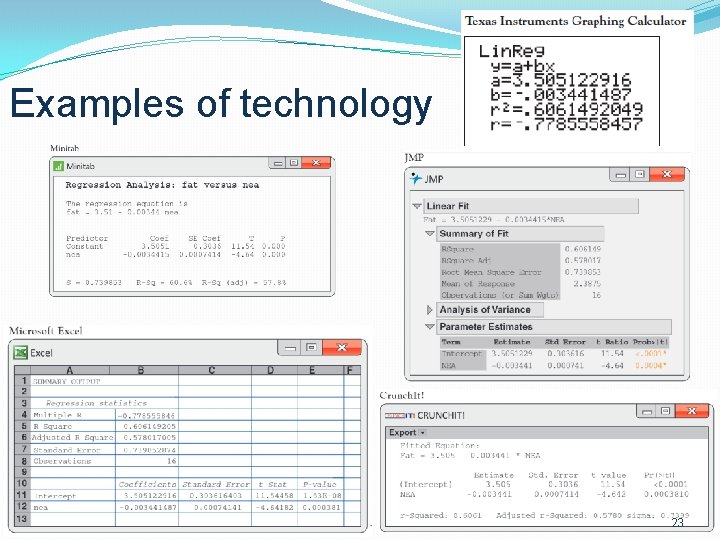
Examples of technology 23
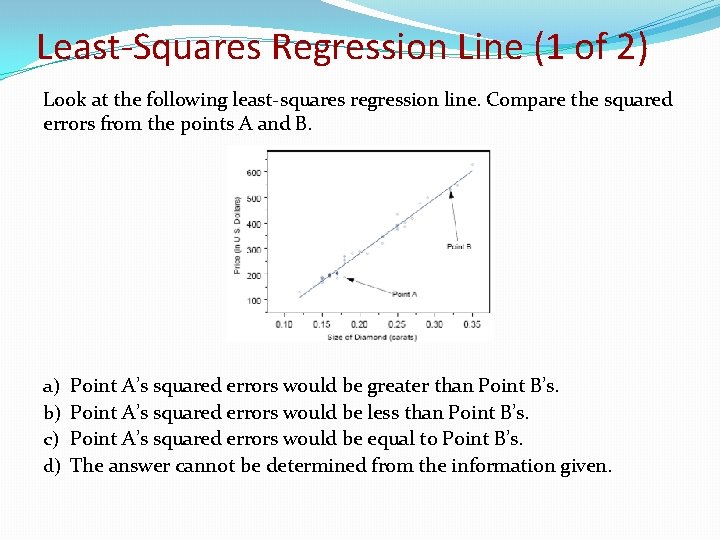
Least-Squares Regression Line (1 of 2) Look at the following least-squares regression line. Compare the squared errors from the points A and B. a) b) c) d) Point A’s squared errors would be greater than Point B’s. Point A’s squared errors would be less than Point B’s. Point A’s squared errors would be equal to Point B’s. The answer cannot be determined from the information given.
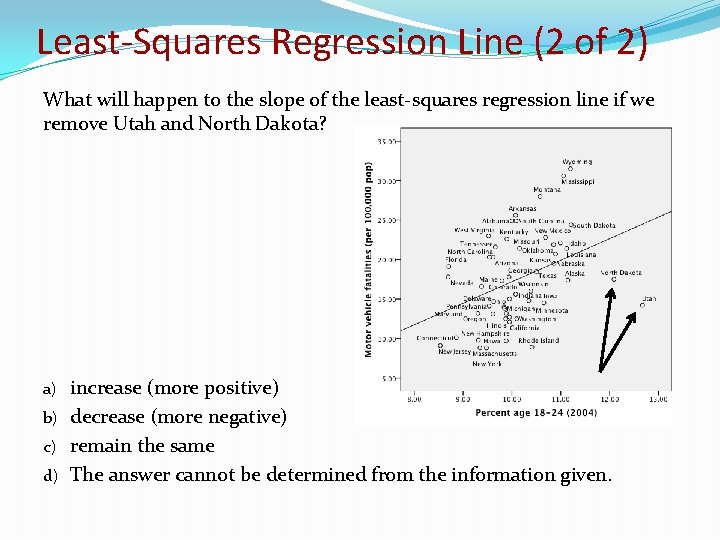
Least-Squares Regression Line (2 of 2) What will happen to the slope of the least-squares regression line if we remove Utah and North Dakota? increase (more positive) b) decrease (more negative) c) remain the same d) The answer cannot be determined from the information given. a)
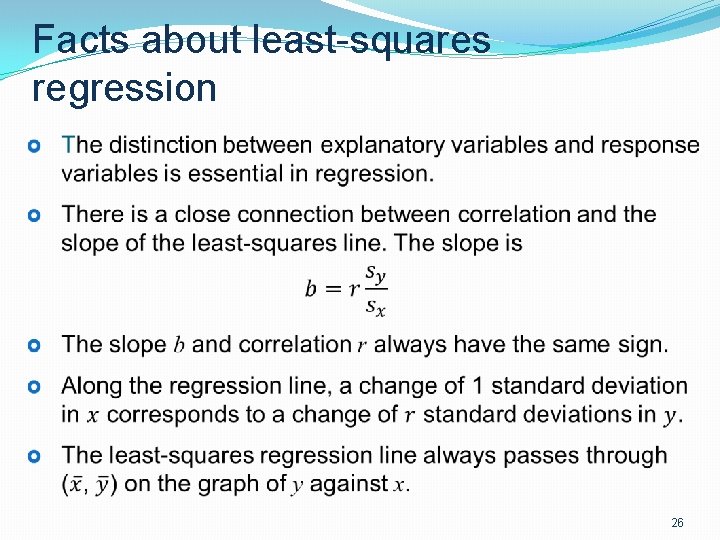
Facts about least-squares regression 26
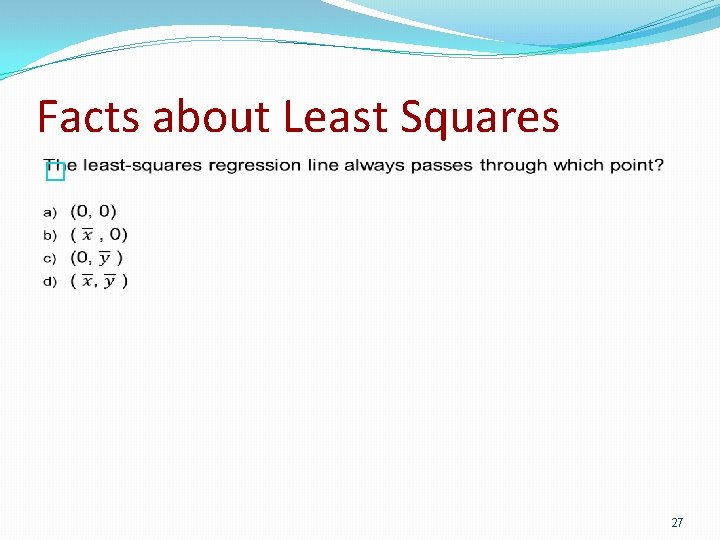
Facts about Least Squares � 27
Facts about Least Squares If y is the response variable and x is the explanatory variable, what does the regression line allow you to do that correlation does not? a) calculate the exact value of x, given a value for y b) calculate the predicted value of x, given a value for y c) calculate the exact value of y, given a value for x d) calculate the predicted value of y, given a value for x 28
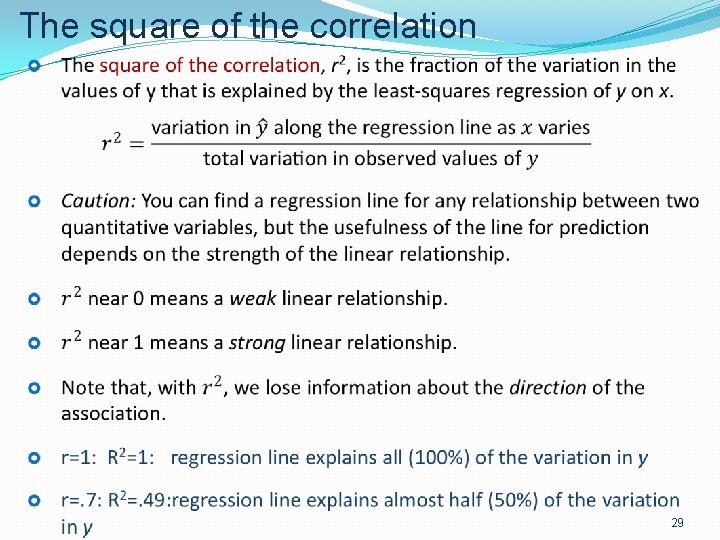
The square of the correlation 29
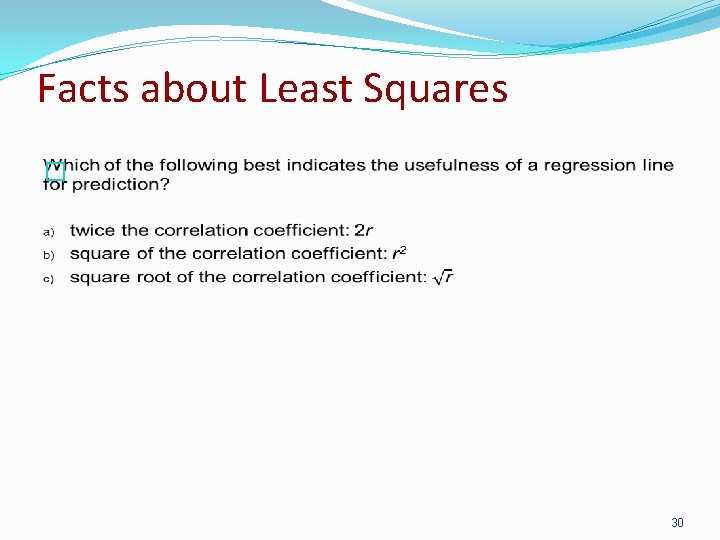
Facts about Least Squares � 30
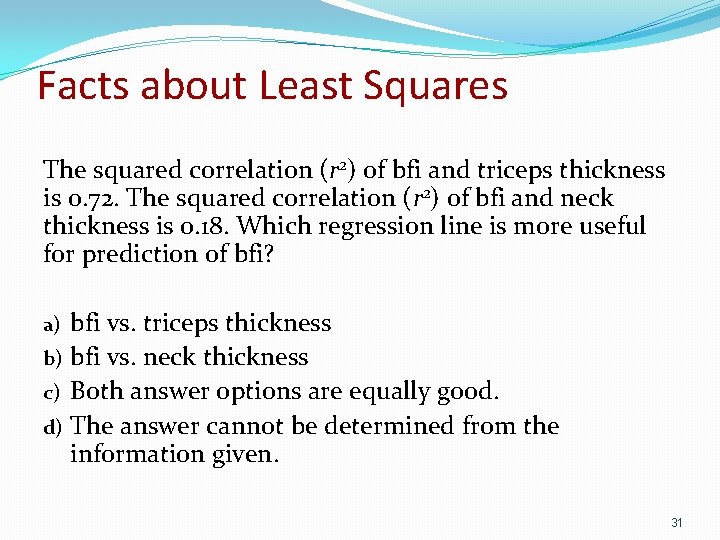
Facts about Least Squares The squared correlation (r 2) of bfi and triceps thickness is 0. 72. The squared correlation (r 2) of bfi and neck thickness is 0. 18. Which regression line is more useful for prediction of bfi? bfi vs. triceps thickness b) bfi vs. neck thickness c) Both answer options are equally good. d) The answer cannot be determined from the information given. a) 31
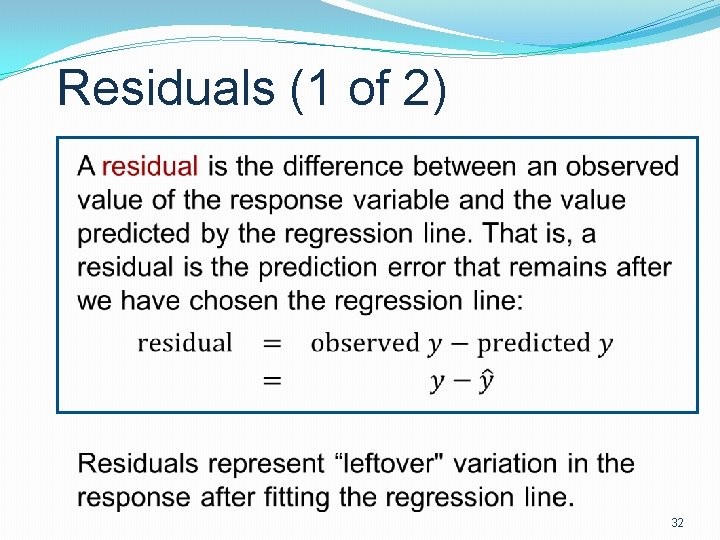
Residuals (1 of 2) 32
Residuals (2 of 2) The residuals from the least-squares line have a special property: the mean of the least-squares residuals is always zero. RESIDUAL PLOTS A residual plot is a scatterplot of the regression residuals against the explanatory variable. Residual plots help us assess how well a regression line fits the data. Look for a “random” scatter around zero. 33
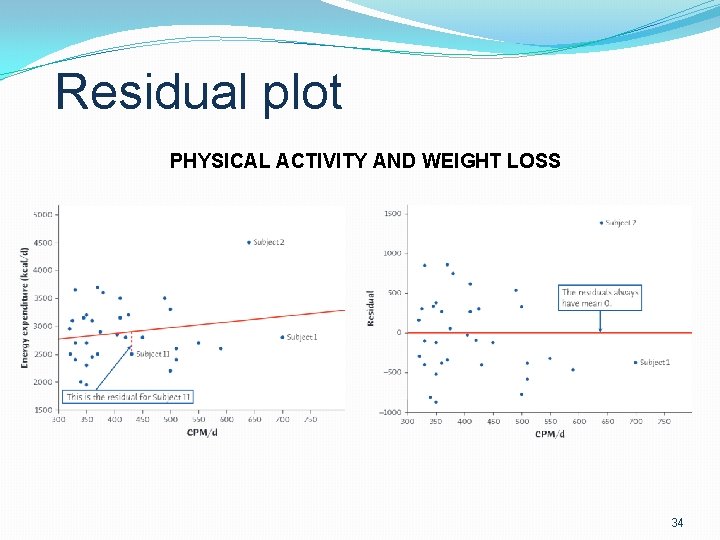
Residual plot PHYSICAL ACTIVITY AND WEIGHT LOSS 34
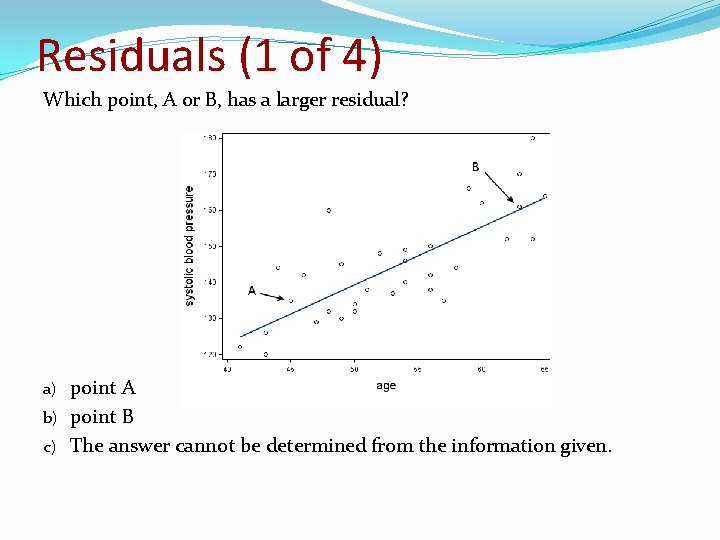
Residuals (1 of 4) Which point, A or B, has a larger residual? point A b) point B c) The answer cannot be determined from the information given. a)
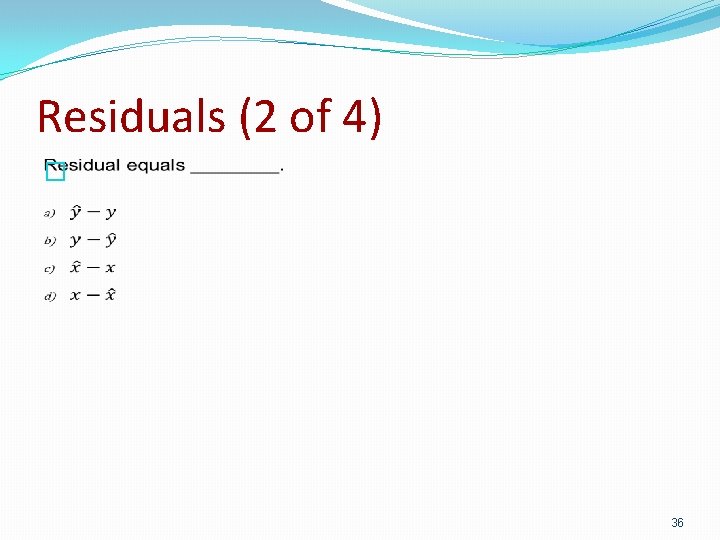
Residuals (2 of 4) � 36
Residuals (3 of 4) The residual plot is used to: examine the relationship between two variables. b) identify the mean and spread of the residuals. c) check for independence of observations. d) examine how well a regression line fits the data. a) 37
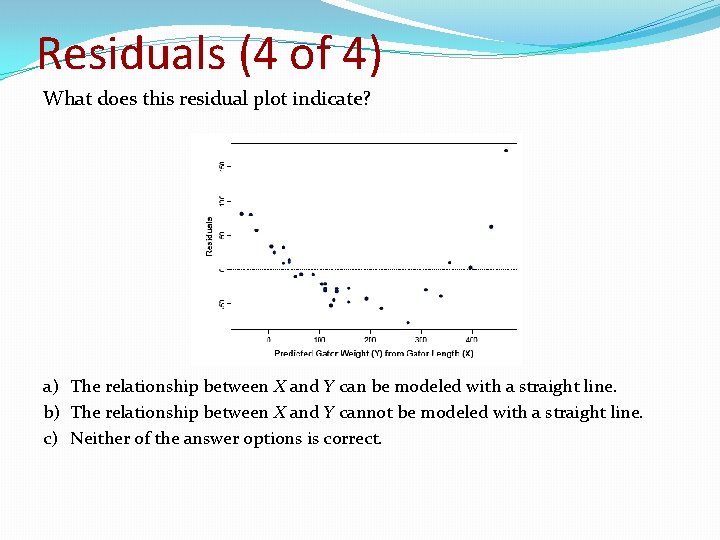
Residuals (4 of 4) What does this residual plot indicate? a) The relationship between X and Y can be modeled with a straight line. b) The relationship between X and Y cannot be modeled with a straight line. c) Neither of the answer options is correct.
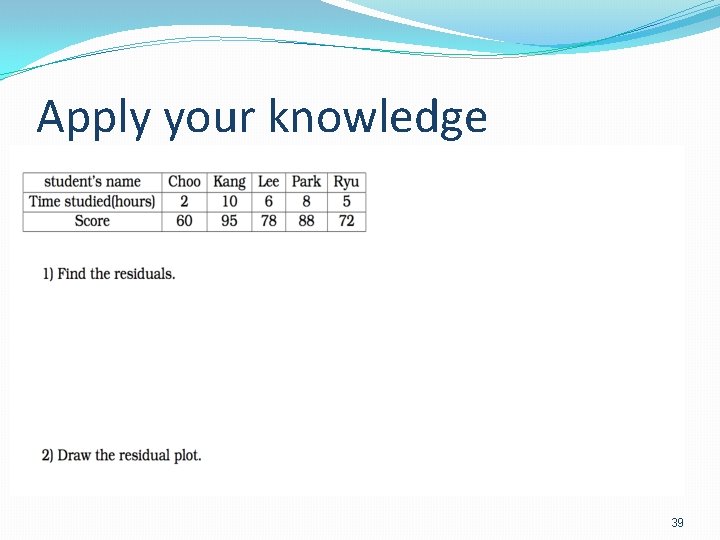
Apply your knowledge 39
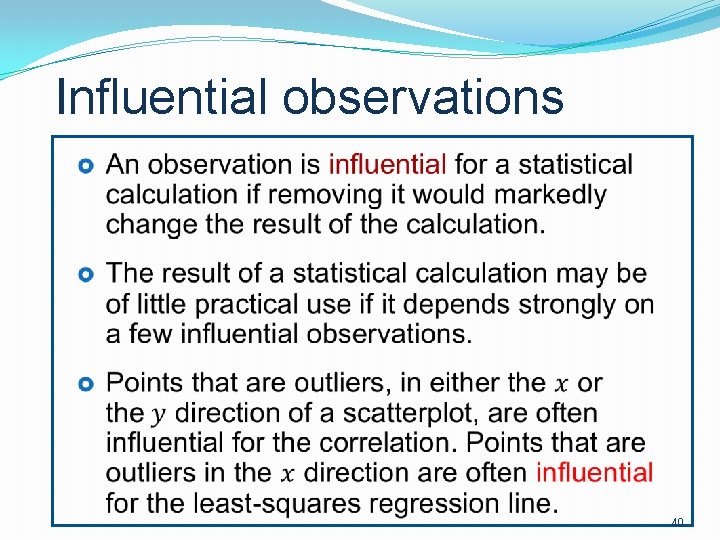
Influential observations 40
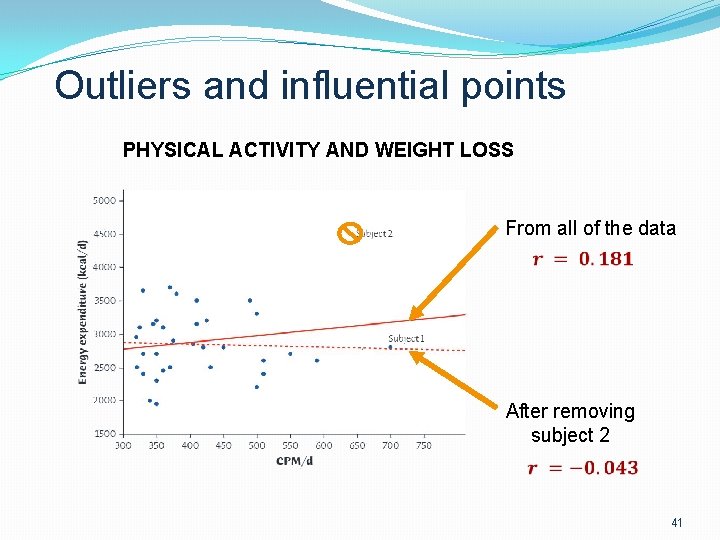
Outliers and influential points PHYSICAL ACTIVITY AND WEIGHT LOSS From all of the data After removing subject 2 41
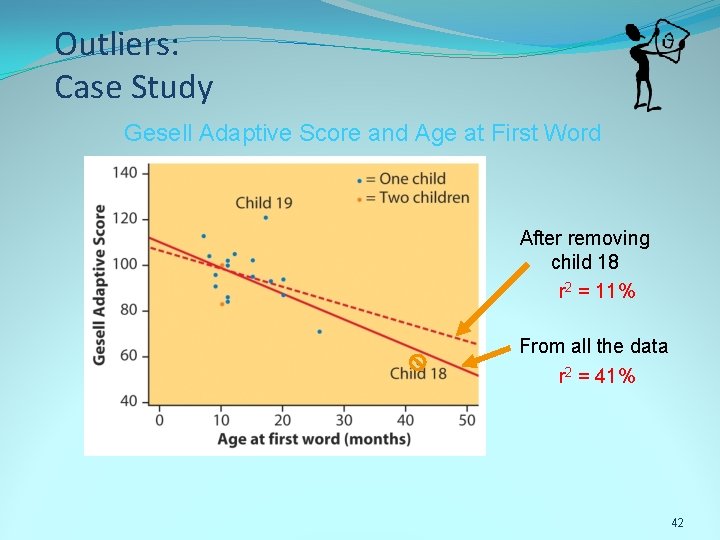
Outliers: Case Study Gesell Adaptive Score and Age at First Word After removing child 18 r 2 = 11% From all the data r 2 = 41% 42
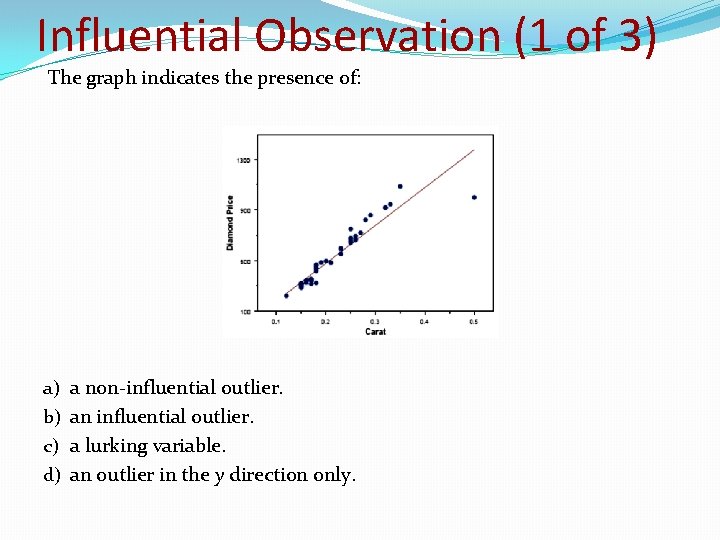
Influential Observation (1 of 3) The graph indicates the presence of: a) b) c) d) a non-influential outlier. an influential outlier. a lurking variable. an outlier in the y direction only.
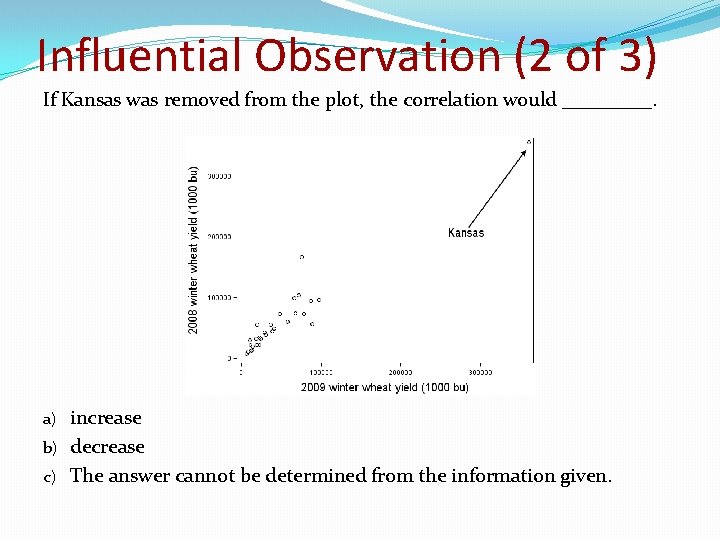
Influential Observation (2 of 3) If Kansas was removed from the plot, the correlation would _____. increase b) decrease c) The answer cannot be determined from the information given. a)
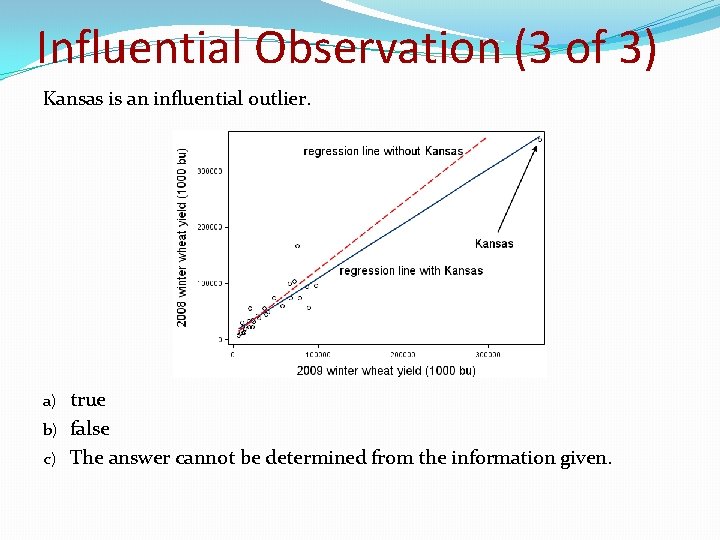
Influential Observation (3 of 3) Kansas is an influential outlier. true b) false c) The answer cannot be determined from the information given. a)
Cautions about correlation and regression Correlation and regression lines describe only linear relationships. Correlation and least-squares regression lines are not resistant. Beware ecological correlation, or correlation based on averages rather than individuals. A correlation based on averages rather than on individuals is called an ecological correlation. 46
Cautions about correlation and regression Beware of extrapolation—predicting outside of the range of x. Beware of lurking variables—these have an important effect on the relationship among the variables in a study, but are not included in the study. A lurking variable is a variable that is not among the explanatory or response variables in a study and yet may influence the interpretation of relationships among those variables. Correlation does not imply causation! An association between an explanatory variable x and a response variable y, even if it is very strong, is not by itself good evidence that changes in x actually cause changes in y. 47
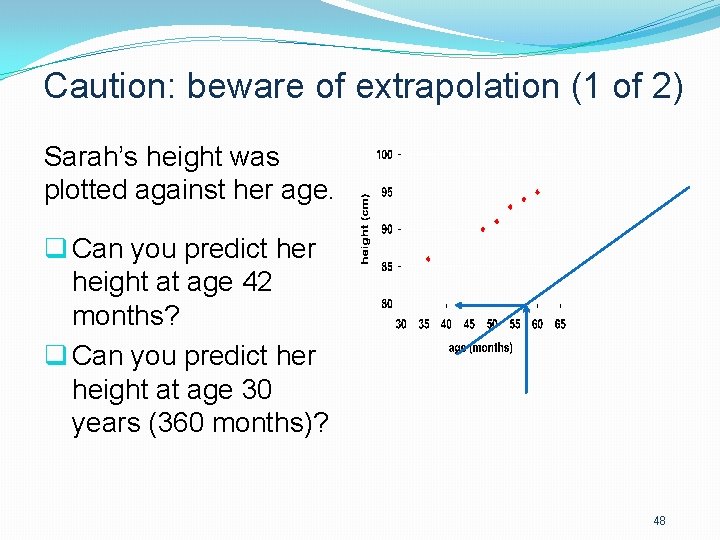
Caution: beware of extrapolation (1 of 2) Sarah’s height was plotted against her age. q Can you predict her height at age 42 months? q Can you predict her height at age 30 years (360 months)? 48
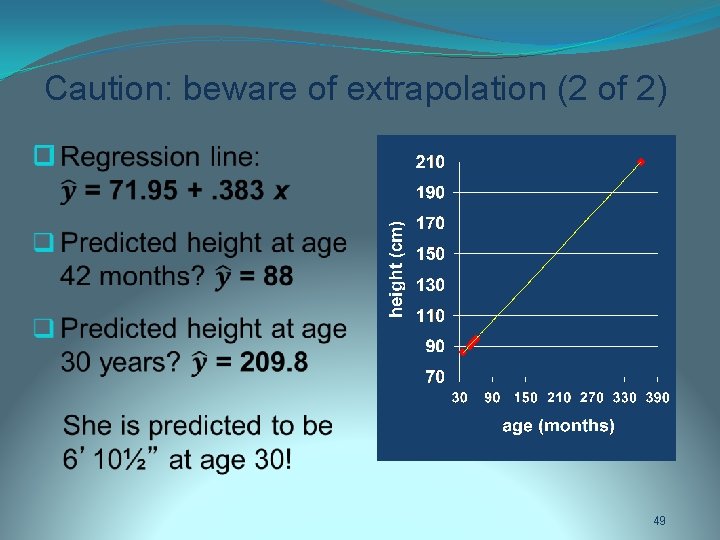
Caution: beware of extrapolation (2 of 2) � 49
Caution: beware of lurking variables Example: Meditation and Aging (Noetic Sciences Review, Summer 1993, p. 28) q Explanatory variable: observed meditation practice (yes/no) q Response variable: level of age-related enzyme General concern for one’s well-being may also be affecting the response (and the decision to try meditation). 50
Correlation does not imply causation �Even very strong correlations may not correspond to a real causal relationship (changes in x actually causing changes in y). �Correlation may be explained by a lurking variable Social Relationships and Health House, J. , Landis, K. , and Umberson, D. “Social Relationships and Health, ” Science, Vol. 241 (1988), pp. 540 -545. Does lack of social relationships cause people to become ill? (There was a strong correlation. ) q Or, are unhealthy people less likely to establish and maintain social relationships? (reversed relationship) q Or, is there some other factor that predisposes people both to have lower social activity and to become ill? 51
Evidence of causation A properly conducted experiment may establish causation. Other considerations when we cannot do an experiment: The association is strong. The association is consistent. Higher doses are associated with stronger responses. Alleged cause precedes the effect in time. Alleged cause is plausible (reasonable explanation). 52
Correlation, prediction, and big data 53
Causation (1 of 3) A 1999 observational study reported in the prestigious journal Nature found a positive correlation between ambient lighting in a baby’s room and the degree of myopia (nearsightedness) later in life. What should you do with this information? Accept it without question. b) Accept it tentatively. c) Throw away your baby’s nightlight to prevent myopia. d) Wait until an experiment is done. a) 54
Causation (2 of 3) The myopia study referenced on the previous slide was later criticized. A second study showed no relationship. One of the following was suggested as a lurking variable in the first study. Which is it? (Think carefully about which variable might have influenced the relationship. Who would have tended to both use nightlights and pass on myopia to their children? ) a) b) c) d) socioeconomic status parental myopia gender nationality 55
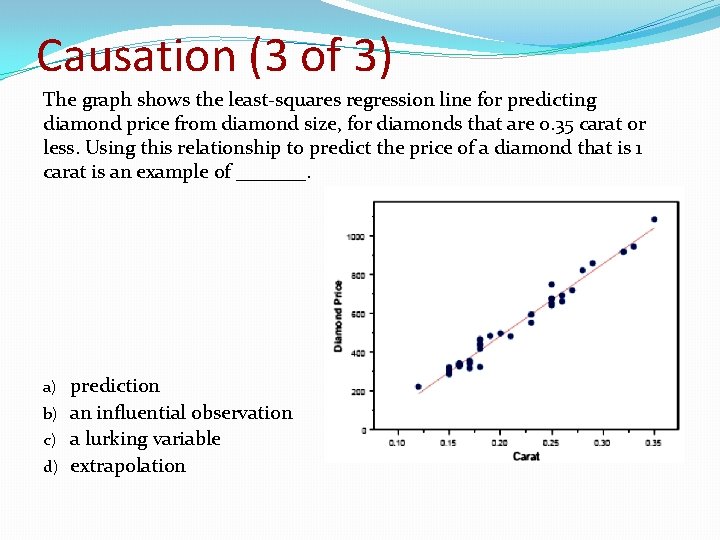
Causation (3 of 3) The graph shows the least-squares regression line for predicting diamond price from diamond size, for diamonds that are 0. 35 carat or less. Using this relationship to predict the price of a diamond that is 1 carat is an example of _______. prediction b) an influential observation c) a lurking variable d) extrapolation a)
Big Data (1 of 2) We don’t worry about correlation versus causation in big data, because correlation is all we need for _______. unbiased estimation b) making predictions c) significance d) extrapolation a) 57
Big Data (2 of 2) Despite the very large data sets associated with big data, _______ due to recording errors and non-random sampling does not go away. correlation b) bias c) significance d) regression a) 58
- Slides: 58