
Chapter 5 Financial Reporting and Analysis Power Point

- Slides: 50
Chapter 5 Financial Reporting and Analysis Power. Point Authors: Brandy Mackintosh Lindsay Heiser Mc. Graw-Hill/Irwin Copyright © 2013 by The Mc. Graw-Hill Companies, Inc. All rights reserved.
Learning Objective 5 -1 Explain the needs of financial statement users. 5 -2
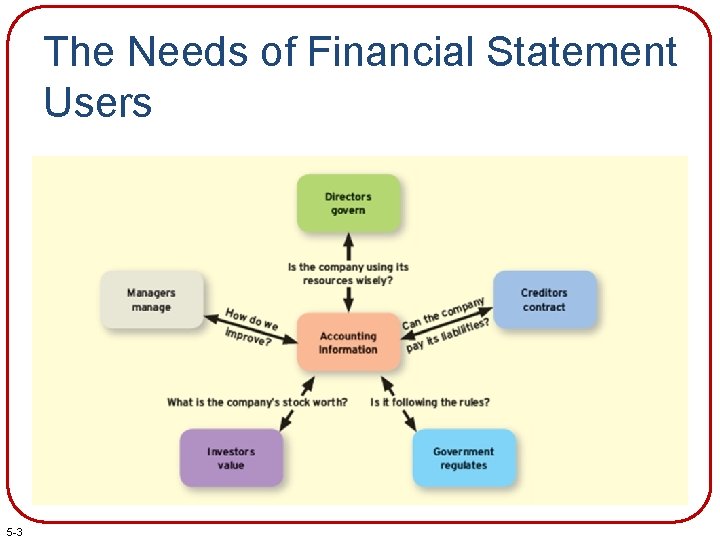
The Needs of Financial Statement Users 5 -3
Learning Objective 5 -2 Describe the environment for financial reporting, including the Sarbanes-Oxley Act. 5 -4
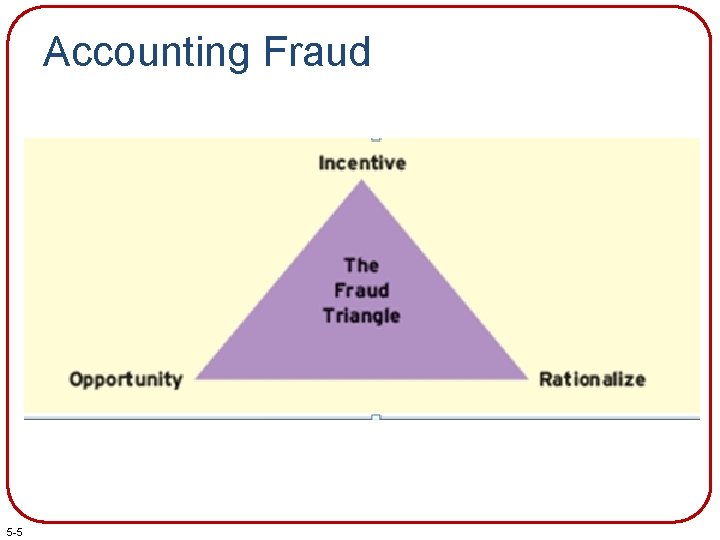
Accounting Fraud 5 -5
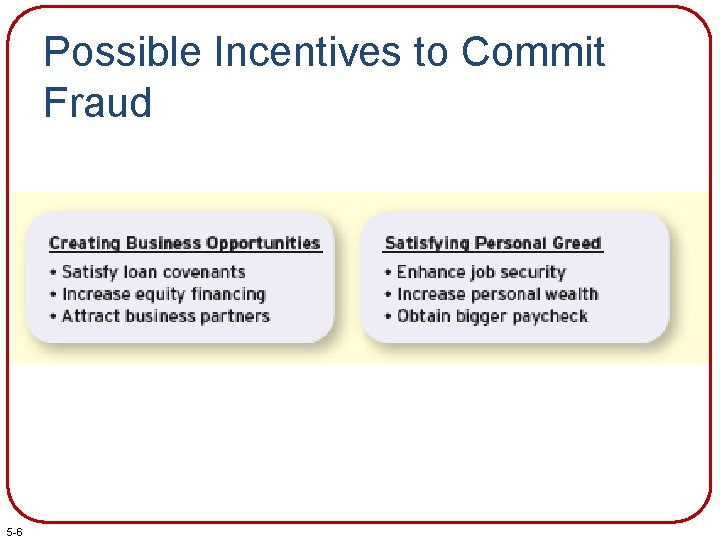
Possible Incentives to Commit Fraud 5 -6
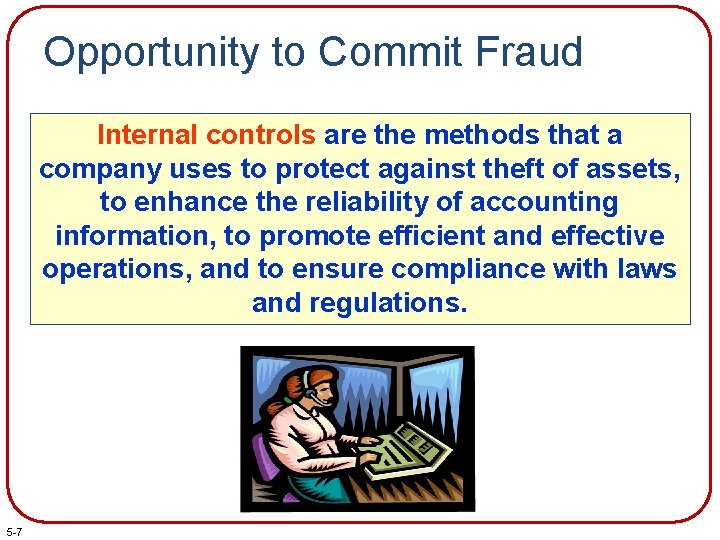
Opportunity to Commit Fraud Internal controls are the methods that a company uses to protect against theft of assets, to enhance the reliability of accounting information, to promote efficient and effective operations, and to ensure compliance with laws and regulations. 5 -7
Character to Rationalize and Conceal Fraud Most fraudsters have a sense of personal entitlement, which outweighs other moral principles, such as fairness, honesty, and concern for others. 5 -8
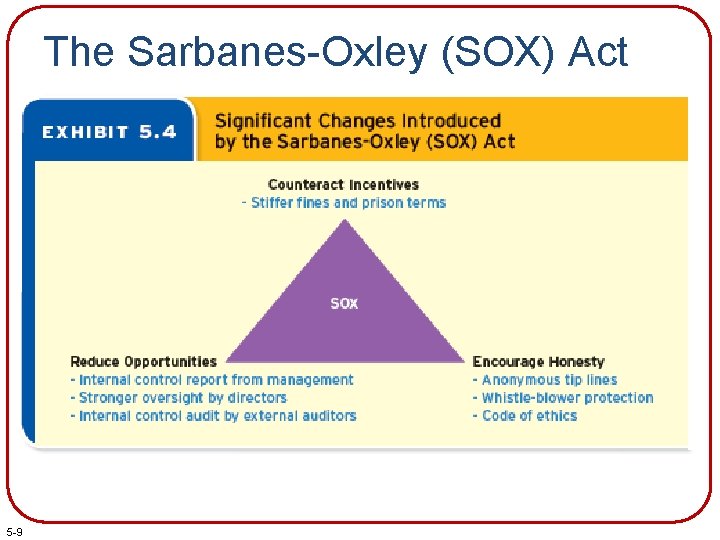
The Sarbanes-Oxley (SOX) Act 5 -9
Learning Objective 5 -3 Prepare a comparative balance sheet, multistep income statement, and statement of stockholders’ equity. 5 -10
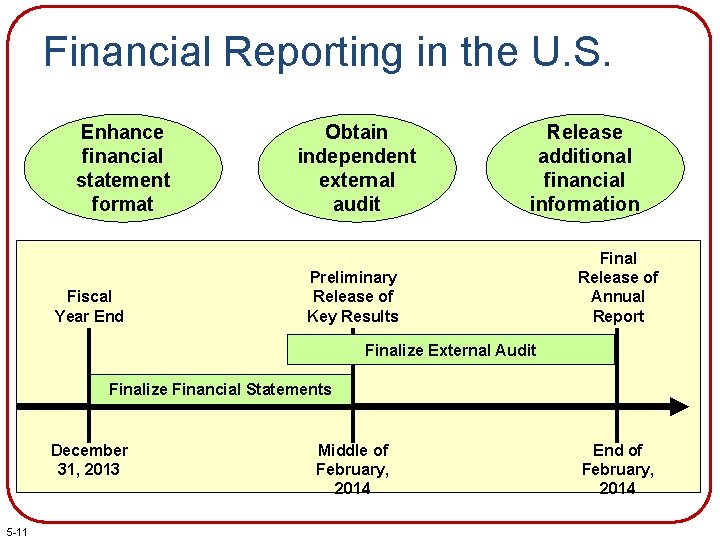
Financial Reporting in the U. S. Enhance financial statement format Fiscal Year End Obtain independent external audit Release additional financial information Preliminary Release of Key Results Final Release of Annual Report Finalize External Audit Finalize Financial Statements December 31, 2013 5 -11 Middle of February, 2014 End of February, 2014
Comparative Financial Statements ACTIVISION BLIZZARD, INC. Balance Sheet (in millions of U. S. dollars) December 31, 2010 Assets Current Assets Cash Short-term Investments Accounts Receivable Inventories Other Current Assets Total Current Assets Property and Equipment, net Other Noncurrent Assets Goodwill Total Assets Liabilities and Stockholders’ Equity Current Liabilities: Accounts Payable Unearned Revenue Accrued and Other Liabilities Total Current Liabilities Other Noncurrent Liabilities Total Liabilities Stockholders’ Equity Contributed Capital Retained Earnings (Accumulated Deficit) Total Stockholders’ Equity Total Liabilities and Stockholders’ Equity 5 -12 December 31, 2009 $ 2, 812 696 640 112 1, 125 5, 385 169 720 7, 132 $13, 406 $ 2, 768 477 739 241 1, 104 5, 329 138 1, 121 7, 154 $13, 742 $ $ 363 1, 726 818 2, 907 296 3, 203 10, 146 57 10, 203 $13, 406 302 1, 426 779 2, 507 479 2, 986 11, 117 (361) 10, 756 $13, 742 A comparative format reveals changes over time.
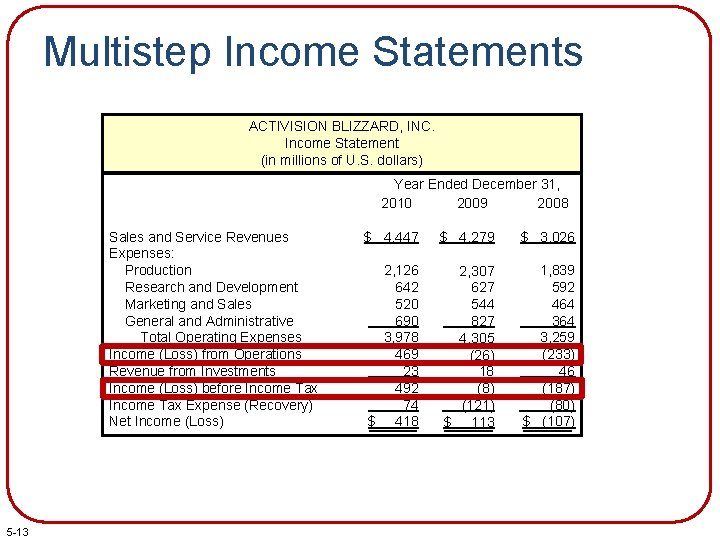
Multistep Income Statements ACTIVISION BLIZZARD, INC. Income Statement (in millions of U. S. dollars) Year Ended December 31, 2008 2010 2009 Sales and Service Revenues Expenses: Production Research and Development Marketing and Sales General and Administrative Total Operating Expenses Income (Loss) from Operations Revenue from Investments Income (Loss) before Income Tax Expense (Recovery) Net Income (Loss) 5 -13 $ 4, 447 $ 4, 279 $ 3, 026 2, 126 642 520 690 3, 978 469 23 492 74 $ 418 2, 307 627 544 827 4, 305 (26) 18 (8) (121) $ 113 1, 839 592 464 3, 259 (233) 46 (187) (80) $ (107)
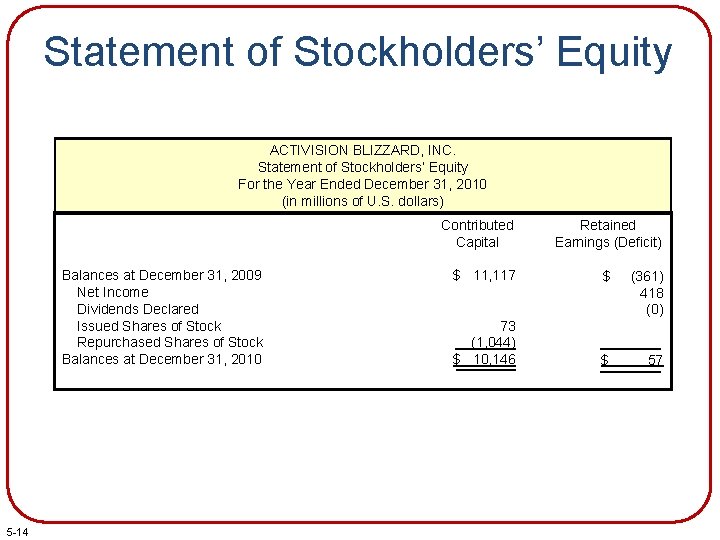
Statement of Stockholders’ Equity ACTIVISION BLIZZARD, INC. Statement of Stockholders’ Equity For the Year Ended December 31, 2010 (in millions of U. S. dollars) Contributed Capital Balances at December 31, 2009 Net Income Dividends Declared Issued Shares of Stock Repurchased Shares of Stock Balances at December 31, 2010 5 -14 Retained Earnings (Deficit) $ 11, 117 $ (361) 418 (0) 73 (1, 044) $ 10, 146 $ 57
Learning Objective 5 -4 Describe other significant aspects of the financial reporting process, including external audits and the distribution of financial information. 5 -15
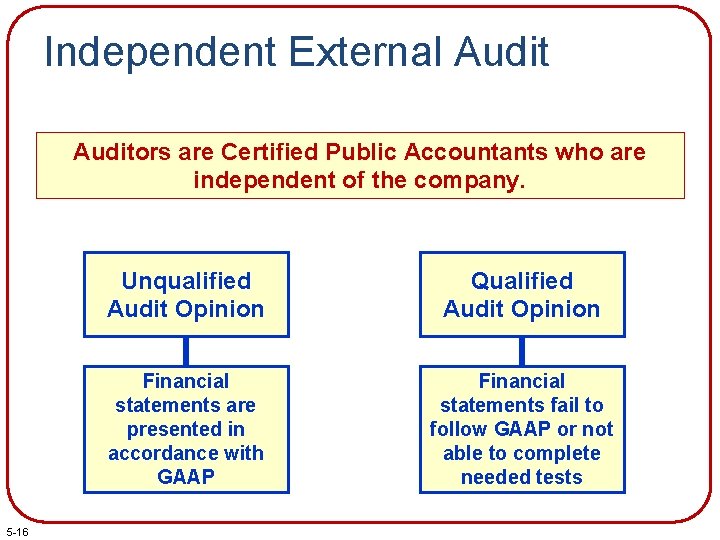
Independent External Auditors are Certified Public Accountants who are independent of the company. 5 -16 Unqualified Audit Opinion Qualified Audit Opinion Financial statements are presented in accordance with GAAP Financial statements fail to follow GAAP or not able to complete needed tests
Preliminary Releases Most public companies announce quarterly and annual earnings through a press release that is sent to news agencies. 5 -17
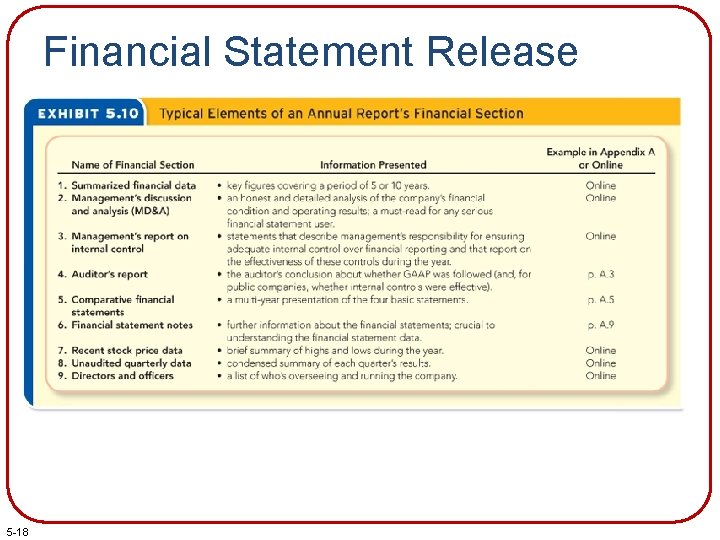
Financial Statement Release 5 -18
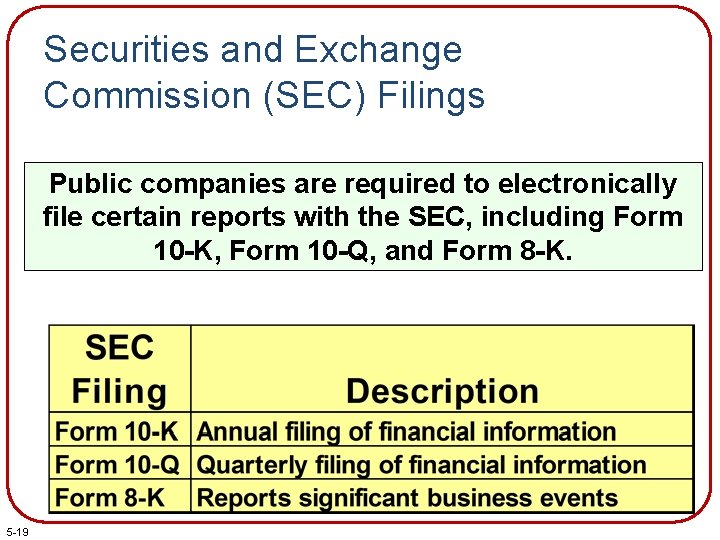
Securities and Exchange Commission (SEC) Filings Public companies are required to electronically file certain reports with the SEC, including Form 10 -K, Form 10 -Q, and Form 8 -K. 5 -19
Learning Objective 5 -5 Explain the reasons for, and financial statement presentation effects of, adopting IFRS. 5 -20
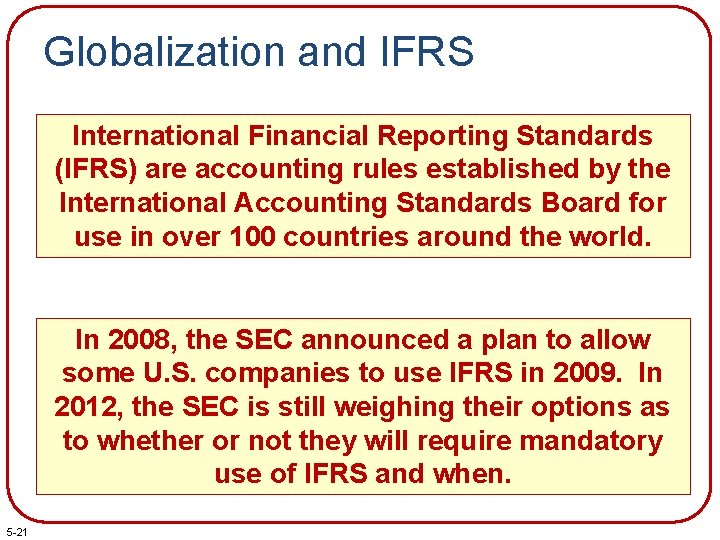
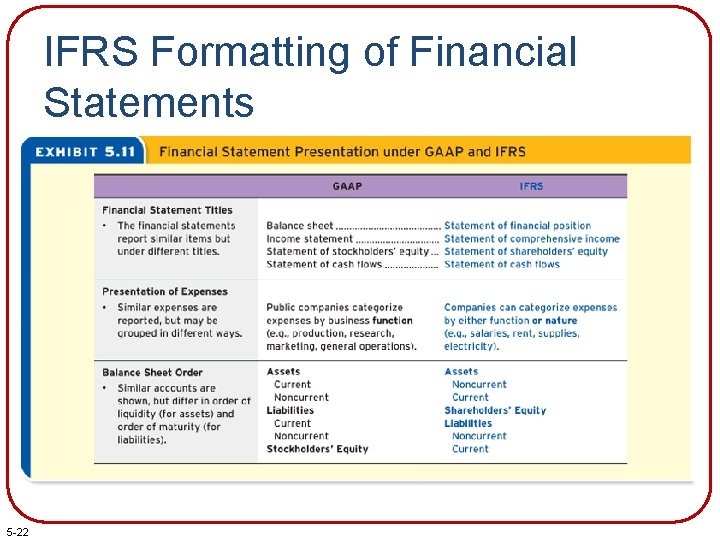
Globalization and IFRS International Financial Reporting Standards (IFRS) are accounting rules established by the International Accounting Standards Board for use in over 100 countries around the world. In 2008, the SEC announced a plan to allow some U. S. companies to use IFRS in 2009. In 2012, the SEC is still weighing their options as to whether or not they will require mandatory use of IFRS and when. 5 -21
IFRS Formatting of Financial Statements 5 -22
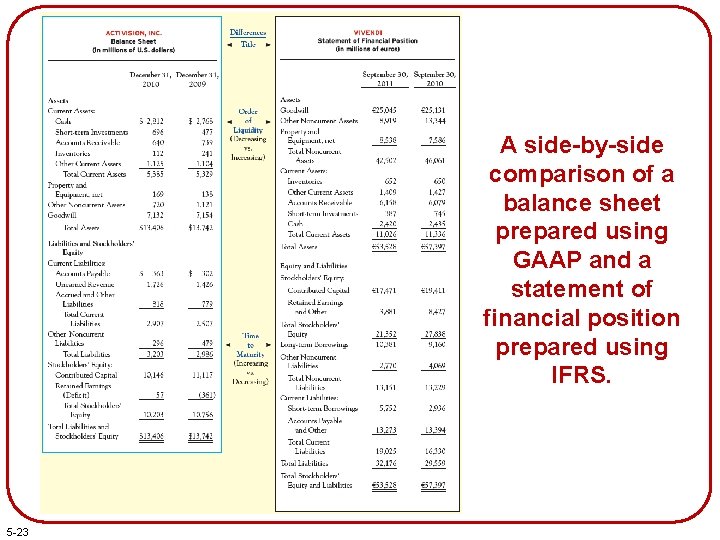
A side-by-side comparison of a balance sheet prepared using GAAP and a statement of financial position prepared using IFRS. 5 -23
Learning Objective 5 -6 Compare results to common benchmarks. 5 -24
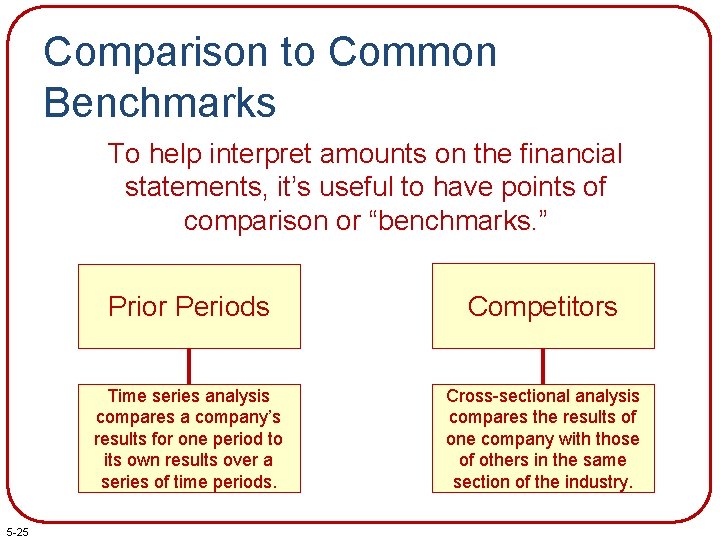
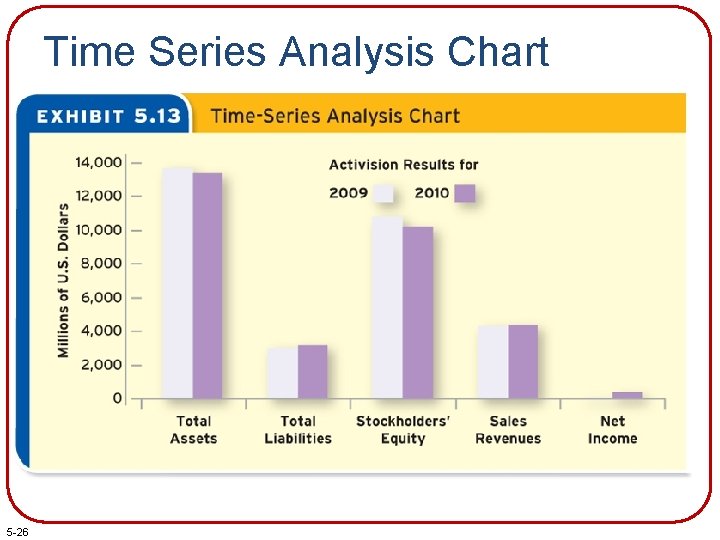
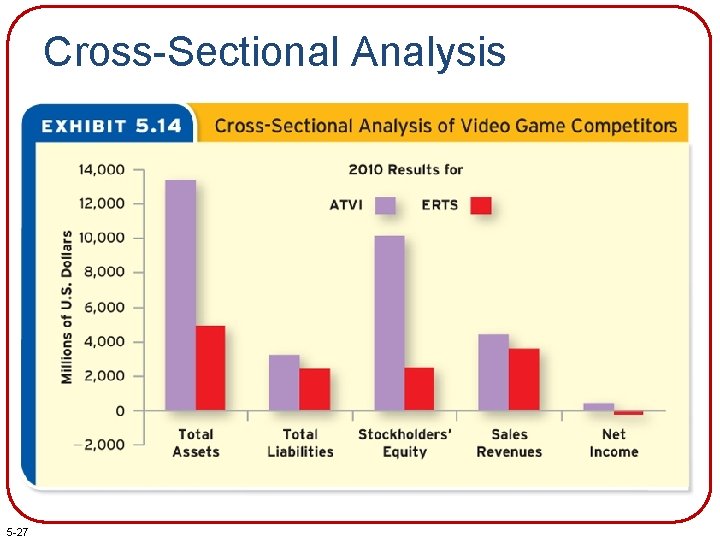
Comparison to Common Benchmarks To help interpret amounts on the financial statements, it’s useful to have points of comparison or “benchmarks. ” 5 -25 Prior Periods Competitors Time series analysis compares a company’s results for one period to its own results over a series of time periods. Cross-sectional analysis compares the results of one company with those of others in the same section of the industry.
Time Series Analysis Chart 5 -26
Cross-Sectional Analysis 5 -27
Learning Objective 5 -7 Calculate and interpret the debt-to-assets, asset turnover, and net profit margin ratios. 5 -28
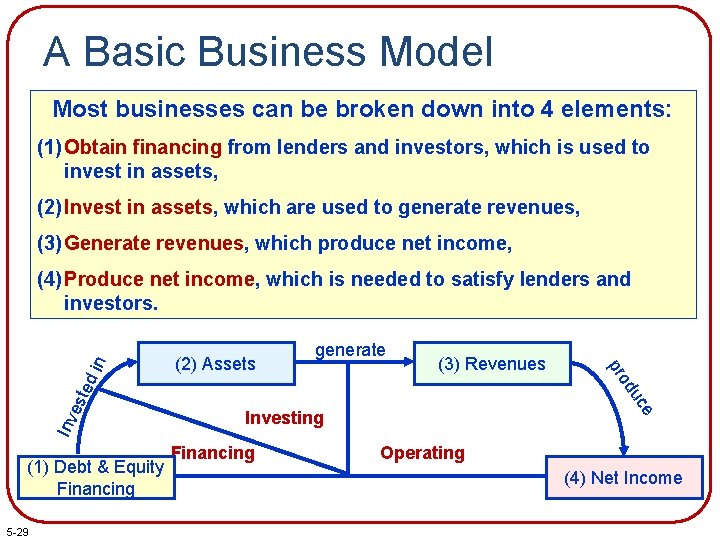
A Basic Business Model Most businesses can be broken down into 4 elements: (1) Obtain financing from lenders and investors, which is used to invest in assets, (2) Invest in assets, which are used to generate revenues, (3) Generate revenues, which produce net income, (3) Revenues est Inv (1) Debt & Equity Financing 5 -29 e uc ed (2) Assets generate Investing Financing od pr in (4) Produce net income, which is needed to satisfy lenders and investors. Operating (4) Net Income
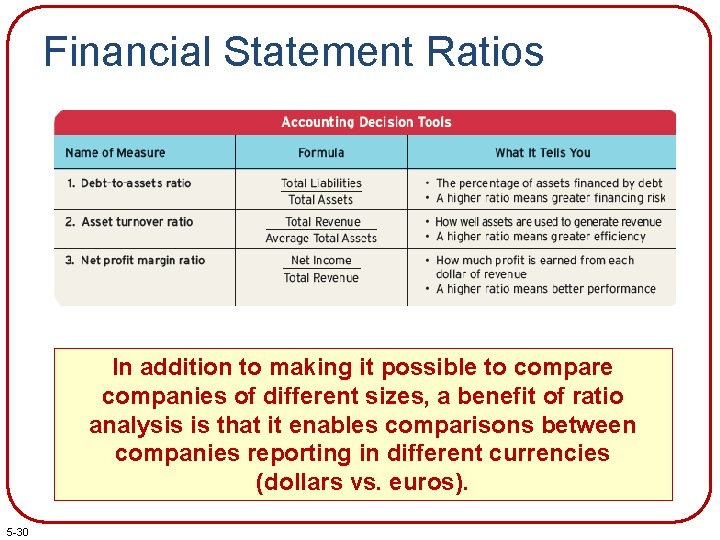
Financial Statement Ratios In addition to making it possible to compare companies of different sizes, a benefit of ratio analysis is that it enables comparisons between companies reporting in different currencies (dollars vs. euros). 5 -30
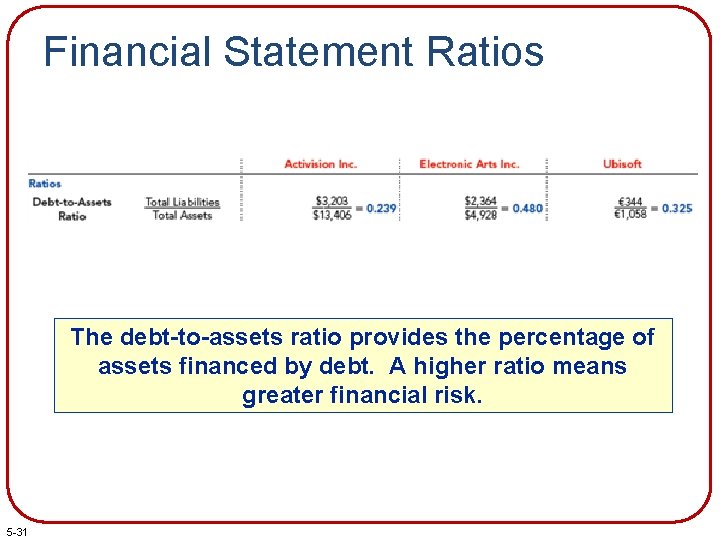
Financial Statement Ratios The debt-to-assets ratio provides the percentage of assets financed by debt. A higher ratio means greater financial risk. 5 -31
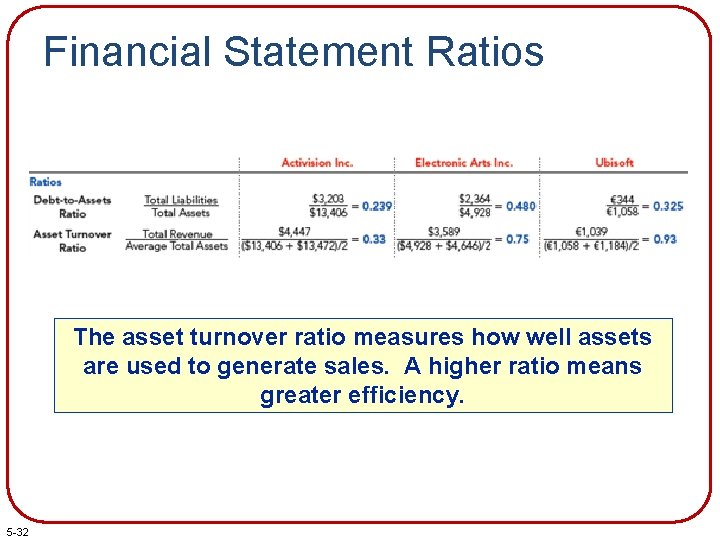
Financial Statement Ratios The asset turnover ratio measures how well assets are used to generate sales. A higher ratio means greater efficiency. 5 -32
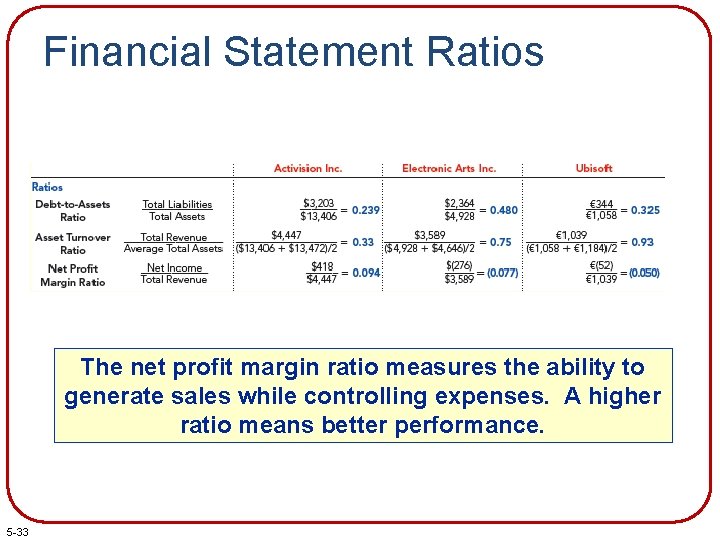
Financial Statement Ratios The net profit margin ratio measures the ability to generate sales while controlling expenses. A higher ratio means better performance. 5 -33
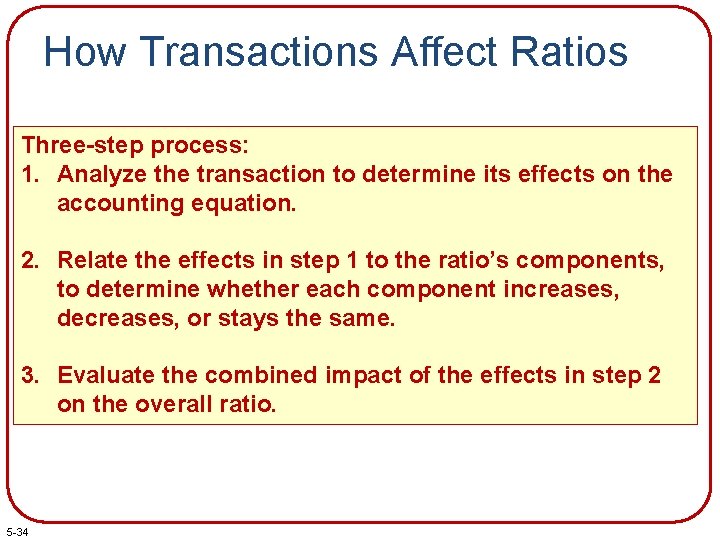
How Transactions Affect Ratios Three-step process: 1. Analyze the transaction to determine its effects on the accounting equation. 2. Relate the effects in step 1 to the ratio’s components, to determine whether each component increases, decreases, or stays the same. 3. Evaluate the combined impact of the effects in step 2 on the overall ratio. 5 -34
Chapter 5 Solved Exercises M 5 -4, M 5 -5, M 5 -9, M 5 -10, E 5 -8, E 5 -11 Mc. Graw-Hill/Irwin Copyright © 2013 by The Mc. Graw-Hill Companies, Inc. All rights reserved.
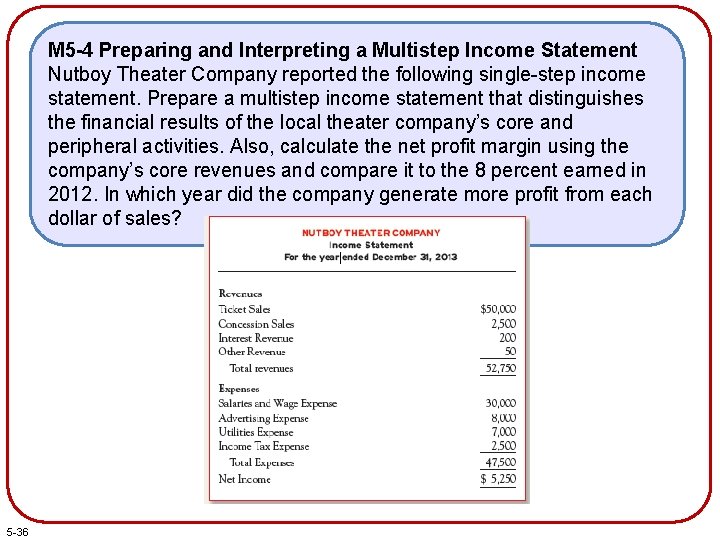
M 5 -4 Preparing and Interpreting a Multistep Income Statement Nutboy Theater Company reported the following single-step income statement. Prepare a multistep income statement that distinguishes the financial results of the local theater company’s core and peripheral activities. Also, calculate the net profit margin using the company’s core revenues and compare it to the 8 percent earned in 2012. In which year did the company generate more profit from each dollar of sales? 5 -36
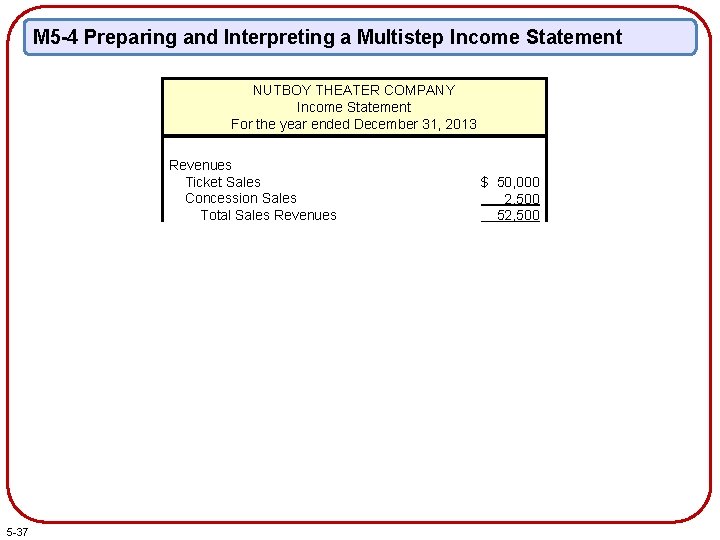
M 5 -4 Preparing and Interpreting a Multistep Income Statement NUTBOY THEATER COMPANY Income Statement For the year ended December 31, 2013 Revenues Ticket Sales Concession Sales Total Sales Revenues Operating Expenses: Salaries and Wage Expense Advertising Expense Utilities Expense Total Operating Expenses Income from Operations Other Revenue (Expense): Interest Revenue Other Revenue Income before Income Tax Expense Net Income $ 50, 000 2, 500 52, 500 30, 000 8, 000 7, 000 45, 000 7, 500 $ 200 50 7, 750 2, 500 5, 250 Net Profit Margin = Net Income/Total Sales Revenues = $5, 250 / $52, 500 = 10% 5 -37
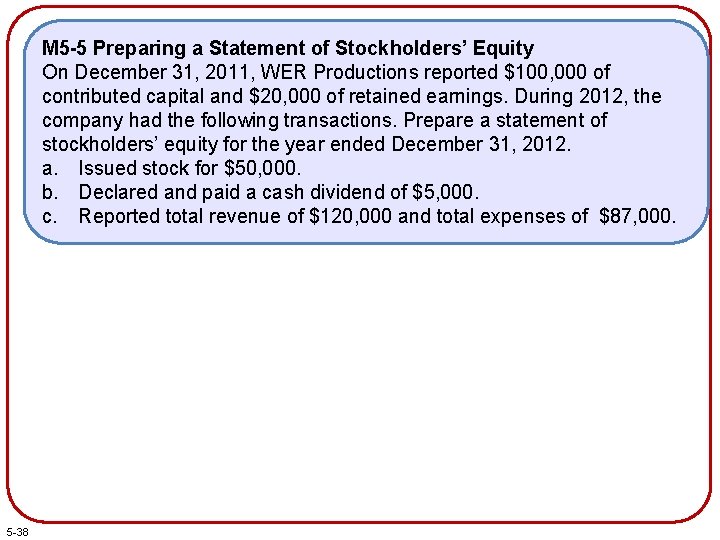
M 5 -5 Preparing a Statement of Stockholders’ Equity On December 31, 2011, WER Productions reported $100, 000 of contributed capital and $20, 000 of retained earnings. During 2012, the company had the following transactions. Prepare a statement of stockholders’ equity for the year ended December 31, 2012. a. Issued stock for $50, 000. b. Declared and paid a cash dividend of $5, 000. c. Reported total revenue of $120, 000 and total expenses of $87, 000. 5 -38
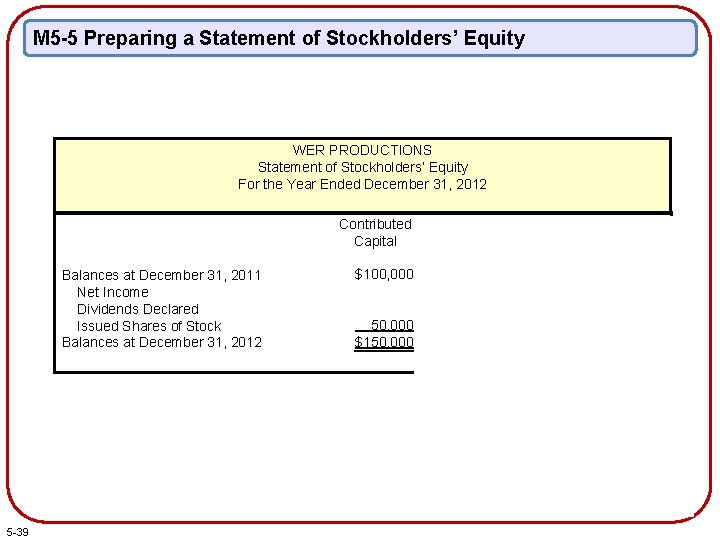
M 5 -5 Preparing a Statement of Stockholders’ Equity WER PRODUCTIONS Statement of Stockholders’ Equity For the Year Ended December 31, 2012 Balances at December 31, 2011 Net Income Dividends Declared Issued Shares of Stock Balances at December 31, 2012 5 -39 Contributed Capital Retained Earnings Stockholders' Equity $100, 000 $ 20, 000 33, 000 (5, 000) $120, 000 33, 000 (5, 000) 50, 000 $198, 000 50, 000 $150, 000 $ 48, 000
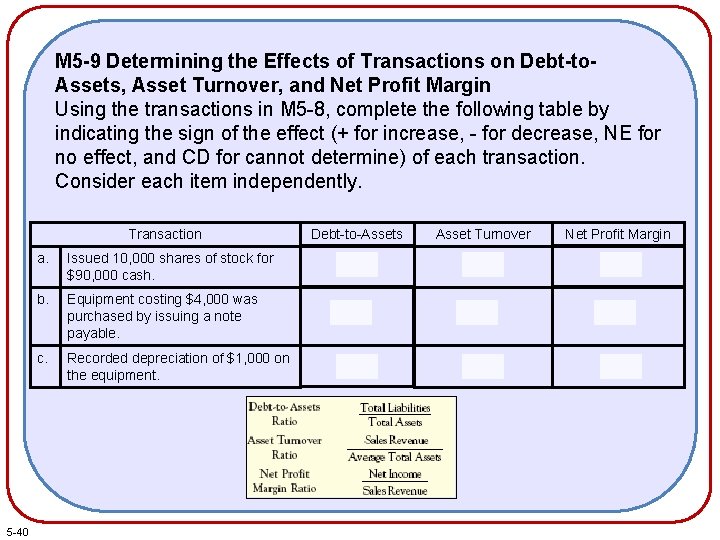
M 5 -9 Determining the Effects of Transactions on Debt-to. Assets, Asset Turnover, and Net Profit Margin Using the transactions in M 5 -8, complete the following table by indicating the sign of the effect (+ for increase, - for decrease, NE for no effect, and CD for cannot determine) of each transaction. Consider each item independently. Transaction 5 -40 Debt-to-Assets Asset Turnover Net Profit Margin a. Issued 10, 000 shares of stock for $90, 000 cash. - - NE b. Equipment costing $4, 000 was purchased by issuing a note payable. + - NE c. Recorded depreciation of $1, 000 on the equipment. + + -
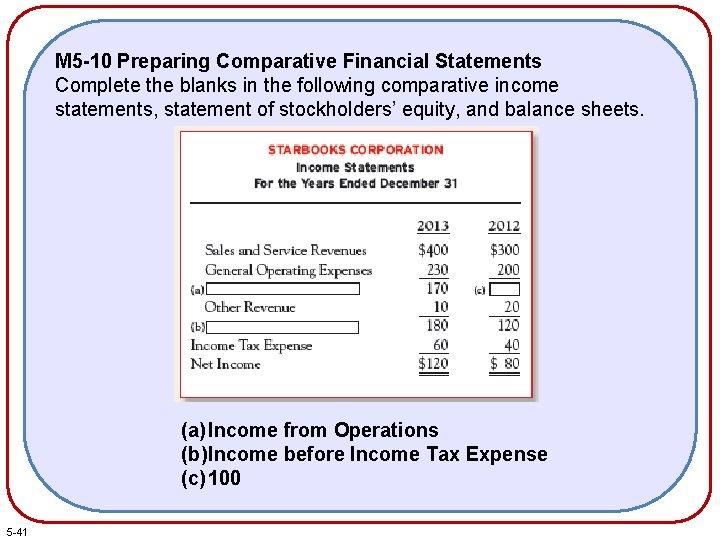
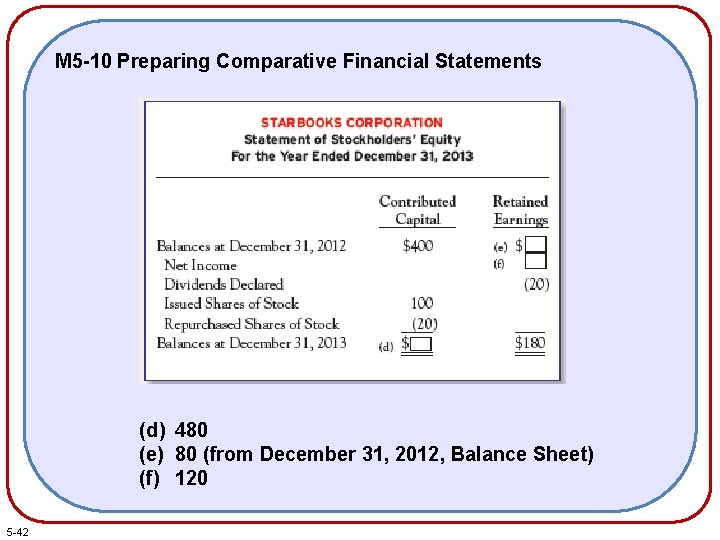
M 5 -10 Preparing Comparative Financial Statements Complete the blanks in the following comparative income statements, statement of stockholders’ equity, and balance sheets. (a) Income from Operations (b) Income before Income Tax Expense (c) 100 5 -41
M 5 -10 Preparing Comparative Financial Statements (d) 480 (e) 80 (from December 31, 2012, Balance Sheet) (f) 120 5 -42
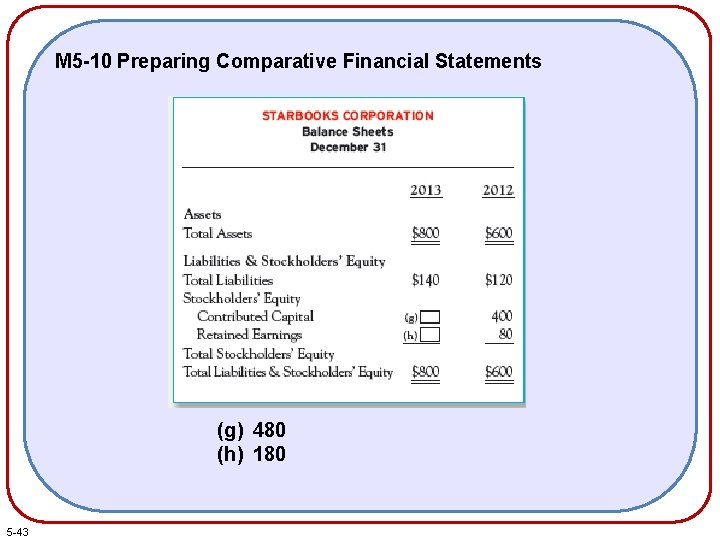
M 5 -10 Preparing Comparative Financial Statements (g) 480 (h) 180 5 -43
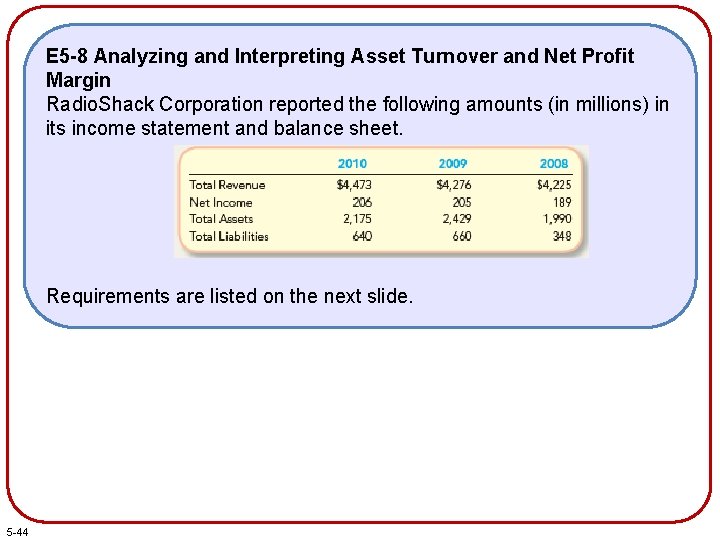
E 5 -8 Analyzing and Interpreting Asset Turnover and Net Profit Margin Radio. Shack Corporation reported the following amounts (in millions) in its income statement and balance sheet. Requirements are listed on the next slide. 5 -44
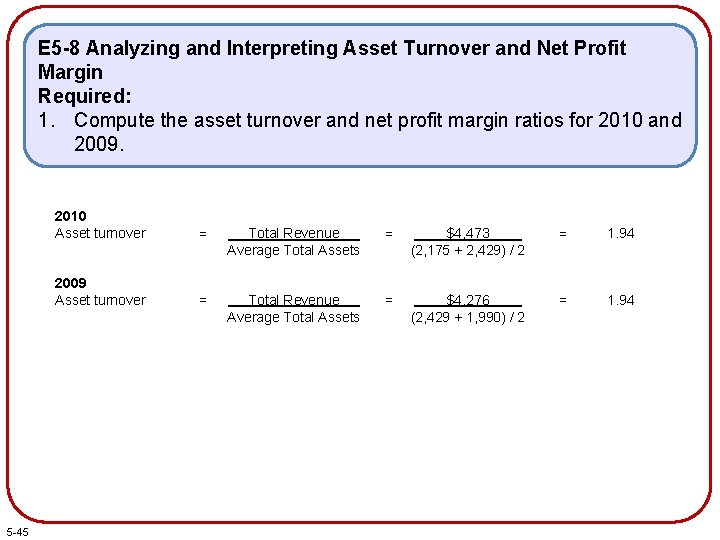
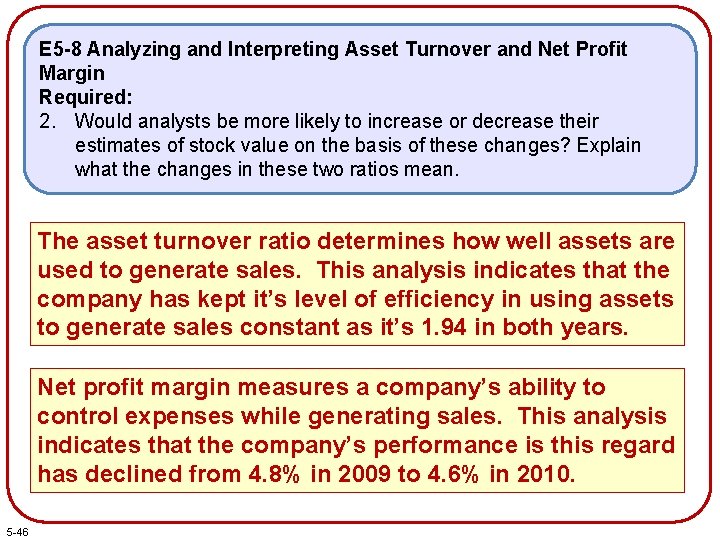
E 5 -8 Analyzing and Interpreting Asset Turnover and Net Profit Margin Required: 1. Compute the asset turnover and net profit margin ratios for 2010 and 2009. 5 -45 2010 Asset turnover = Total Revenue Average Total Assets = $4, 473 (2, 175 + 2, 429) / 2 = 1. 94 2009 Asset turnover = Total Revenue Average Total Assets = $4, 276 (2, 429 + 1, 990) / 2 = 1. 94 2010 Net profit margin = Net Income Total Revenue = 206 4, 473 = 0. 046 = 4. 6% 2009 Net profit margin = Net Income Total Revenue = 205 4, 276 = 0. 048 = 4. 8%
E 5 -8 Analyzing and Interpreting Asset Turnover and Net Profit Margin Required: 2. Would analysts be more likely to increase or decrease their estimates of stock value on the basis of these changes? Explain what the changes in these two ratios mean. The asset turnover ratio determines how well assets are used to generate sales. This analysis indicates that the company has kept it’s level of efficiency in using assets to generate sales constant as it’s 1. 94 in both years. Net profit margin measures a company’s ability to control expenses while generating sales. This analysis indicates that the company’s performance is this regard has declined from 4. 8% in 2009 to 4. 6% in 2010. 5 -46
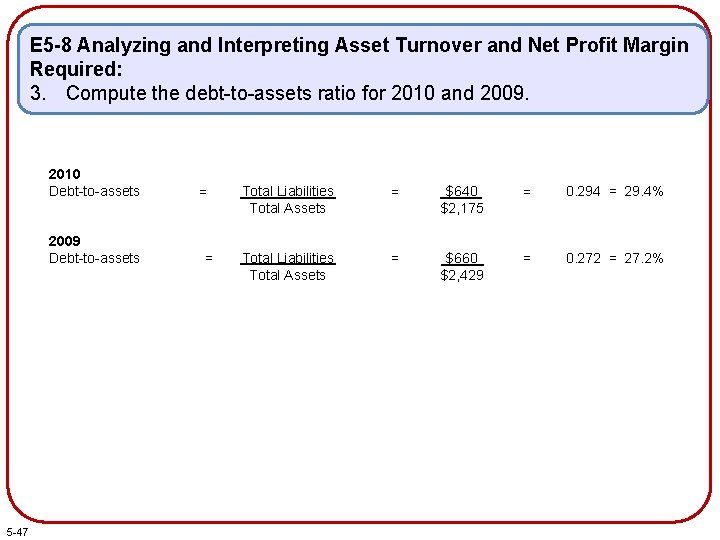
E 5 -8 Analyzing and Interpreting Asset Turnover and Net Profit Margin Required: 3. Compute the debt-to-assets ratio for 2010 and 2009. 2010 Debt-to-assets 2009 Debt-to-assets 5 -47 = = Total Liabilities Total Assets = $640 $2, 175 = 0. 294 = 29. 4% Total Liabilities Total Assets = $660 $2, 429 = 0. 272 = 27. 2%
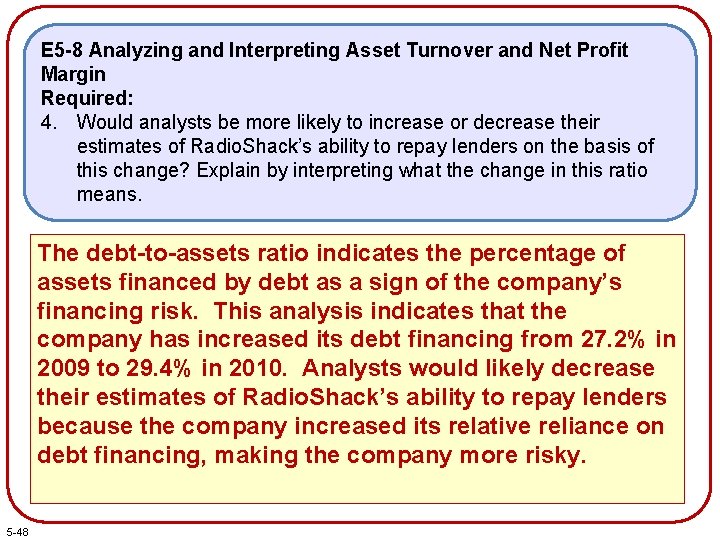
E 5 -8 Analyzing and Interpreting Asset Turnover and Net Profit Margin Required: 4. Would analysts be more likely to increase or decrease their estimates of Radio. Shack’s ability to repay lenders on the basis of this change? Explain by interpreting what the change in this ratio means. The debt-to-assets ratio indicates the percentage of assets financed by debt as a sign of the company’s financing risk. This analysis indicates that the company has increased its debt financing from 27. 2% in 2009 to 29. 4% in 2010. Analysts would likely decrease their estimates of Radio. Shack’s ability to repay lenders because the company increased its relative reliance on debt financing, making the company more risky. 5 -48
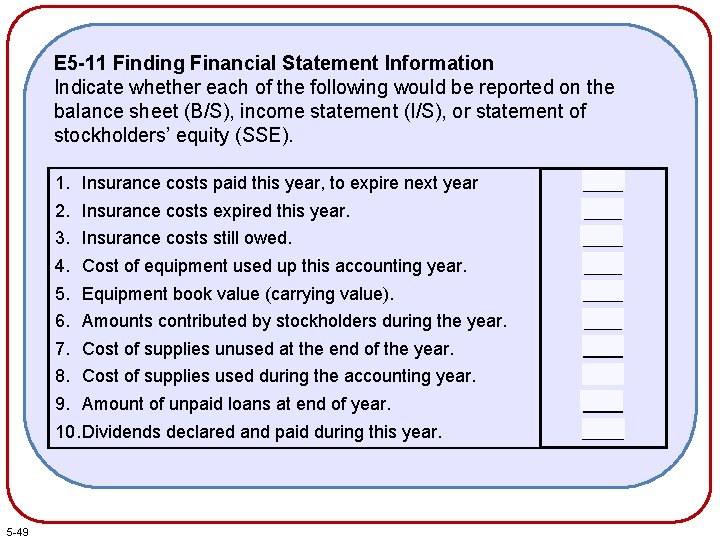
E 5 -11 Finding Financial Statement Information Indicate whether each of the following would be reported on the balance sheet (B/S), income statement (I/S), or statement of stockholders’ equity (SSE). 1. Insurance costs paid this year, to expire next year 2. Insurance costs expired this year. 3. Insurance costs still owed. 4. Cost of equipment used up this accounting year. 5. Equipment book value (carrying value). 6. Amounts contributed by stockholders during the year. 7. Cost of supplies unused at the end of the year. 8. Cost of supplies used during the accounting year. 9. Amount of unpaid loans at end of year. 10. Dividends declared and paid during this year. 5 -49 B/S I/S B/S SSE
End of Chapter 5 5 -50