Chapter 4 The Human Population and the Environment


 • Logistic Growth –")

")


")


- Slides: 35
Chapter 4: The Human Population and the Environment
Overview • • Basic Concepts of Population Dynamics Projecting Future Population Growth Age Structure The Demographic Transition Longevity and its Effects on Population Growth The Human Population’s Effects on the Earth The Human Carrying Capacity of the Earth Can We Achieve Zero-population Growth?
Basic Concepts of Population Dynamics • Population Dynamics – A general study of population changes • Population – Group of individuals of the same species living in the same area • Species – All individuals that are capable of interbreeding – A species is made up of populations • Demography – statistical study of human populations
Basic Concepts of Population Dynamics • Five key properties of any population – Abundance – Birth rates – Death rates – Growth rates – Age structure • Human Population data often reported as crude rates (per 1000 people)
Kinds of Population Growth • Exponential Growth – A pop increasing by a constant percentage per unit time. • Human pop growth peaked at 2. 1% – 1965 -1970 • Now at 1. 2%
US Population Growth
History of Human Population Growth 1. Early period of hunter and gathers – Total population < a few million 2. Rise of agriculture – Allowed for increase in population density and increase in human population 3. Industrial revolution – Improvements in health and food supply led to rapid increase in population 4. Today – Rate of growth slow in industrialized nations but high in less developed nations
Human Population Growth
Projecting Future Population Growth • Doubling time – Time required for a pop to double in size – Calculated by dividing annual growth rate (%) into 70 – It changes quickly as growth rate changes • Examples – US w/ a growth rate of 0. 6%, doubling time = 117 yrs – Nicaragua w/ a growth rate of 2. 7%, doubling time = 26 yrs – Northern Europe w/ a growth rate of 0. 2%, doubling time = 350 yrs
Doubling Time
World Growth Rate • Peaked in 1960 s at 2. 2% • Currently at 1. 1% • Current doubling time = 66 years
Logistic Growth Curve • Growth cannot continue forever (exponential growth) • Logistic Growth – S shaped curve – Growth increase exponentially only temporarily, until hits inflection point – Reach an upper pop limit at the logistic carrying capacity where the growth rate = 0
Logistic Growth Curve • Little evidence that animal populations actually follow this growth curve • Involves assumptions – Constant environment – Constant carrying capacity – Homogeneous population • Unlikely if death rate continue to decrease
UN Projections of Human Growth Based on potential total fertility rates (TFR)
Age Structure • Exponential and Logistic Growth curves ignore characteristics of the environment that affect different age groups – Food, water, shelter, disease • Age Structure- express how population is divided among age groups – Implication for current and future social and economic conditions – Impact on the environment
Age Structure- 4 Types • Pyramid - population w/ many young and high death rate (short average lifetime) • Inverted pyramid population with large elderly population and small youth population (declining growth)
Age Structure- 4 Types • Column - birth rate and death rate are low, little change in population size • Column w/ a bulge event in the past caused a high birth or death rate for some age group
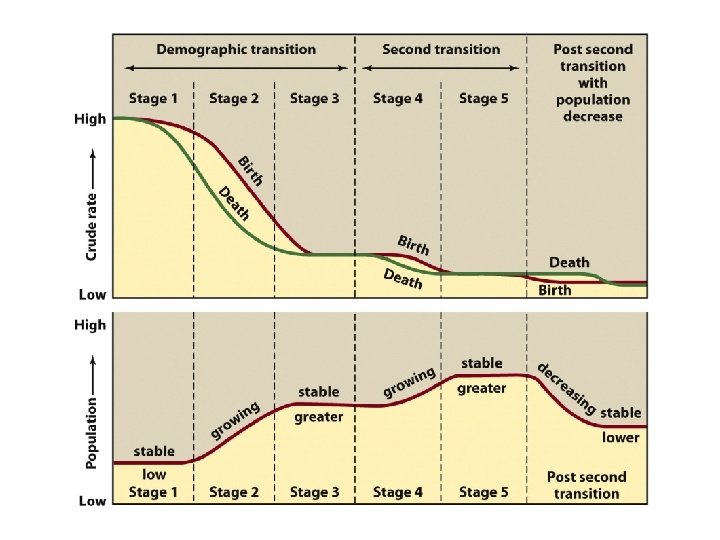
Demographic Transition • Three stage pattern of change in birth rates and death rates – Occurred during the process of industrial and economic development of Western nations – Leads to decline in population growth rate
Demographic Transition • Stage 1 – Decline in death rate – Developed countries (top) and Developing countries (bottom) • Stage 2 – Period of high growth rate – W/ industrialization death rate declines but birth rate stays high
Demographic Transition • Stage 3 – Birth rate drops toward death rate – Growth rate decreases – Will take place if parents come to believe that having a small family is to their benefit
Potential Effects of Medical Advances on Demographic Transition • Second decline in death rate – Leads to Stage IV • A second stable state would arise if birth rate then falls – Stage V • Decision needs to be made – Stop research on diseases of old age – Reduce birth rate – Or do neither and wait for Malthus’ projections
Changes in birth and death rates from 1775 -2000 in developed and developing countries
Longevity and its Effects on Population Growth • Maximum lifetime – Maximum possible age to which an individual in a species can live • Life expectancy – Average number of years an individual in a species can expect to live – Higher in developed, prosperous nations • Japan highest at 82. 1 years • Swaziland lowest at 32 years
Longevity and Population Growth • Population growth occurred in human history with little change in maximum lifetime – Changes were in birth rates, death rates, age structure, etc.
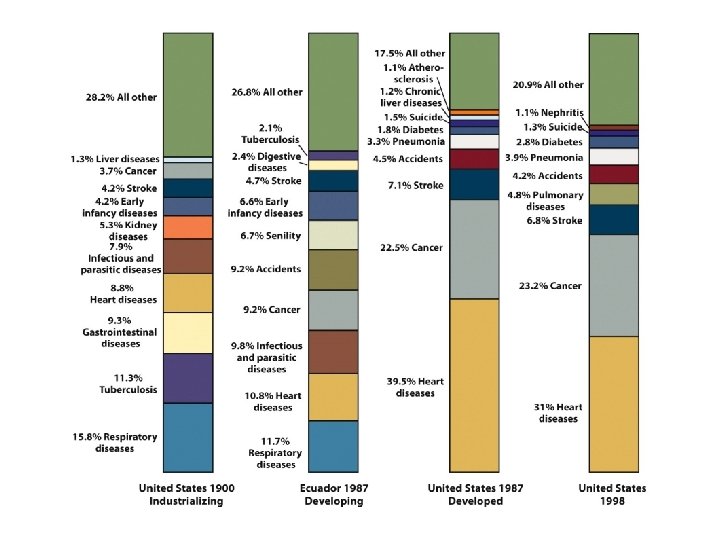
Effect of Rise of Industrial Societies • Modern medicine has reduced death rates • Acute diseases – Appears rapidly in the population and then disappears – Currently 60% of mortality in Ecuador, 20% in US • Chronic diseases – Always present in population (cancer, heart disease, etc. ) – Currently 70% of mortality in US, 20% in Ecuador • These figures have changed over time (see next slide)
Human Population Effects on Earth • Impact that all humans pose on the environment is a result of two factors – Number of people – Impact of each person on the environment • T=Px. I – T = Total impact of the human population on environment – I = average impact of an individual – P = total # of individuals (population size)
Human Population Effects on Earth • Modern technology increases the use of resources and enables us to effect the environment in new ways – Examples: CFCs, automobiles • (T = P x I) equation reveals irony: – Improving standard of living increases P – Countering the benefits of declining I
Human Carrying Capacity • How many people can live on Earth at the same time? – Depends on the quality of life people desire and are willing to accept • Estimation methods – Extrapolation from past growth – Packing problem approach – Deep Ecology
Human Carrying Capacity • Limiting Factors – Short Term- effect population immediately • Ex: Food shortages – Intermediate Term- effect population for 1 -10 years • Ex: desertification, dispersal of pollutants, etc. – Long Term- effects not apparent until after 10 years • Ex: soil erosion, decline in groundwater supply, climate change
Can We Achieve Zero Population Growth? • Possible approaches – Delay age of first child bearing – Birth control – National programs to reduce birth rates • Information (education) • Increase access to birth control
Garbology AP Lab 1. Collect all trash for a two-day period. 2. Set up a data chart with the categories for solid waste (paper, yard waste, metal, glass, plastic, food waste, and miscellaneous materials. Paper Yard Waste Metal Glass Plastic 3. Sort and weigh each category Food Waste Misc. materials
Garbology AP Lab 4. Add up the total mass from all trash collected 5. Multiply by 15 to get the total for one month 6. Divide each category subtotal by the total mass of garbage produced to get the mass percent for each category. 7. Make a chart or graph of each category using percent mass. Ex. pie graphs, bar graphs
Data Analysis – Percent by Mass 2005 Waste Produced Person paper 14% 34% 12% yard waste metal glass 12% plastic 7% 13% 7%