chapter 4 Energy Expenditure and Fatigue Learning Objectives

chapter 4 Energy Expenditure and Fatigue

Learning Objectives • Learn how exercise affects metabolism and how metabolism can be monitored to determine energy expenditure • Discover the underlying causes and sites of fatigue in muscles

Measuring Energy Costs of Exercise Direct calorimetry measures the body’s heat production to estimate energy expenditure Indirect calorimetry calculates energy expenditure from the ratio of CO 2 produced to O 2 consumed

A Direct Calorimeter for Human Use

Calculating Oxygen Consumption and Carbon Dioxide Production. . Calculating VO 2 and VCO 2 requires: – – – . Volume of air inspired (VI). Volume of air expired (VE) Fraction of O 2 in the inspired air (FIO 2) Fraction of CO 2 in the inspired air (FICO 2) Fraction of O 2 in the expired air (FEO 2) Fraction of CO 2 in the expired air (FECO 2)
. . . VO 2 =")
Calculating O 2 Consumption and CO 2 Production (L/min). . . VO 2 = (VI x FIO 2) – (VE x FEO 2). . . VCO 2 = (VE x FECO 2) – (VI x FICO 2)

Equipment Used to Measure O 2 Consumption and CO 2 Production in the Lab and the Field © Tom Roberts Photo courtesy of Cosmed Engineering

Haldane Transformation 3 gases make up inspired air: – oxygen (FIO 2 = 20. 93%) – carbon dioxide (FICO 2 = 0. 04%) – nitrogen (FIN 2 = 79. 03%) Basic Haldane Transformation Equations. . (1) VI x FIN 2 = VE x FEN 2. . (2) VI = (VE x FEN 2) / FIN 2 (3) FEN 2 = 1 – (FEO 2 + FECO 2)

Rewriting the Haldane. Transformation Equations to Calculate VO 2. . . VO 2 = (VI x FIO 2) – (VE x FEO 2) Substitute into equation 2: . . . VO 2 = [(VE x FEN 2) / (FIN 2 x FIO 2)] – [(VE) x (FEO 2)] Substitute known values for FIO 2 and FIN 2: . . VO 2 = [(VE x FEN 2) / (0. 7903 x 0. 2093)]. – [(VE) x (FEO 2)]
 Substitute equation 3: .")
Rewriting the Haldane Transformation. Equations to Calculate VO 2 (continued) Substitute equation 3: . . VO 2 = [(VE) x (1 – (FEO 2 + FECO 2)). x (0. 2093 / 0. 7903)] – [(VE) x (FEO 2)] Simplified: . . VO 2 = (VE) x {[(1 – (FEO 2 + FECO 2)) x (0. 265)] – (FEO 2)}

Haldane Transformation Key Points • Three gases make up inspired air. • The Haldane transformation allows us to calculate VI. from VE because the nitrogen concentration is constant
 and oxygen.")
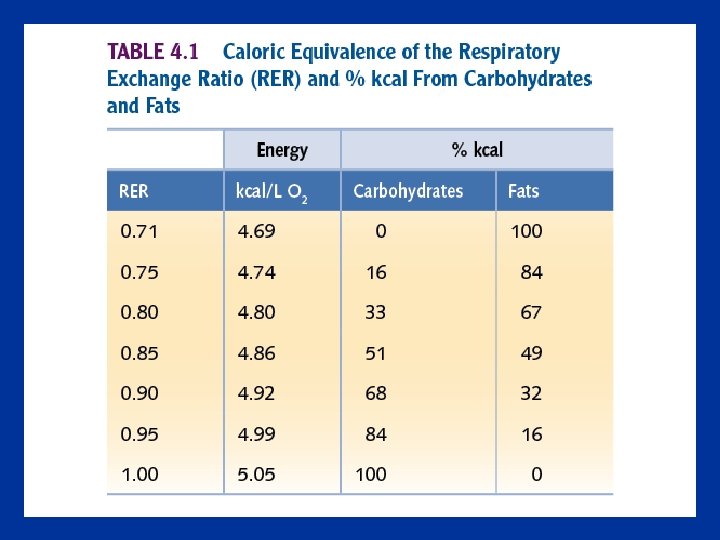
Respiratory Exchange Ratio. • The ratio between CO 2 released (VCO 2) and oxygen. consumed (VO 2). . • RER = VCO 2 / VO 2 • The RER value at rest is usually 0. 78 to 0. 80

RER: Determining Substrate Utilization Carbohydrate 6 O 2 + C 6 H 12 O 6 → 6 CO 2 + 6 H 2 O + 38 ATP. . RER = VCO 2 / VO 2 = 6 CO 2 / 6 O 2 = 1. 0 Fat C 16 H 32 O 2 + 23 O 2 → 16 CO 2 + 16 H 2 O + 129 ATP. . RER = VCO 2 / VO 2 = 16 CO 2 / 23 O 2 = 0. 70

Measurements of Energy Expenditure Carbon 13 is infused and selectively traced to determine the isotopes’ distribution and movement Doubly labeled water is ingested, and the rate at which the substance leaves the body is monitored in urine, saliva, and blood and is used to calculate how much CO 2 is produced, which can be converted into energy expenditure

Calorimetry Key Points • Direct calorimetry involves using a large chamber to directly measure heat production by the body • Indirect calorimetry involves measuring O 2 consumption and CO 2 production • RER at rest = 0. 78 to 0. 80 • RER oxidation of fat = 0. 70 • RER oxidation of carbohydrate = 1. 0 • Isotopes can be used to determine metabolic rate over long periods of time
 RMR is the minimum amount of energy required by the")
Resting Metabolic Rate (RMR) RMR is the minimum amount of energy required by the body to sustain basic cellular function – Fat-free mass – Body surface area – Ranges from 1, 100 to 2, 500 kcal/day – When activity is added, daily caloric expenditure is 1, 700 to 3, 100 kcal/day

Factors That Affect RMR • Age: RMR gradually decreases with age, generally because of a decrease in fat-free mass • Body temperature: RMR increases with increasing temperature • Psychological stress: Stress increases activity of the sympathetic nervous system • Hormones: Thyroxine from the thyroid gland epinephrine from the adrenal medulla both increase RMR

Metabolic Rate During Submaximal Exercise • Metabolism increases in direct proportion to the increase in exercise intensity • During exercise at a constant power output (work rate). VO 2 increases from its resting value to a steady-state value within 1 -2 minutes. • There is a linear increase in the VO 2 with increases in power output (work rate)

Increase in Oxygen Uptake with Increasing Power Output Reprinted, by permission, from G. A. Gaesser and D. C. Poole, 1996, “The slow component of oxygen uptake kinetics in humans, ” Exercise and Sport Sciences Reviews 24: 36.

Increase in Oxygen Uptake with Increasing Power Output Reprinted, by permission, from G. A. Gaesser and D. C. Poole, 1996, “The slow component of oxygen uptake kinetics in humans, ” Exercise and Sport Sciences Reviews 24: 36.

Maximal Oxygen Uptake • • • . VO 2 max: The maximal capacity for oxygen consumption by the body during maximal exertion Single best measurement of cardiorespiratory endurance and aerobic fitness Increases with physical training Generally expressed relative to body weight (ml · kg-1 · min-1) Normally active untrained college-aged students = 3842 ml · kg-1 · min-1. VO 2 max declines in active people after age 25 -30 by ~ 1% per year

Reasonable Values for VO 2 Category or Level ml. kg-1 min-1 ml. min-1 METS Male (75 kg) Female (60 kg) 3. 5 262 210 1 1 Maximal 20 yrs Old 45 -60 35 -50 33754500 21003000 13 -17 10 -14 Maximal 60 yrs Old 30 -40 25 -35 22503000 15002100 8 -11 7 -10 Elite Endurance Athlete 80 70 6000 4200 23 20 Rest

Relationship Between Exercise Intensity and Oxygen Uptake in Trained and Untrained Man

Estimating Anaerobic Effort • O 2 consumption requires several minutes to reach the required steady state level at which the aerobic processes are fully functional • Oxygen deficit is calculated as the difference between the oxygen required for a given exercise intensity and the actual oxygen consumption • Anaerobic effort can be estimated by examining excess postexercise oxygen consumption (EPOC)—the mismatch between O 2 consumption and energy requirements

Oxygen Requirement During Exercise and Recovery

Factors Responsible for EPOC • Rebuilding depleted ATP and PCr supplies • Clearing lactate produced by anaerobic metabolism • Replenishing O 2 supplies borrowed from hemoglobin and myoglobin • Removing CO 2 that has accumulated in body tissues • Increased metabolic and respiratory rates due to increased body temperature

Lactate Threshold • It is the point at which blood lactate begins to accumulate substantially above resting concentrations during exercise of increasing intensity • The rate at which lactate production exceeds lactate clearance • Usually expressed as a percentage of maximal oxygen uptake • A high lactate threshold can indicate potential for better endurance performance • Lactate accumulation contributes to fatigue

Relationship Between Exercise Intensity and Blood Lactate Concentration
, when expressed as a percentage of")
Lactate Threshold and Endurance Performance Lactate threshold. (LT), when expressed as a percentage of VO 2 max, is one of the best determinants of an athlete’s pace in endurance events such as running and cycling. While untrained people typically. have LT around 50% to 60% of their VO 2 max, elite athletes may not reach LT until around 70% to 80%. VO 2 max.

Economy of Effort
 is")
Measuring Energy Use During Exercise Key Points • Excess postexercise oxygen consumption (EPOC) is the metabolic rate above resting levels after exercise • Lactate threshold is the point at which blood lactate production begins to exceed the body’s ability to clear or remove lactate • Individuals with higher lactate thresholds, . expressed as a percentage of VO 2 max, are capable of the best endurance performance • Aerobic endurance performance capacity is also associated with a high economy of effort
 • Accumulation")
Fatigue and its Causes • Energy delivery (ATP-PCr, anaerobic glycolysis, and oxidation) • Accumulation of metabolic by-products, such as lactate and H+ • Failure of the muscle fiber’s contractile mechanism • Alteration in the nervous system
 –")
Energy Systems and Fatigue • PCr depletion • Glycogen depletion (“hitting the wall”) – Pattern of glycogen depletion from Type I and II fibers depends on the duration and intensity of the activity – Glycogen depletion is selective to the muscle groups involved in the activity – Depletion of liver glycogen to increase blood glucose increases muscle glycogen utilization

Decline in Muscle Glycogen Adapted, by permission, from D. L. Costill, 1986, Inside running: Basics of sports physiology (Indianapolis: Benchmark Press). Copyright 1986 Cooper Publishing Group, Carmel, IN.

Glycogen Depletion in Different Muscle Fibers

Glycogen Depletion in Different Muscle Groups

High Muscle Temperature Impairs Skeletal Muscle Function and Metabolism Adapted, by permission, from S. D. R. Galloway and R. J. Maughan, 1997, "Effects of ambient temperature on the capacity to perform prolonged cycle exercise in man, " Medicine and Science in Sports and Exercise 29: 1240 -1249.

Metabolic By-Products and Fatigue • Short-duration activities depend on anaerobic glycolysis and produce lactate and H+ • Cells buffer H+ with bicarbonate (HCO 3–) to keep cell p. H between 6. 4 (at exhaustion) and 7. 1 • Intercellular p. H lower than 6. 9, however, slows glycolysis and ATP production • When p. H reaches 6. 4, H+ levels inhibit glycolysis and result in exhaustion

Changes in Muscle p. H During Sprint Exercise and Recovery

Neuromuscular Fatigue may involve: 1. Decreased release or synthesis of acetylcholine 2. Hyperactive acetylcholinesterase 3. Hypoactive acetylcholinesterase 4. Increased threshold for stimulation of the muscle fiber 5. Competition with ACh for the receptors on the muscle membrane 6. Potassium may leave the intracellular space, decreasing the membrane potential below resting values 7. Central nervous system fatigue

Causes of Fatigue Key Points • Fatigue may result from depletion of PCr or glycogen, which impairs ATP production • The H+ generated by lactic acid leads to fatigue by decreasing muscle p. H, which impairs the cellular processes of energy production and muscle contraction • Failure of neural transmission may cause some fatigue • The central nervous system may also limit exercise performance as a protective mechanism
- Slides: 43