
Chapter 4 Demand Section 1 Objectives 1 Explain

Chapter 4: Demand Section 1
Objectives 1. Explain the law of demand. 2. Describe how the substitution effect and the income effect influence decisions. 3. Create a demand schedule for an individual and a market. 4. Interpret a demand graph using demand schedules. Chapter 4, Section 1 Copyright © Pearson Education, Inc. Slide 2
Key Terms • demand: the desire to own something and the ability to pay for it • law of demand: consumers will buy more of a good when its price is lower and less when its price is higher • substitution effect: when consumers react to an increase in a good’s price by consuming less of that good and more of a substitute good Chapter 4, Section 1 Copyright © Pearson Education, Inc. Slide 3
Key Terms, cont. • income effect: the change in consumption that results when a price increase causes real income to decline • demand schedule: a table that lists the quantity of a good a person will buy at various prices in a market • market demand schedule: a table that lists the quantity of a good all consumers in a market will buy at various prices • demand curve: a graphic representation of a demand schedule Chapter 4, Section 1 Copyright © Pearson Education, Inc. Slide 4
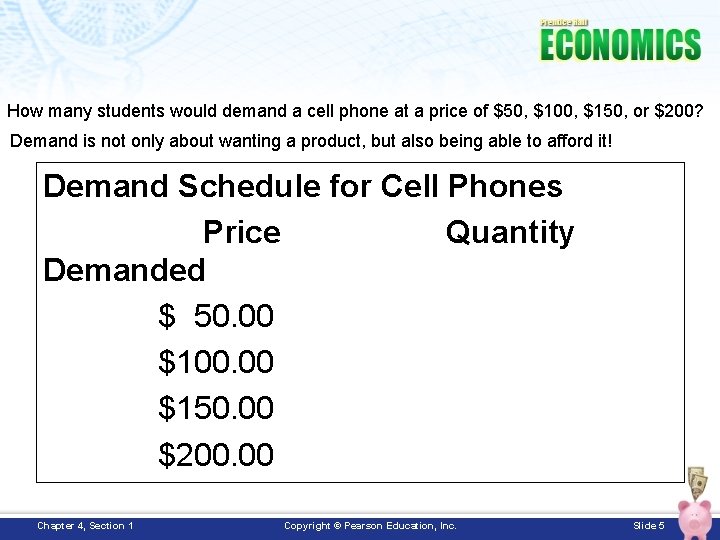
How many students would demand a cell phone at a price of $50, $100, $150, or $200? Demand is not only about wanting a product, but also being able to afford it! Demand Schedule for Cell Phones Price Quantity Demanded $ 50. 00 $100. 00 $150. 00 $200. 00 Chapter 4, Section 1 Copyright © Pearson Education, Inc. Slide 5
NET-FLUNKS http: //www. youtube. com/watch? v=QPn. O-CGOGA 4&feature=related According to the video, what happened to the quantity demanded of Netflix products when the company raised its prices by up to 60 percent? [Quantity demanded decreased by one million subscribers. ] How does this illustrate the law of demand? A higher price reduced the quantity demanded. Chapter 4, Section 1 Copyright © Pearson Education, Inc. Slide 6
Rising Food Prices Sour Families http: //www. youtube. com/watch? v=Bc. CZdnp. VWdo&feature=related When the price of beef increased, a consumer responded by substituting pork because it was relatively less expensive. Assuming that beef and pork are substitutes, what does this say about the relationship between the demand for a good (like pork) and the price of a substitute (such as beef)? Demand for a good (like pork) increases when the price of a substitute (like beef) increases. Consider that beef hamburgers and hamburger buns are complements, or goods that go together. If the demand for beef decreases, what will happen to the demand for hamburger buns? Demand for a good (like hamburger buns) will decrease when the price of its complement (like hamburgers) increases. The video mentioned the price of ice cream. Suppose that this price is expected to increase in the future. What will happen to the demand for ice cream in the present? Demand for ice-cream will increase in the present, because people would rather pay lower prices in the present than higher prices in the future for the same product. Chapter 4, Section 1 Copyright © Pearson Education, Inc. Slide 7
http: //www. reuters. com/video/2012/04/04/demand-for-fuel-efficient-cars-will-outl? video. Id=232884686 The video reported that consumer preferences had shifted towards fuel-efficient vehicles. How did this influence the demand for fuel-efficient cars, such as the Chevrolet Impala? The demand for fuel-efficient cars increased. According to the video, the number of GM car buyers included more European consumers. How does this increase in the number of buyers affect the demand for GM cars? The demand for GM cars increases. Chapter 4, Section 1 Copyright © Pearson Education, Inc. Slide 8
INCOME EFFECT • http: //www. youtube. com/watch? v=w. Yu. Awm-5 -Bk Based on the lesson from the video, would frozen vegetables be considered a normal or inferior good? Encourage students to explain their responses. Frozen vegetables are inferior goods. As income increases, the demand for frozen vegetables decreases. In the video, an increase in income caused consumers to buy fewer of the least expensive cars. Instead, consumers chose to buy more expensive cars, because they could now afford them. Likewise, consumers would buy fewer frozen vegetables. Instead, they would buy more expensive fresh vegetables, because they can now afford them. The video reported that laptops are normal goods. Are other electronics, like music players, cell phones, and televisions also normal goods? Explain your responses. Music players, cell phones, and televisions are normal goods. There is a positive relationship between their demands and income. As income increases, the demand for these goods increase. As income decreases, the demand for these goods also decrease. Chapter 4, Section 1 Copyright © Pearson Education, Inc. Slide 9
Shifts of the demand curve as demonstrated in the video. Shifting the demand curve to the right shows an increase in demand. This shift indicates that quantity demanded is higher at each price level. In the video, an increase in income caused the demand curve to shift to the right for normal goods. Shifting the demand curve to the left shows a decrease in demand. This shift means that quantity demanded is lower at each price level. In the video, an increase in income caused the demand curve to shift to the left for inferior goods. Consider how future expectations of income affect demand. For example, if you expect your incomes to increase in the future, how will this affect your demand for most goods and services in the present? Consumer demand in the present will increase with future expectations of higher incomes. Consumers now view themselves as possessing more wealth, because they expect to earn more income. Chapter 4, Section 1 Copyright © Pearson Education, Inc. Slide 10
• If your expect your future incomes to decrease, how will this affect your demand for most goods and services in the present? Consumer demand in the present will decrease with future expectations of lower incomes. Consumers will decrease current spending to save more money for the future when they have less income Finally, demand curves represent the personal value that consumers subjectively place on items relative to their unit cost or price. For example, someone like Mark Zuckerberg may be able to afford a $3, 000 cell phone. He just may not want to purchase it given the alternatives. For example, he could use the $3 K to invest in a new Facebook app, donate it to charity, save it, or just sit on it. However, the opportunity cost of purchasing a phone decreases, as the price of the phone decreases. This makes purchasing the phone more attractive to Mark and other potential consumers. So, quantity demanded increases, as price falls. Chapter 4, Section 1 Copyright © Pearson Education, Inc. Slide 11
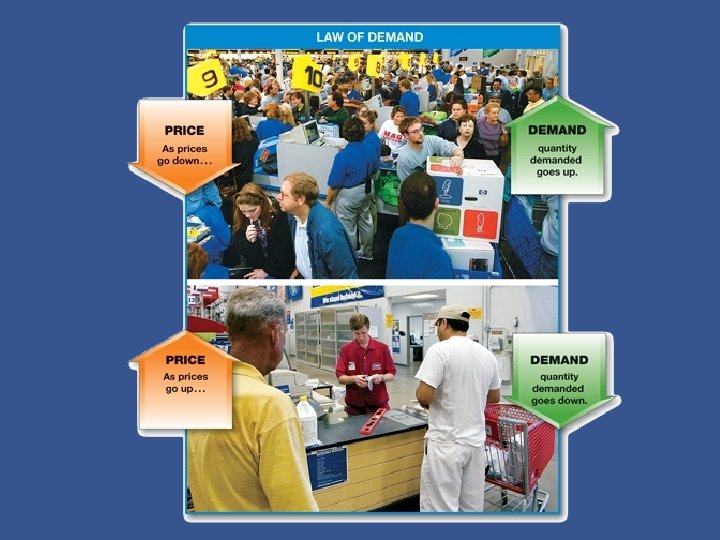
Introduction • How does the law of demand affect the quantity demanded? – Price changes always affect the quantity demanded because people buy less of a good when the price goes up. – By analyzing demand schedules and demand curves, you can see how consumers react to changes in price. Chapter 4, Section 1 Copyright © Pearson Education, Inc. Slide 12
Demand • Demand is the desire to own something and the ability to pay for it. – The law of demand states that when a good’s price is lower, consumers will buy more of it. When the price is higher, consumers will buy less of it. • The law of demand is the result of the substitution effect and the income effect --two ways that a consumer can change his or her spending patterns. Together, they explain why an increase in price decreases the amount consumers purchase. Chapter 4, Section 1 Copyright © Pearson Education, Inc. Slide 13
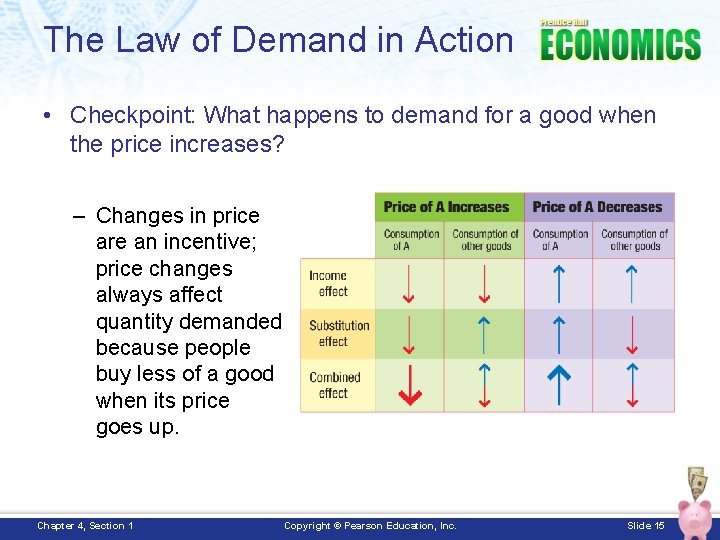
The Law of Demand in Action • Checkpoint: What happens to demand for a good when the price increases? – Changes in price are an incentive; price changes always affect quantity demanded because people buy less of a good when its price goes up. Chapter 4, Section 1 Copyright © Pearson Education, Inc. Slide 15
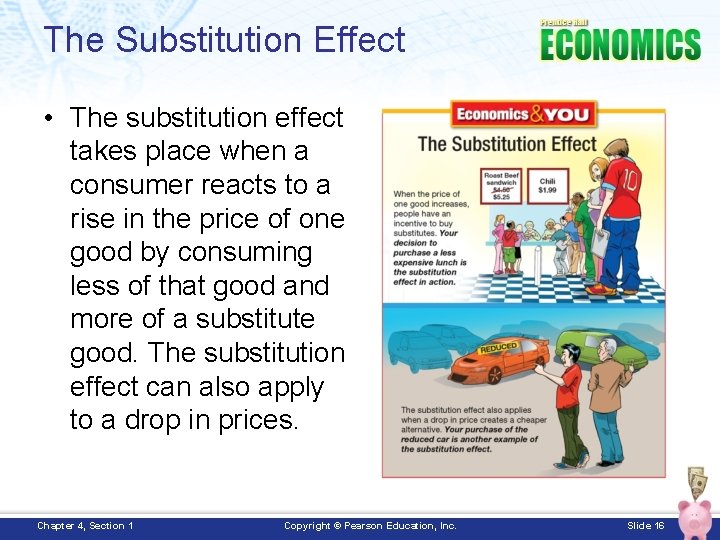
The Substitution Effect • The substitution effect takes place when a consumer reacts to a rise in the price of one good by consuming less of that good and more of a substitute good. The substitution effect can also apply to a drop in prices. Chapter 4, Section 1 Copyright © Pearson Education, Inc. Slide 16
The Income Effect • The income effect is the change in consumption that results when a price increase causes real income to decline. – Economists measure consumption in the amount of a good that is bought, not the amount of money spent on it. – The income effect also operates when the price is lowered. If the price of something drops, you feel wealthier. If you buy more of a good as a result of a lower price, that’s the income effect at work. Chapter 4, Section 1 Copyright © Pearson Education, Inc. Slide 17
Demand Schedules • The law of demand explains how the price of an item affects the quantity demanded of that item. • To have demand for a good, you must be willing and able to buy it at a specified price. • A demand schedule is a table that lists the quantity of a good that a person will purchase at various prices in the market. Chapter 4, Section 1 Copyright © Pearson Education, Inc. Slide 18
Market Demand Schedules • A market demand schedule shows the quantities demanded at various prices by all consumers in the market. – Market demand schedules are used to predict the total sales of a commodity at several different prices. – Market demand schedules exhibit the law of demand: at higher prices the quantity demanded is lower. Chapter 4, Section 1 Copyright © Pearson Education, Inc. Slide 19
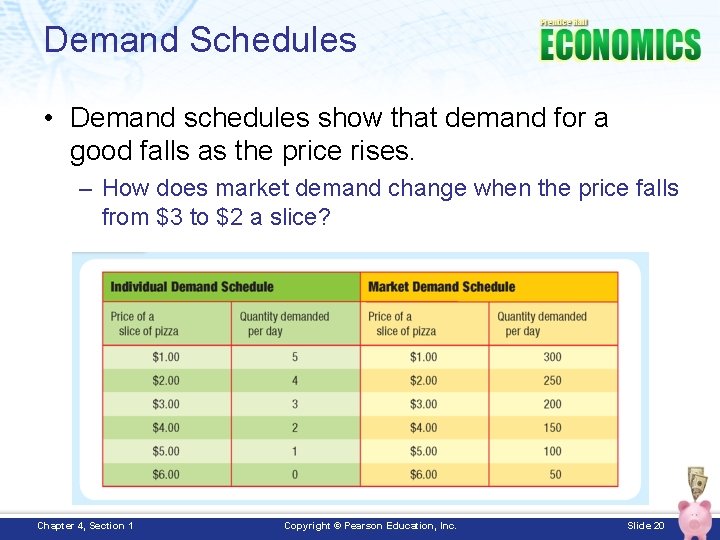
Demand Schedules • Demand schedules show that demand for a good falls as the price rises. – How does market demand change when the price falls from $3 to $2 a slice? Chapter 4, Section 1 Copyright © Pearson Education, Inc. Slide 20
The Demand Graph • A demand curve is a graphic representation of a demand schedule. – The vertical axis is always labeled with the lowest possible prices at the bottom and the highest prices at the top. – The horizontal axis should be labeled with the lowest possible quantity demanded at the left and the highest possible quantity demanded on the right. Chapter 4, Section 1 Copyright © Pearson Education, Inc. Slide 21
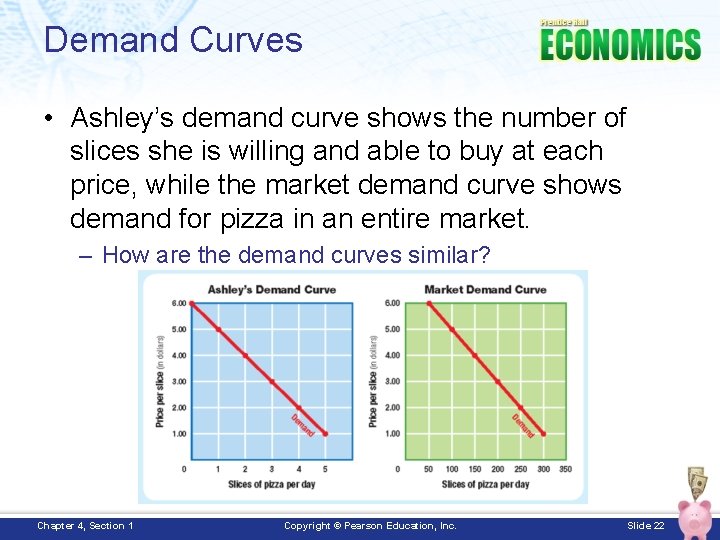
Demand Curves • Ashley’s demand curve shows the number of slices she is willing and able to buy at each price, while the market demand curve shows demand for pizza in an entire market. – How are the demand curves similar? Chapter 4, Section 1 Copyright © Pearson Education, Inc. Slide 22
Market Demand Curves • All demand schedules and demand curves reflect the law of demand. • Market demand curves are only accurate for one very specific set of market conditions. They cannot predict changing market conditions. Chapter 4, Section 1 Copyright © Pearson Education, Inc. Slide 23
Review • Now that you have learned how the law of demand affects the quantity demanded, go back and answer the Chapter Essential Question. – How do we decide what to buy? Chapter 4, Section 1 Copyright © Pearson Education, Inc. Slide 24
- Slides: 24