Chapter 4 Appendix Asset Pricing Models Portfolio Theory


 – Where – Rp =")


 – 2/3 rds of")

 State 2 (Drought) Probability 0. 7 0.")
 State 2 (Drought) Probability 0. 7 0.")


 Correlations")


 Risk The risk associated with factors peculiar to a particular firm.")


 and (3), investors can select assets to add to their")


 there is a portfolio that generates the highest")


-Rf = 12% - 3%; and")


 Group II (20 stocks) Systematic Risk")


- Slides: 49
Chapter 4 Appendix: Asset Pricing Models
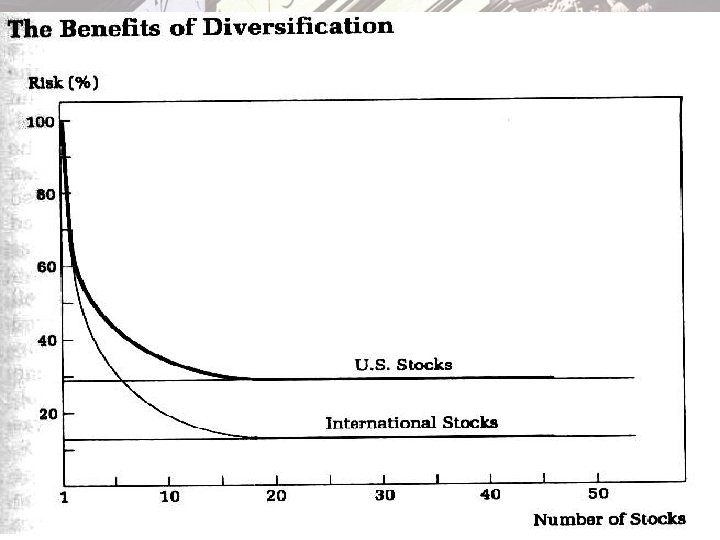
Portfolio Theory Portfolio theory begins with the premise that all investors are risk averse— they want high returns and guaranteed outcomes. Diversification: The essence of portfolio theory is that portfolios of risky stocks can be put together in a manner such that the entire portfolio is less risky than any of the individual stocks. 4 -2
Key Lesson from Portfolio Theory The marginal contribution of an asset to the riskiness of a portfolio does not depend upon the riskiness of the asset. Rather it depends on the covariance of the asset with the portfolio— The systematic risk of an asset cannot be eliminated by holding the asset as part of a diversified portfolio. 4 -3
Capital Market Theory extends portfolio theory and attempts to describe the way in which the equilibrium market price or expected return of an individual asset is related to the risk of the asset. 4 -4
Portfolio Return • Expected Return for a portfolio (1) – Where – Rp = the return on the portfolio of n assets – Ri = the return on asset i – xi = the proportion of the portfolio held in asset I (2) 4 -5
Expected Portfolio Risk & Return Portfolio Risk-- standard deviation of portfolio return can be written as (3) The contribution of asset i to the risk of the portfolio is 4 -6
Portfolio Risk • The proportionate contribution of asset i to the portfolio risk is and the ratio tells us how sensitive an asset’s return is to movements in the portfolio’s return. • The marginal contribution to the risk of a portfolio depends not on the risk of the asset in isolation, but on the sensitivity of that asset’s return to changes in the value of the portfolio. 4 -7
Distribution of Monthly S&P 500 Returns Jan 1926 -May 2001 4 -8
Defining Risk • For Symmetric Distributions (like the S&P 500) – 2/3 rds of all values lie within 1 standard deviation of the mean (expected return) – 95% of all values lie within 2 standard deviations of the mean – A standard deviation is the square root of the variance, our measure of dispersion: 4 -9
Relative Risk and Returns 4 -10
Reducing Risk: Quiz State 1 (heavy rain) State 2 (Drought) Probability 0. 7 0. 3 Return. Unbrella Co. 30% -25% Return - Beach Chair Co -15% Re i Variance Std. Dev. Return Portfolio Calculate the expected return, variance, and standard deviation for each asset. Assume an investor holds a portfolio with half of their assets in each asset. Calculate the Expected return on the portfolio. Explain how this portfolio demonstrates the first key lesson from Portfolio Theory. 4 -11
Reducing Risk: Answer State 1 (heavy rain) State 2 (Drought) Probability 0. 7 0. 3 Re i Variance Return. Umbrella Co. 30% -25% 13. 5% 6. 35% 25. 2% Return - Beach Chair Co -15% -6% 1. 89% 13. 75% -5% 3. 75% 0. 33% 5. 73% Return Portfolio 7. 5% Calculate the expected return, variance, and standard deviation for each asset. Assume an investor holds a portfolio with half of their assets in each asset. Calculate the Expected return on the portfolio. Explain how this portfolio demonstrates the first key lesson from Portfolio Theory. Std. Dev. 4 -12
Reducing Risk: Diversification • When there is a negative correlation between returns as in our example, diversification reduces risk. See http: //en. wikipedia. org/wiki/Correlation • Combining assets with a large positive covariance (high correlation between returns of assets) will not produce diversification. • Modern Portfolio Theory tells investors how to combine stocks in their portfolio to give them the least risk possible, consistent with the return they seek. 4 -13
Reducing Risk Correlation Coefficient Effect of Diversification on Risk +1. 0 No Risk Reduction 0. 5 Moderate Risk Reduction 0 -0. 5 -1. 0 Considerable Risk Reduction Most risk can be eliminated All risk can be eliminated 4 -14
US & Developed Foreign Country Stocks
US & Developed Country Correlations
US & Emerging Markets Correlations
US Stock & Bond (30 Tres) Correlations
Beta • If we consider the entire market portfolio, then the co-movement of asset i’s return with the market return is the asset’s beta, (4) An asset’s beta measures the asset’s marginal contribution to the risk of the market portfolio, or Various Beta: Apple, HE Copyright © 2006 Pearson Addison-Wesley. All rights reserved. 4 -20
Risk—Return & Beta • Recognize that the return on asset i consists of a component that moves with the market return and a component that is uncorrelated with the market return (5) An asset with a beta = 1 has the same average variability as the market. And the expected return on asset i depends on the market return and beta. Copyright © 2006 Pearson Addison-Wesley. All rights reserved. 4 -21
Risk—Return & Beta • The variance of asset i’s return can be calculated from equation (5) as Or, since we know that the firm specific error is uncorrelated with the market return E[Rm i]= 0: Copyright © 2006 Pearson Addison-Wesley. All rights reserved. 4 -22
Types of Risk We define the risk for an individual stock by the standard deviation of its return, or the sqare root of Total Risk = Systematic Risk + Non-systematic risk The risk of a well diversified portfolio depends only on systematic risk. This is because events that affect individual firms tend to cancel out over time.
Firm Specific (Non-systematic) Risk The risk associated with factors peculiar to a particular firm. • For example, Airline stocks have been badly affected by terrorism, weather, and energy costs. Can be diversified away—when one firm has a setback, another may have a breakthrough. • For example, security companies may see increased profits due to the threat of terrorism, and oil companies have had record profits.
Market Risk • Market Risk: The risk associated with the comovements of the entire market. • Market risk cannot be eliminated by diversification. Holding the entire market does not help if all firms are falling together! Market risk is also called systematic risk.
Diversification Again
CAPM The Capital Asset Pricing Model was developed by Bill Sharpe, John Lintner, and Jan Mossing simultaneously and independently in 1965 based on the earlier work of Harry Markowitz and Sharpe received the Nobel Prize in Economics in 1990.
CAPM Using equations (2) and (3), investors can select assets to add to their portfolio to create any standard deviation and expected return combination they choose. (2) (3)
CAPM Consider a portfolio of n=5 assets, 1/5 of your wealth in each. Then the portfolio return is Or, using equation (5) for the return on an individual asset: (5)
CAPM If the portfolio is well diversified so that the firm specific risks are uncorrelated with each other (and because systematic and non-systematic risk are uncorrelated) the portfolio risk depends only on systematic risk 0 as n gets large
CAPM For each standard deviation, (risk) there is a portfolio that generates the highest expected return. All such portfolios makes up the efficient portfolio frontier. These are the standard deviation-expected return combinations risk-averse investors would always prefer. http: //www. moneychimp. com/articles/risk/efficient_frontier. htm
CAPM • Assumes that investors can borrow and lend as much as they want at a risk-free rate of interest, Rf. By lending at the risk- free rate, the investor earns an expected return of Rf and his investment has a zero standard deviation because it is risk-free.
CAPM • Suppose an investor decides to put half of her total wealth in the risk-free loan and the other half in the market portfolio on the efficient portfolio frontier. What is the investors expected risk/return for this portfolio? use
CAPM • If an investor borrows the total amount of her wealth at the risk-free rate Rf and invests the proceeds plus her wealth (that is, twice her wealth) in portfolio M, What is the investors expected risk/return for this portfolio?
CAPM • By choosing different amounts of borrowing and lending, an investor can form a portfolio with a risk–return combination that lies anywhere on the Opportunity Locus.
CAPM • Assume that all investors have same assessment of risk and return. portfolio M is the same for all investors portfolio M is the market portfolio • The slope of the opportunity locus gives us the trade-off between expected returns and increased risk for the investor. (Sharpe Ratio)
CAPM • If an investor increases the riskiness of his portfolio by m then he can earn an additional expected return of E(Rm)-Rf. • E(Rm)-Rf is referred to as the market price of risk (or an equity (or risk) premium)
Quiz • If the market risk premium is E(Rm)-Rf = 12% - 3%; and a stock’s beta tells us how much it contributes to the risk of the market. • What is your required rate of return for a stock with a beta of 1, . 5, and 1. 5?
CAPM • Recall that beta tells us the marginal contribution of an asset to a portfolio’s risk • The amount an asset’s expected return exceeds the risk-free rate should equal the market price of risk times the asset’s beta (7)
Security Market Line Consider security S which is below the SML. A portfolio consisting of. 5 in tbills and. 5 in the market would have a =. 5 but a higher expected return than security S. So no body would buy S, lowering its P and raising its expected Return.
Security Mkt Line If the beta for Google is 1. 2, the risk free rate is 5%, and the return on the market portfolio is 10% (Wilshire 5000 TMW), what return must Google provide to compensate investors for the risk? 5% + 1. 2*(10% - 5%) = 11%
Using the CAPM Suppose you are considering buying shares in Target- a retail store. You study the company and decide that the future return on the company will be 14% = Dt+1 /Pt + g. Should you buy the stock? Compute the required return from the CAPM assuming a beta of 1. 3: R = 3% + 1. 3*(13% - 3%) = 16% Because the required return from the CAPM (to compensate for measured risk) is 16% and your expected return is 14%, you should not buy the stock.
Portfolio Building If the investor holds a portfolio with a Beta of 1, they should earn the market return. • To increase return, the investor needs to take on additional risk. • To increase risk, either buy high beta stocks, or borrow to buy the market. • To lower risk, mix the Risk Free and Market Portfolios. Notice that the slope of the SML is the risk premium (Rm. Rf). If attitudes towards risk change, the slope of the SML will change. Increasing risk aversion will make the SML steeper, requiring a greater return, Ri for the same Beta.
Portfolio Building Desired Beta Composition of Portfolio Expected Return from Portfolio 0 $1 in risk free asset 10% . 5 $. 50 in risk-free asset $. 50 in market portfolio 1/2(0. 10) + 1/2(0. 15) =. 125 = 12. 5% 1 $1 in market portfolio 15% 1. 5 $1. 50 in market portfolio 1. 5(0. 15) -. 5(0. 10) = borrowing $. 50 at an assumed 0. 175 = 17. 5% rate of 10% Assuming expected market return is 15% and risk-free rate is 10%
Only Market Risk Matters Group I (20 stocks) Group II (20 stocks) Systematic Risk (B) = 1 for each stock Specific risk is high for each security Specific risk is low for each security Total risk is high for each security Total risk is low for each security Before CAPM, it was believed that the return on each security varied with the instability of that security’s particular return. Then group I should have a higher return than group II. The CAPM says they should both have the same return.
Is Beta Bettah? • Is it true that high-beta portfolios will provide larger long-term returns than lower-beta ones? • It appears that the relationship between beta and returns is relatively flat.
Is Beta Bettah?
Is Beta Bettah?
Is Beta Bettah? • Beta measures the relative volatility of an asset and does capture some of what we call risk. • Measuring Beta relative to the S&P 500 results in inaccurate measurements of true risk. We need a “total asset index”! Including human capital. • Using improved measures of “the market”, the CAPM does much bettah. • Also need to use other measures of systematic risk as in multifactor models