Chapter 4 ActivityBased costing ActivityBased Costing ABC first

Chapter 4 Activity-Based costing

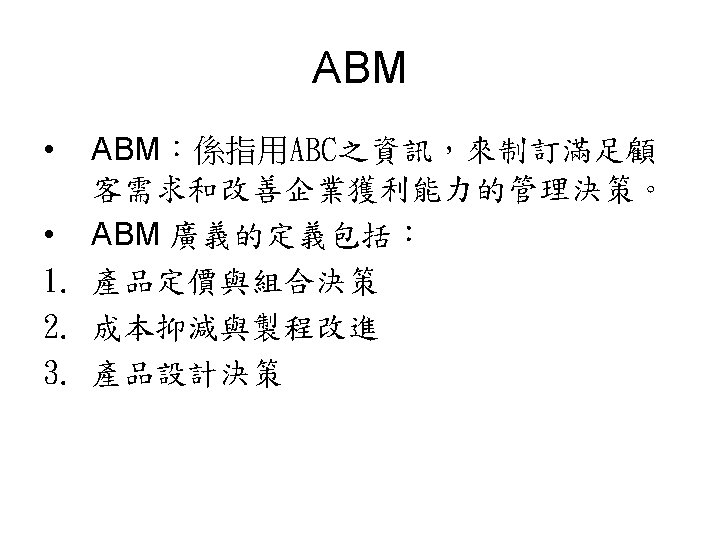
Activity-Based Costing ABC first assigns costs to activities and then to goods and services based on how much each good or service uses the activities. Note that ABC is used to establish product costs primarily for decision-making purposes, not for inventory valuation for external reporting.

4 Steps in the ABC Process 4 Steps Identify and classify the activities related to the company’s products or services. Estimate the costs associated with each activity. Calculate a cost-driver rate for each activity. Assign activity costs to products using the cost-driver rate.

Step 1: Identify and Classify Activities UNIT-LEVEL ACTIVITES The work that transforms resources into individual products and services BATCH-LEVEL ACTIVITES Manufacturing or service technology that affect multiple units of activity equally and simultaneously PRODUCT - LEVEL ACTIVITES Support specific products or service lines CUSTOMER- LEVEL ACTIVITES Performed to meet the needs of specific customers FACILITY-LEVEL ACTIVITIES Support all of the organizations processes

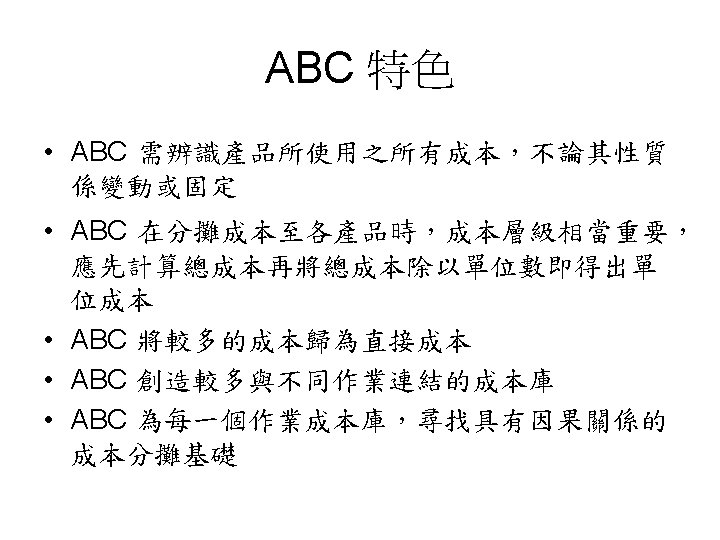
Step 2: Estimate the Cost of Activities When estimating the cost of an activity, only the costs associated with the product should be used (practical capacity). The cost of “unused capacity” should not be applied to products. EXAMPLE Suppose we rent a 1, 000 square foot warehouse for $1, 000 per month. Only 800 sq. ft. are used to store Product A. The rest of the warehouse is “unused”. How much rent cost should be allocated to Product A?

Step 2: Estimate the Cost of Activities 80%, or $800 should be assigned to Product A 20%, or $200 should be assigned to “unused capacity”

Step 3: Compute the Cost. Driver Rates Two pieces of information are required to compute the cost-driver rate: • Activity Cost • Activity Volume EXAMPLE #1 XCo has The 4 proper employees activity in in itsthis Quality case. Control is the #Dept. of units Salaries produced. and costs for the department. The total cost-driver $360, 000 per rateyear. would. XCo be: produces 500, 000 units of product $360, 000 a year. ÷ 500, 000 What units is the=appropriate $. 72 per unit activity, # of employees or units of product? What is the cost-driver rate?

Step 4: Assign Activity Costs to Products 1. Identify all the activities related to a given product or service. 2. Determine how many units of each activity are used per unit of product. 3. Assign costs to products using the costdriver rates for each activity

Step 4: Assign Activity Costs to Products Example: Yazz, Inc. produces 130, 000 units of Product A and 400, 000 units for Product B. Using the following cost information, how much overhead should be allocated to Product A?

Step 4: Assign Activity Costs to Products

Exh. 4. 7 Product Profitability Companies will often look at the profitability for individual products or customers. Information required for each product or customer includes: Revenue, costs that can be traced, costs that can not be traced.

Customer Profitability • Customer costing: Analyze the costs of activities to serve specific customers. • Customer profitability analysis: Identifying the costs and benefits of serving specific customers to improve an organization’s overall profitability.

Why Companies Use ABC costing provides a more specific cost information that help management in: • Cost reduction • Product pricing • Budgeting and performance measurement.

Indirect cost pool Total Indirect Costs Allocation Base Direct Labor hr Indirect cost Cost object Direct Cost Direct cost DM DL Traditional approach

Indirect cost pool Cost pool #1 Cost pool #2 Cost pool #3 Cost pool #4 Allocation Base Activity #1 Activity #2 Activity #3 Activity #4 Indirect cost Cost object Direct Cost Direct cost DM DL ABC
 Evaluates the costs and values of process activities. . . Activity-Based")
Activity-Based Management (ABM) Evaluates the costs and values of process activities. . . Activity-Based Costing + . . . To identify opportunities to improve efficiency. Valued-Added Analysis = Process Improvements, Customer Value, & Reduced Costs

Activity-Based Management 4 Basic Steps Identify & classify the activities related to the company’s products or services. Estimate the costs associated with each activity. Calculate a cost-driver rate for each activity. Assign activity costs to products using the costdriver rate. ABM adds: Identification of value-added and non-value-added activities Identifies the customer perceived value of each activity Identifies opportunities to enhance value-added activities and reduce or eliminate non-value-added activities ?

Combining ABC And Target Costing Megaburger Promotional Toys Target Cost = market price less return on sale

ABC-Target Costing Analysis By comparing the target cost to the currently feasible cost, we can determine the amount that cost needs to be reduced.

The Importance Of Customer Value Activities Create outcomes and consume resources VALUE-ADDED ACTIVITIES enhance the value of products and services in the eyes of the customer while meeting the goals of the organization NON-VALUE-ADDED ACTIVITIES do not contribute to customer perceived value

Most Likely Sources of Non. Value-Added Activities

Identifying Value-Added Activities The test for value added activities “Would an external customer encourage the organization to do more of the activity? ” YES NO “Would the organization be more likely to reach its goal by performing that activity? ” If the answer is “no” to is “yes” to both or either both it is non-value-added. YES NO

Tasks Required by Activity. Based Management Twin objectives of ABM Identify non-valueadded Identify value-added activities to be enhanced eliminated or reduced Redesign processes to eliminate wasteful spending on non-value-added activities

Identifying Opportunities For Process Improvement Ask “Why? ” for each step in the process. Why do employees need to trim excess plastic from molded products? Why#1: Appearance and product function requires removal of the excess Why#2: Under high-injection pressure, plastic leaks from the edges of the mold Why#3: High pressure is required to mold the products properly Why#4: The design of the molds permits leakage Why#5: The molds are based on old designs SOLUTION: Rework or replace old molds with improved molds to eliminate the need for trimming and recycling.

Identifying Opportunities For Process Improvement Ask “Why? ” for each step in the process. Why are we spending so much time on non-value-added record keeping and the correction of recording errors? SOLUTION: Install a bar-coding system to mark and track all orders electronically A bar-coding system creates a unique bar code for each order and allows the company to mark and track all orders electronically

Identifying Opportunities For Process Improvement After process improvements, total elapsed time has been reduced to 82. 2 minutes. If we assume a cost of $10 per hour, what is the cost savings?

Identifying Opportunities For Process Improvement Time Saved: 286 min. - 82. 2 min. 203. 8 min. ÷ 60 min/hr 3. 397 hrs. Cost Savings: 3. 397 hrs. × $10/hr. $33. 97

Capacity utilization • Resources supplied: Capacity that the organization makes available for use, their cost is measured by totaling the cost of all resources provided, whether used or not. • Resources used: Resources actually used by the productive purposes. • Unused capacity: the difference between the resources supplied and the resources used.
- Slides: 30