Chapter 3 The Biosphere Interest Grabber Section 3

Chapter 3 The Biosphere

Interest Grabber Section 3 -1 Levels Within Levels • An ecosystem is a collection of all the organisms that live in a particular place, together with their nonliving, or physical, environment. Within an ecosystem, there are several levels of organization. Your school and its grounds are similar to an ecosystem. Go to Section:

Section 3 -1 Interest Grabber continued • 1. What living things are found in and around your school? • 2. What nonliving things are found in your school? • 3. Into what large groups are the students in your school divided? • 4. Into what smaller groups are these large groups divided? • 5. Are these groups ever divided into even smaller groups? If so, what are these groups? Go to Section:

Section Outline Section 3 -1 • Go to Section: 3– 1 What Is Ecology? A. Interactions and Interdependence B. Levels of Organization C. Ecological Methods 1. Observing 2. Experimenting 3. Modeling

I. What is Ecology? • • Ecology A. Interactions and Interdependence _________-scientific study of interactions among organisms and between organisms and their environment or surroundings. _____came up with term ecology based on house and economy. The largest unit is the ___________ which contains the combined portions of the planet in which all of life exists, inc. water and atmosphere. Web of interactions in biosphere as organisms and environment , which are interdependent Haeckel Biosphere
________level studies interactions between specific organism and surroundings")
B. Levels of Organization species – 1)________level studies interactions between specific organism and surroundings 2)individuals belong to the same species and live in same area. population – 3)________-groups of different populations living in the same area – 4)_________-collection of all the organisms living in particular place+ nonliving parts – 5)________-group of ecosystems that have the same climate and similar dominant communities ecosystem Biome

Figure 3 -2 Ecological Levels of Organization Section 3 -1

C. Ecological Methods • Observing-example What species live here? how many? . . . • Experimenting– An ____________ may test a hypothesis in a lab – field studies in natural ecosystems • Modeling may be done because phenomena may occur over a long time/may use mathematical formulas Artificial environment

Compare/Contrast Table Section 3 -1 Ecological Methods Observation Experimental plots, field sites, laboratory Tapes, compass, Measuring Tools Tapes, compass, Global Positioning System, thermometer, sensors Magnifying Tools Binoculars, microscope, telescope Sites Written Record Go to Section: Field site Model Building Many sites for data collecting Aerial views, Global Positioning System, weather balloons Satellite images Notes, automated data Automated data storage Chemical Testing Test kits Computer/ Calculators Mathematical analysis and graphics, statistics, simulations Mathematical analysis and graphics, statistics Large database, multiple sensors

Interest Grabber Section 3 -2 • Energy flows in one direction through an ecosystem, from the sun or inorganic Pass It Along compounds to producers (organisms that can make their own food) through various levels to consumers (organisms that rely on other organisms for food). Your body gets the energy and materials it needs for growth and repair from the foods you eat. Go to Section:

Interest Grabber continued • 1. Make a list of five foods that you like to eat. Section 3 -2 Indicate whether the food • comes from a plant (producer) or an animal (consumer). • 2. Like many birds, chickens eat grains, which are seeds. Where do seeds • come from? • 3. Meat comes from beef cattle. What do cattle eat? Go to Section: • 4. Construct a diagram showing how one of your favorite foods obtains its energy. Include as many levels as you can.

• 1. Make a list of five foods that you like to eat. Indicate whether the food Sec • comes from a plant (producer) or an animal (consumer). • 2. Like many birds, chickens eat grains, which are seeds. Where do seeds • come from? • 3. Meat comes from beef cattle. What do cattle eat? • 4. Construct a diagram showing how one of your favorite foods obtains its energy. Include as many levels as you can. Go to Section:

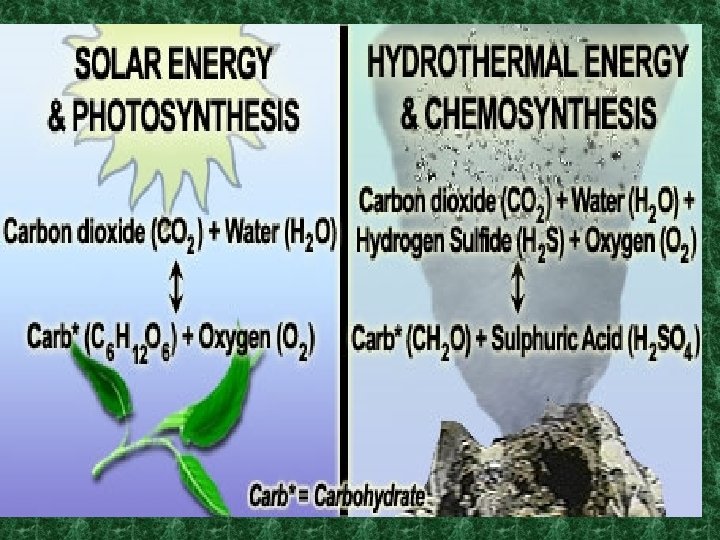
II. Energy Flow • A. – – – Producers ______-main source of energy for all life on earth Only <_____% of the sunlight is used by living things , yet this produces much energy Some organisms use the energy stored in organic compounds-eg. In _______and undersea vents Hot springs sun 1%
 energy directly from the sun")
Energy Flow cont’d – Only __________ can take (derive) energy directly from the sun or inorganic compounds…. . Theses are called __________, which use the energy from the environment to fuel the assembly of simple inorganic compounds into complex organic molecules…. finally forming tissue – Because they can make their own food, autotrophs are called _________. – Both types of producers---those that get energy from sunlight and those that derive energy from inorganic compounds are essential. To the biosphere. Plants, some algae and certain bacteria autotrophs producers
 Energy from the sun: – • Get energy from")
A. Producers cont’d • 1) Energy from the sun: – • Get energy from ________that converts CO 2 and H 2 O into O 2 and glucose, using light energy…. . responsible for O 2 we breath – On land _______are the main autotrophs under the water, at the upper layers. In tidal flats and salt marshes, photosynthetic bacteria called _____are the main autotrophs plants photosynthesis algae cyanobacteria

Light energy CO 2+ H 20 ------ carbs + O 2

2. Life w/o Light: • • • Rely on chemical bonds of such inorganic molecules as hydrogen sulfide _______is when chemical energy is used to produce carbohydrates ---performed by several type of bacteria In volcanic vents on the deep ocean floor and hot springs chemosynthesis

Consumers-also called __________rely on other organisms for their food supply Types • • • : heterotrophs 1)________eat only plants. eg-cows, caterpillars and deer 2)_______eat animals—eg-snakes and owls 3)_________-eat both plants and animals eg-humans, bears 4)____________eat plant animal remains, and other dead matter called detritus—eg-earthworms and snails herbivores carnivores omnivores detrovites
 ___________ _-break down organic matter---eg. Bacteria and fungi Decomposers")
II. cont’d( beginning w/B-5) ___________ _-break down organic matter---eg. Bacteria and fungi Decomposers

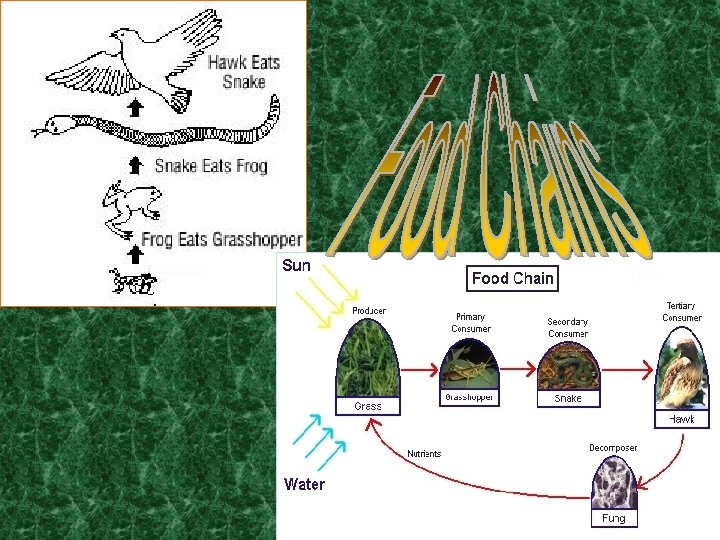
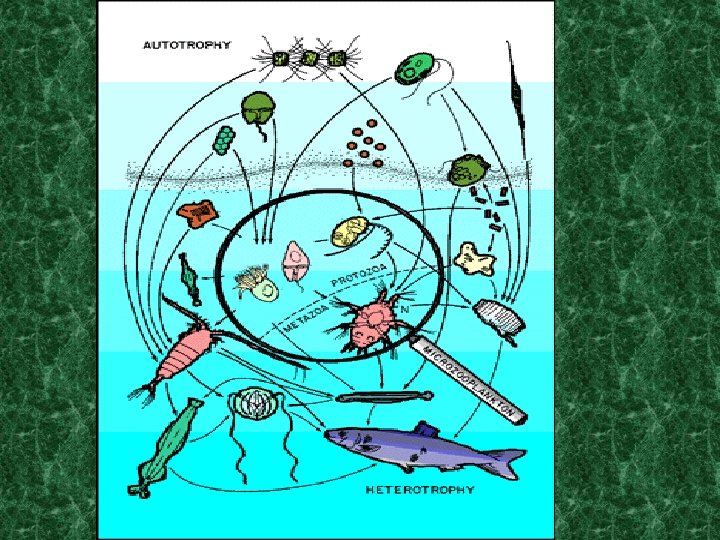
energy • C. Feeding Relationships ______ flows through an ecosystem in one direction, from the sun or inorganic compounds to autotrophs(producers) and then to various heterotrophs(consumers). These relationships create feeding networks: 1. The energy stored by producers can be passed through an ecosystem along a __________-a series of steps in which organisms transfer energy by eating and being eaten…shows one way flow of energy Food chains

zooplankton The animal plankton above is____________, which devour the phytoplankton and are , in turn, eaten by small fish.

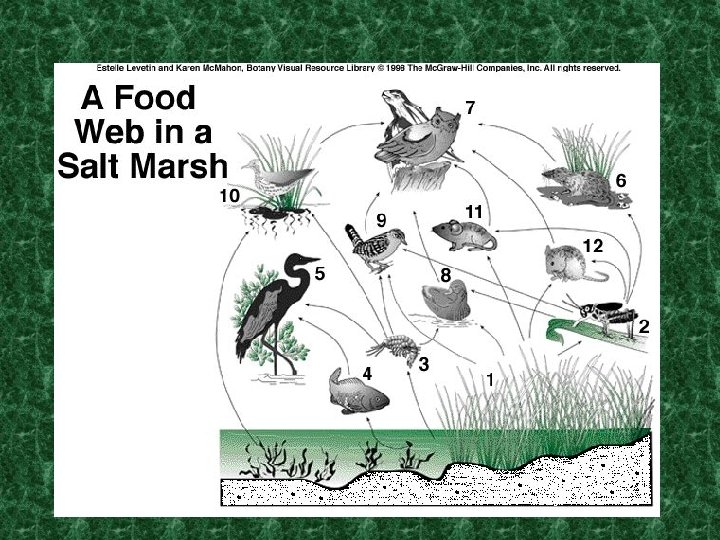
• 2. ____________complex feeding interactions are shown. These show more complex relationships. Producers are either eaten or complete life cycle. Herbivores, omnivores, carivores and producers decompose, turning into detritus, by decomposers and devoured by detritivores and also by consumers. Food webs

• 3. Each step in a food chain or food web is _____________Each consumer depends on the trophic level below for energy. Called a trophic level

4. Ecological Pyramids-shows the relative amount of matter contained w/in each trophic level being a chain or web…There are 3 types: • Energy Pyramid-Only about __% of the energy available in one trophic level is transferred to the next…most is released into environment…. . only about 1% transferred to humans…. the more trophic levels , the ____energy at the top. 10% less

• Biomass Pyramid-represents amount food available @ level – Total amount of living tissue in a trophic level=________ • expressed in g/unit area • Pyramid of Numbers –based on number of individual organisms at each trophic level. biomass

Ecological Pyramids Energy Pyramid Shows the relative amount of Section 3 -2 trophic energy available at each level. Organisms use about 10 percent of this energy for life processes. The rest is lost as heat. Go to Section: Biomass Pyramid Represents the amount of living organic matter at each trophic level. Typically, the greatest biomass is at the base of the pyramid. Pyramid of Numbers Shows the relative number of individual organisms at each trophic level.

III. Cycles of Matter • Matter is cycled within and without an ecosystem • Matter is passed from one organism to another through________ Biochemical cycles

The Water Cycle Section 3 -3 Condensation Precipitation Evaporation Transpiration Runoff Seepage Water gas in EVAPORATION and water enters the air from leaves in TRANSPIRATION Go to Section: Root Uptake

All the chemical substances an organism needs for life is a _______/to build tissues and carry out cell functions Nutrient

4 main types of processes move C through its cycle • Biological processes like Photosynthesis, respiration and decomposition take up and release C and O 2 • Geochemical processes, such as erosion and volcanos release CO 2 into the atmosphere and oceans. • Mixed Biochemical processes-burial and decomposition and conversion into coal and petroleum store underground C. • Human activities like mining , cutting and burning forests and fossil fuels release CO 2 in the air.

Figure 3 -13 The Carbon Cycle Section 3 -3 CO 2 in Atmosphere CO 2 in Ocean Go to Section:

Figure 3 -14 The Nitrogen Cycle N 2 in Atmosphere NH 3 NO 3 and NO 2 - N needed for amino acids and proteins

N-fixing bacteria from roots of legumes convert N gas into ammonia in Nitrogen Fixation, also into nitrates and nitrites. Producers use them to make proteins. This is then usable by the consumers to make their own proteins. Denitrification is when organisms die and decomposers return n to soil as ammonia. Other soil bacteria convert Nitrates into N gas, releasing N into air again

P forms part of DNA and RNA

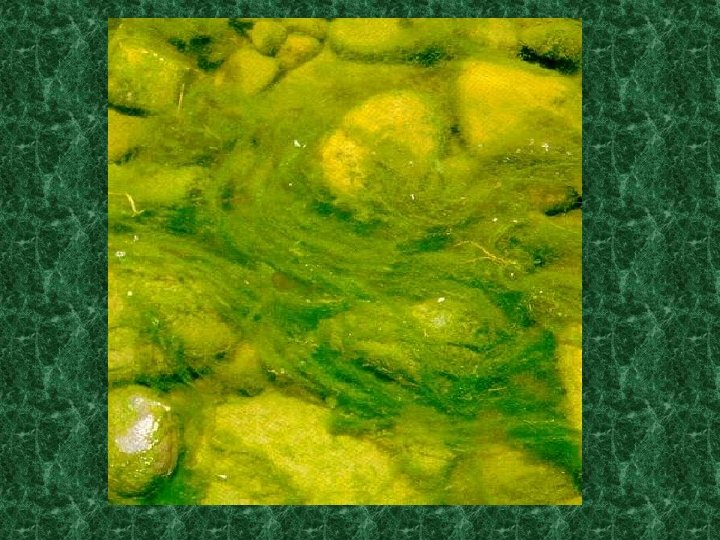
Nutrient Limitation • Primary productivity is _____________. • Available nutrients affect this. • When an ecosystem is limited by a single nutrient it is called a_______. • Algal blooms occur due to the increase in a nutrient. the algae may cover the surface of the water and block the sun Rate @ which organic matter is created by producers Limiting nutrient

Algal Blooms
- Slides: 42