Chapter 3 Structuring System Requirements Process Modeling Process


 n Context data flow diagram (DFD) w Scope")
 n Project dictionary and CASE repository Data flow")


 of the")


")

 L. A join means that exactly the")


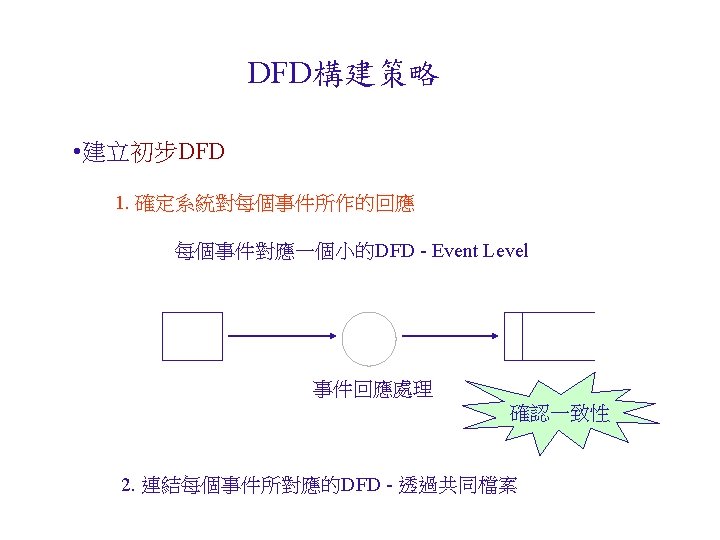
 n n n Notice next Figure. We have the same")


 n n n When every")


 假如 malloc()")


- Slides: 76
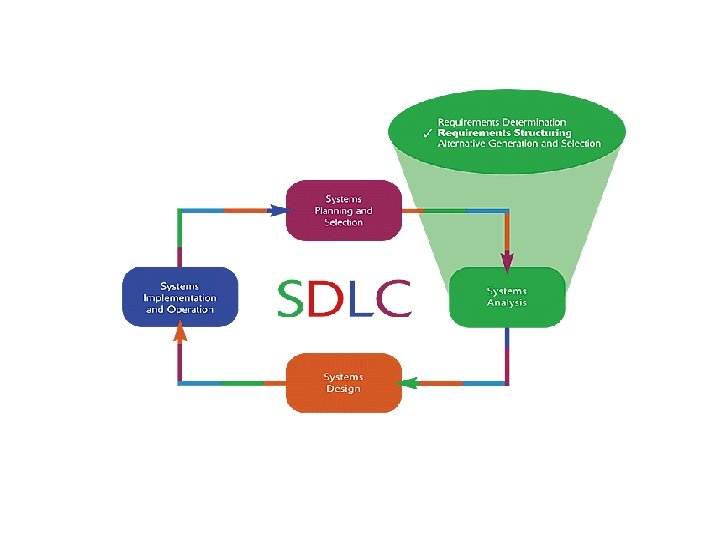
Chapter 3 Structuring System Requirements: Process Modeling
Process Modeling Graphically represent the processes that capture, manipulate, store and distribute data between a system and its environment and among system components Data flow diagrams (DFD) n Graphically illustrate movement of data between external entities and the processes and data stores within a system
Process Modeling a system’s process n n Utilize information gathered during requirements determination Structure of the data is also modeled in addition to the processes Deliverables and Outcomes n Set of coherent, interrelated data flow diagrams
Process Modeling Deliverables and outcomes (continued) n Context data flow diagram (DFD) w Scope of system n DFDs of current system w Enables analysts to understand current system n DFDs of new logical system w Technology independent w Show data flows, structure and functional requirements of new system
Process Modeling Deliverables and outcomes (continued) n Project dictionary and CASE repository Data flow diagramming mechanics n n Four symbols are used Developed by De. Marco and Yourdan
Process Modeling n DFD - Four symbols
Data Flow Diagramming Mechanics Data Flow n n n Depicts data that are in motion and moving as a unit from one place to another in the system. Drawn as an arrow Select a meaningful name to represent the data
Data Flow Diagramming Mechanics Data Store n n Depicts data at rest May represent data in w File folder w Computer-based file w Notebook Drawn as two horizontal parallel lines The name of the store as well as the number are recorded in between lines
Data Flow Diagramming Mechanics Process n n n Depicts work or action performed on data so that they are transformed, stored or distributed Drawn as a circle Number of process as well as name are recorded
Data Flow Diagramming Mechanics Source/Sink n n n Depicts the origin and/or destination of the data Sometimes referred to as an external entity Drawn as a square symbol Name states what the external agent is Because they are external, many characteristics are not of interest to us
Data Flow Diagramming Definitions Context Diagram n A data flow diagram (DFD) of the scope of an organizational system that shows the system boundaries, external entities that interact with the system and the major information flows between the entities and the system Level-O Diagram n A data flow diagrams (DFD) that represents a system’s major processes, data flows and data stores at a higher level
Developing DFDs: An Example Hoosier Burger’s automated food ordering system Context Diagram contains no data stores Next step is to expand the context diagram to show the breakdown of processes
Developing DFDs: An Example Context Diagram
Developing DFDs: An Example Level-O Diagram
Data Flow Diagramming Rules Basic rules that apply to all DFDs n n Inputs to a process are always different than outputs Objects always have a unique name w In order to keep the diagram uncluttered, you can repeat data stores and data flows on a diagram
Data Flow Diagramming Rules Process A. No process can have only outputs (a miracle) B. No process can have only inputs (black hole) C. A process has a verb phrase label Data Store D. Data cannot be moved from one store to another. E. Data cannot move from an outside source to a data store F. Data cannot move directly from a data store to a data sink G. Data store has a noun phrase label
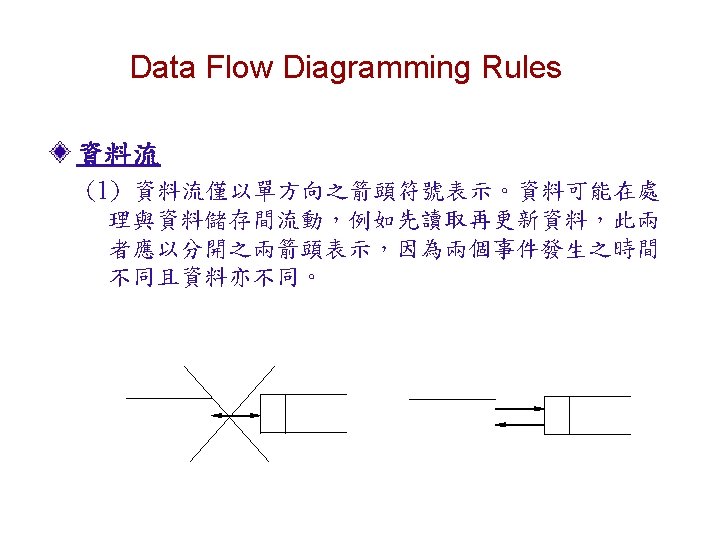
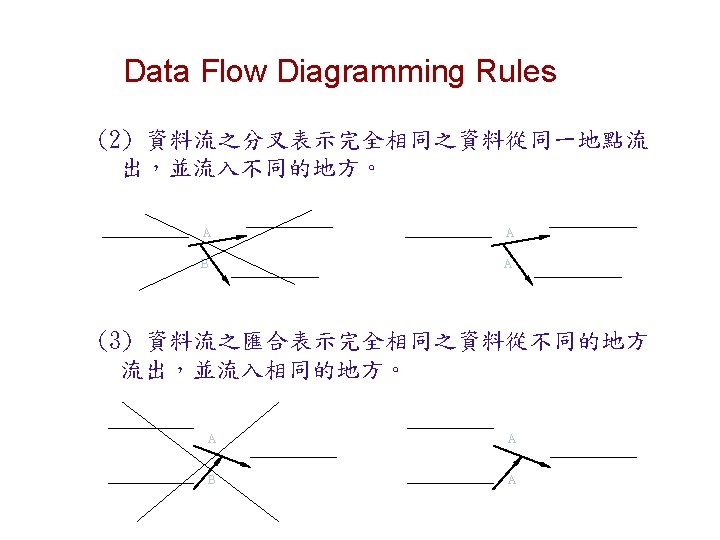
Data Flow Diagramming Rules Source/Sink H. Data cannot move I. directly from a source to a sink A source/sink has a noun phrase label Data Flow J. A data flow has only one direction of flow between symbols. K. A fork means that exactly the same data go from a common location to two or more processes, data stores or sources/sinks
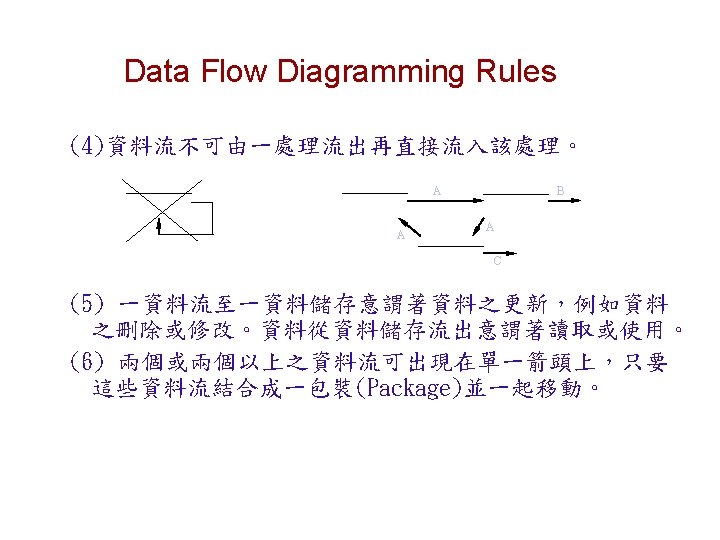
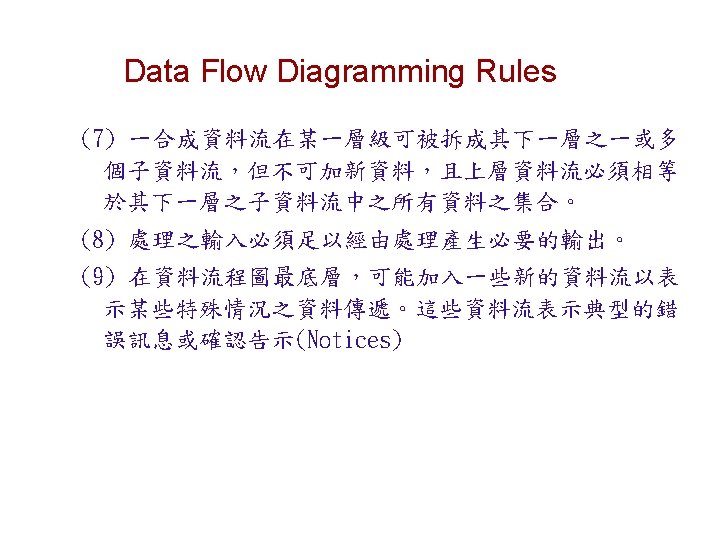
Data Flow Diagramming Rules Data Flow (Continued) L. A join means that exactly the same data come from any M. N. O. P. two or more different processes, data stores or sources/sinks to a common location A data flow cannot go directly back to the same process it leaves A data flow to a data store means update A data flow from a data store means retrieve or use A data flow has a noun phrase label
Decomposition of DFDs Functional decomposition n Act of going from one single system to many component processes Repetitive procedure Lowest level is called a primitive DFD Level-N Diagrams n A DFD that is the result of n nested decompositions of a series of subprocesses from a process on a level-0 diagram
Balancing DFDs When decomposing a DFD, you must conserve inputs to and outputs from a process at the next level of decomposition This is called balancing
Balancing DFDs
Balancing DFDs Example (Continued) n n n Notice next Figure. We have the same inputs and outputs No new inputs or outputs have been introduced We can say that the context diagram and level-0 DFD are balanced
Balancing DFDs
Balancing DFDs An unbalanced example n n Next Figure In context diagram, we have one input to the system, A and one output, B Level 0 diagram has one additional data flow, C These DFDs are not balanced
Unbalancing DFDs
Balancing DFDs We can split a data flow into separate data flows on a lower level diagram (see Next Figure)
Balancing DFDs
Guidelines for Drawing DFDs 1. Completeness n n DFD must include all components necessary for system Each component must be fully described in the project dictionary or CASE repository 2. Consistency n The extent to which information contained on one level of a set of nested DFDs is also included on other levels
Guidelines for Drawing DFDs 3. Timing n n Time is not represented well on DFDs Best to draw DFDs as if the system has never started and will never stop. 4. Iterative Development n Analyst should expect to redraw diagram several times before reaching the closest approximation to the system being modeled
Guidelines for Drawing DFDs 5. Primitive DFDs n n Lowest logical level of decomposition Decision has to be made when to stop decomposition
Guidelines for Drawing DFDs Rules for stopping decomposition n When each process has been reduced to a single decision, calculation or database operation When each data store represents data about a single entity When the system user does not care to see any more detail
Guidelines for Drawing DFDs Rules for stopping decomposition (continued) n n n When every data flow does not need to be split further to show that data are handled in various ways When you believe that you have shown each business form or transaction, on-line display and report as a single data flow When you believe that there is a separate process for each choice on all lowest-level menu options
Using DFDs as Analysis Tools Gap Analysis n The process of discovering discrepancies between two or more sets of data flow diagrams or discrepancies within a single DFD Inefficiencies in a system can often be identified through DFDs
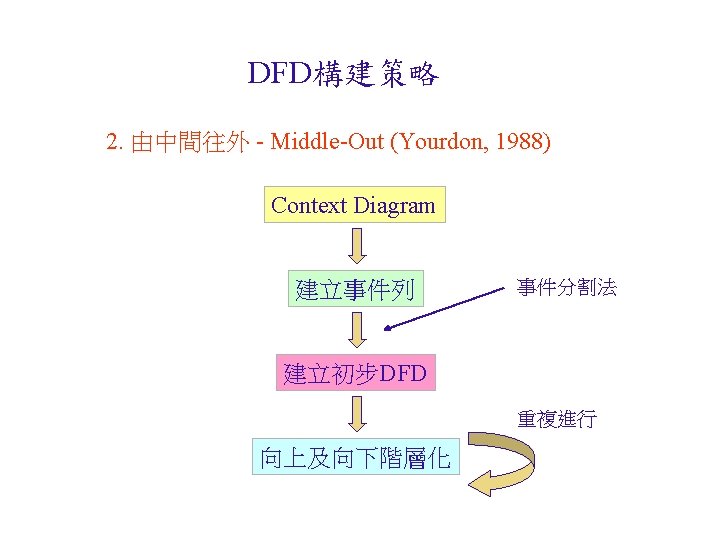
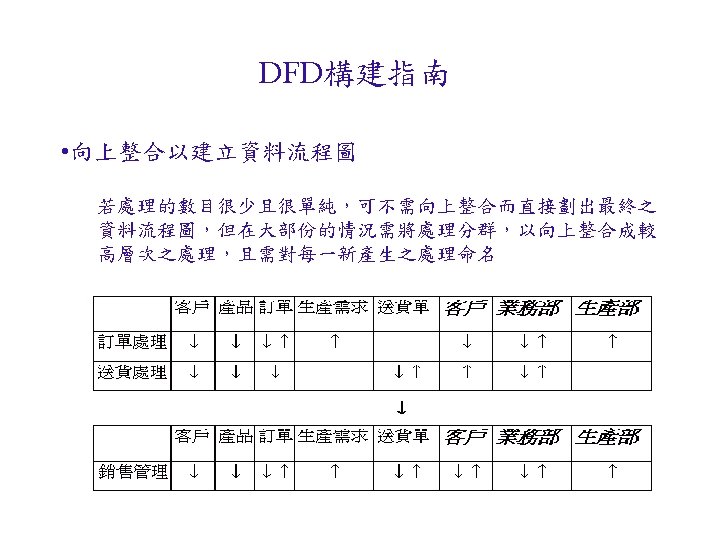
DFD構建策略 1. Top-Down Decomposition Context Diagram 較困難 分割系統主功能 第零階DFD 重複進行 更低階 Decomposition
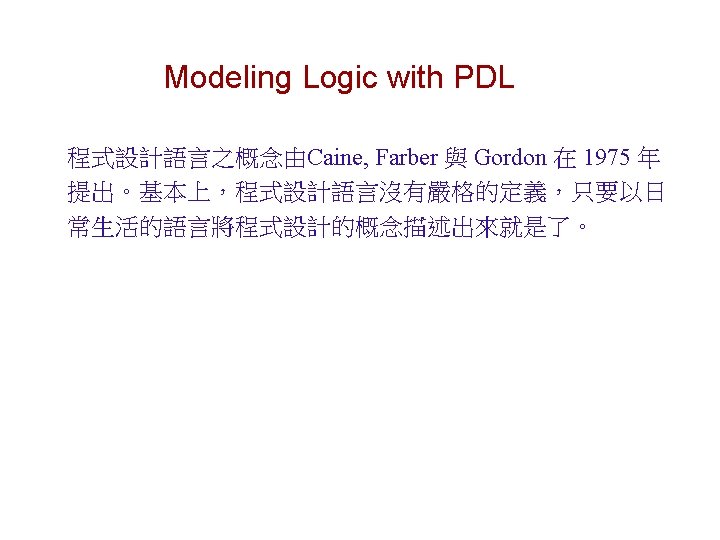
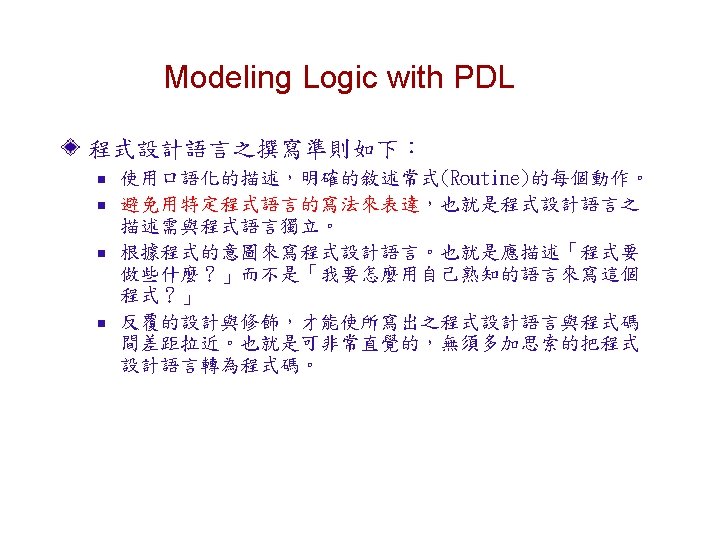
Logic Modeling Data flow diagrams do not show the logic inside the processes Logic modeling involves representing internal structure and functionality of processes depicted on a DFD Three methods n n n Structured English, 程式設計語言(Program Design Language, PDL) Decision Tables Decision Trees
Modeling Logic with Structured English Modified form of English used to specify the logic of information processes Uses a subset of English n n n Action verbs Noun phrases No adjectives or adverbs No specific standards
Modeling Logic with Structured English Similar to programming language n n If conditions Case statements
Modeling Logic with Structured English
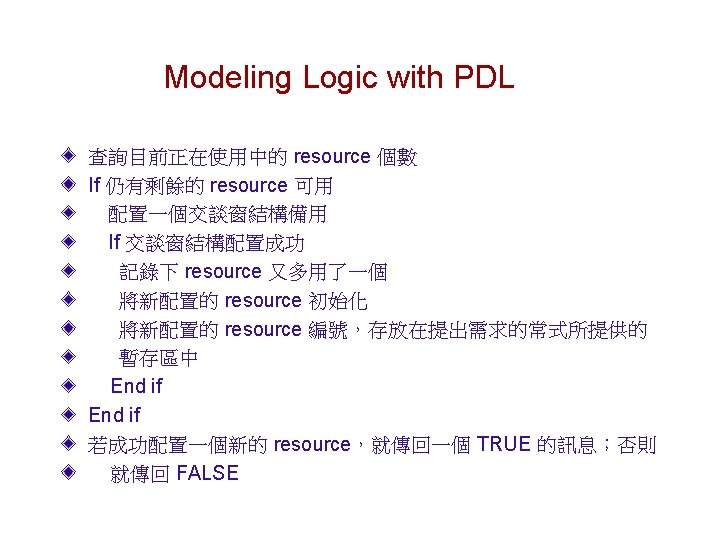
Modeling Logic with PDL 將 resource 的編號加1 用 malloc 函式配置一個 dlg 型別的結構(struct) 假如 malloc() 傳回 NULL 值,就以一個1當成常式的 傳回值 呼叫 OSrsrc_init 來初始化一個作業系統的 resource *h. Rsrc. Ptr = resource 編號 return 0
Modeling Logic with Decision Tables A matrix representation of the logic of a decision Specifies the possible conditions and the resulting actions Best used for complicated decision logic
Modeling Logic with Decision Tables Consists of three parts n Condition stubs w Lists condition relevant to decision n Action stubs w Actions that result for a given set of conditions n Rules w Specify which actions are to be followed for a given set of conditions
Modeling Logic with Decision Tables Indifferent Condition n Condition whose value does not affect which action is taken for two or more rules Standard procedure for creating decision tables n n n Name the condition and values each condition can assume Name all possible actions that can occur List all rules Define the actions for each rule Simplify the table
Complete decision table for payroll system example
Modeling Logic with Decision Trees A graphical representation of a decision situation Decision situation points are connected together by arcs and terminate in ovals Two main components n n Decision points represented by nodes Actions represented by ovals
Modeling Logic with Decision Trees Read from left to right Each node corresponds to a numbered choice on a legend All possible actions are listed on the far right
Decision tree representation of the decision logic
Deciding Among Structured English, Decision Tables and Decision Trees Criteria Structured English Decision Tables Decision Trees Determining Second Best Conditions and Actions Third Best Transforming Best Conditions and Actions into Sequence Third Best Checking Consistency and Completeness Best Third Best