Chapter 3 Soil Sampling And Soil Sensing Soil


 • Soil EC is soil electrical conductivity– a measurement of how")


 Buffer Index p. H 6. 8 p.")


 Buffer Index p. H 6. 8 p.")


- Slides: 59
Chapter 3: Soil Sampling And Soil Sensing
• Soil Sampling – Composite – Zone – Grid • Soil Measurements – Soil Map – Soil EC – Soil Color
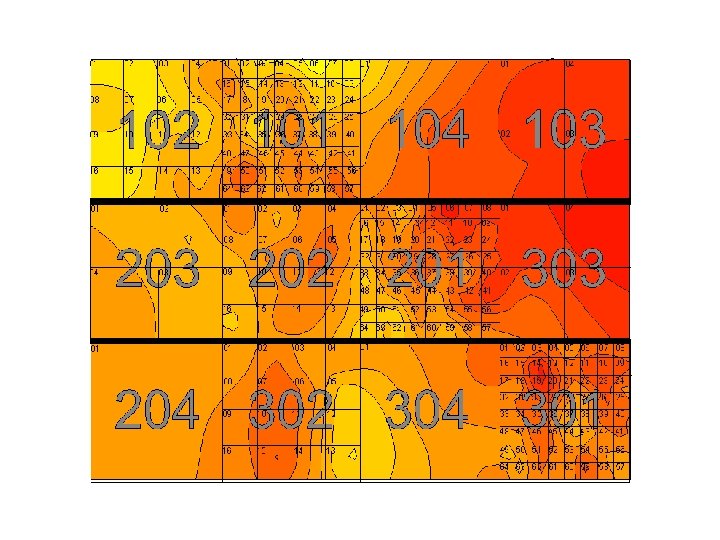
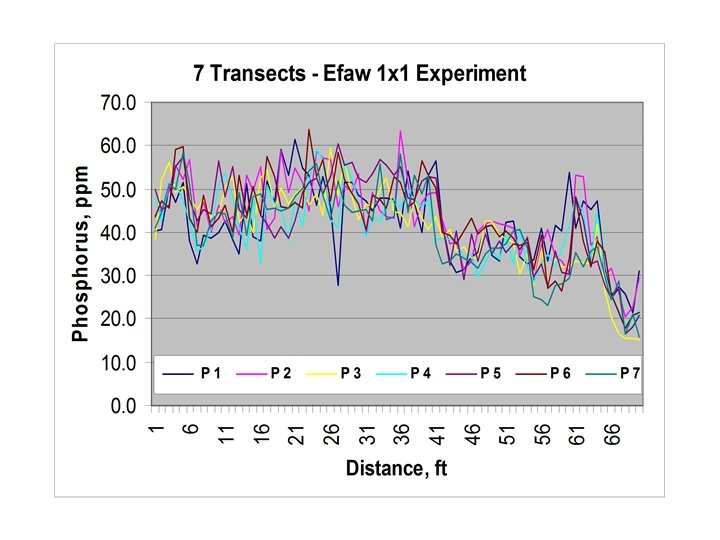
Efaw Phosphorus 1 x 1 Experiment Distance, ft 66 61 7 56 6 51 46 5 41 36 4 31 26 3 21 16 2 11 6 1 1
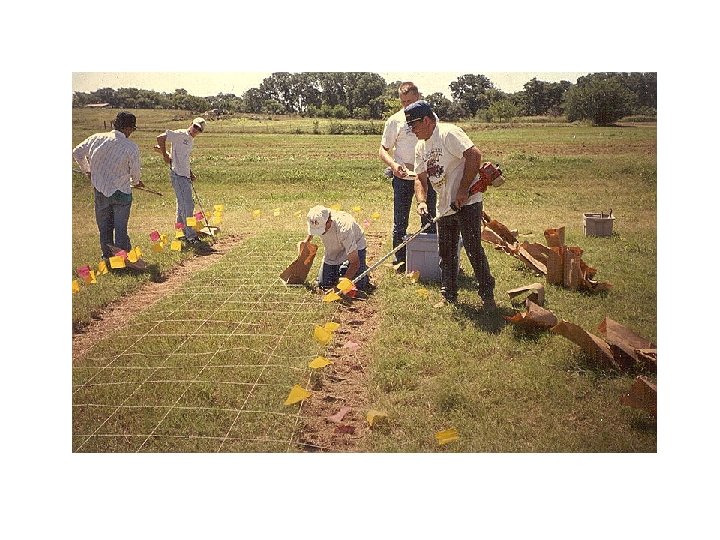
Sampling Strategies �Random Sampling - Sample the entire field randomly and composite the sample. �Stratified Random Sampling - Divide the field into zones or areas based on agronomic reasons. Randomly sample and composite samples with the zone. �Grid Sampling - Sample at a fixed interval or grid. Treat each the entire cell or field element based on the sample from that cell. OR Use some interpolation scheme to predict values between sample points.
Field Element or Cell Size 6 x 66 6 x 6 3 x 3 2 x 2 7 x 70 Random Sampling Fixed Interval or Grid Sampling Stratified Random Sampling Zone Width
Location of Sampled Area for Three Sampling Strategies No. Samples/ Replication Row Sampled Random Sampling 1 st Sample Zone Fixed Interval or Stratified Random Interval Between Samples Fixed Interval Sampling 1 1 -70 70 2 1 -70 1 -35 35 5 1 -70 1 -14 14 7 1 -70 1 -10 10 10 1 -7 7 14 1 -70 1 -5 5
Total Soil N - Burneyville Sample Strategy Error – Sampling Strategy by Sample Size 1 % 2 5 7 10 14 ______________%______________ Random 15. 9 --- --- --- Fixed Interval 16. 4 --- --- --- Stratified Random 11. 7 --- --- --- LSD. 05 Mean LSD. 05 2. 1 _____________ N. S. ______________ 23. 5 20. 3 13. 3 11. 7 9. 8 9. 3 _____________ 2. 1______________
Phosphorus - Burneyville Sample Strategy Error – Sampling Strategy by Sample Size 1 % 2 5 7 10 14 ______________%______________ Random 16. 6 39. 6 28. 6 16. 0 12. 3 10. 2 9. 8 Fixed Interval 22. 7 35. 1 28. 8 21. 1 15. 6 19. 0 16. 3 Stratified Random 19. 4 22. 5 24. 6 11. 8 15. 1 14. 9 10. 7 LSD. 05 Mean LSD. 05 3. 1 _____________ 7. 6______________ 32. 4 27. 4 16. 3 14. 7 12. 3 _____________ 4. 4______________
Potassium - Burneyville Sample Strategy Error – Sampling Strategy by Sample Size 1 % 2 5 7 10 14 ______________%______________ Random 11. 9 25. 5 17. 5 10. 7 9. 7 8. 5 6. 1 Fixed Interval 17. 5 29. 2 23. 1 20. 3 14. 3 13. 3 Stratified Random 13. 0 17. 5 9. 6 6. 3 6. 1 LSD. 05 Mean LSD. 05 2. 5 _____________ 6. 1______________ 21. 8 21. 4 14. 4 13. 2 9. 7 8. 5 _____________ 3. 5______________
Soil Organic Carbon - Burneyville Sample Strategy Error – Sampling Strategy by Sample Size 1 % 2 5 7 10 14 ______________%______________ Random 13. 3 24. 1 19. 6 11. 1 9. 2 6. 7 6. 4 Fixed Interval 18. 4 20. 1 28. 5 16. 1 16. 8 14. 7 15. 0 Stratified Random 12. 8 23. 4 24. 3 9. 0 7. 3 6. 3 LSD. 05 Mean LSD. 05 2. 4 _____________ 5. 8______________ 22. 6 24. 1 12. 2 11. 6 9. 3 _____________ 3. 3______________
Soil p. H - Burneyville Sample Strategy Error – Sampling Strategy by Sample Size 1 % 2 5 7 10 14 ______________%______________ Random 1. 6 --- --- --- Fixed Interval 2. 2 --- --- --- Stratified Random 1. 5 --- --- --- LSD. 05 0. 3 Mean LSD. 05 _____________ N. S. ______________ 3. 5 2. 2 1. 8 1. 5 1. 2 1. 0 _____________ 0. 5______________
Total Soil N - Efaw Sample Strategy Error – Sampling Strategy by Sample Size 1 % 2 5 7 10 14 ______________%______________ Random 6. 2 13. 3 8. 2 5. 2 3. 8 3. 7 3. 2 Fixed Interval 7. 2 9. 7 10. 0 7. 2 5. 7 5. 6 5. 1 Stratified Random 3. 9 6. 8 5. 1 3. 4 2. 2 LSD. 05 0. 9 Mean LSD. 05 _____________ 2. 2______________ 9. 9 7. 8 5. 3 4. 3 3. 9 3. 5 _____________ 2. 2______________
Phosphorus - Efaw Sample Strategy Error – Sampling Strategy by Sample Size 1 % 2 5 7 10 14 ______________%______________ Random 9. 0 16. 6 11. 0 9. 3 6. 3 5. 7 5. 0 Fixed Interval 12. 2 19. 9 15. 4 12. 9 9. 0 3. 0 Stratified Random 6. 5 17. 0 7. 5 5. 3 3. 4 3. 7 2. 2 LSD. 05 1. 3 _____________ 3. 3______________ Mean LSD. 05 17. 8 11. 3 9. 2 7. 6 6. 1 3. 4 _____________ 1. 9______________
Potassium - Efaw Sample Strategy Error – Sampling Strategy by Sample Size 1 % 2 5 7 10 14 ______________%______________ Random 11. 3 21. 7 16. 8 10. 6 8. 3 6. 3 4. 3 Fixed Interval 14. 7 24. 4 24. 2 11. 2 10. 3 9. 5 8. 8 Stratified Random 10. 4 18. 5 13. 3 8. 0 8. 8 7. 6 6. 2 LSD. 05 Mean LSD. 05 2. 3 _____________ 5. 6______________ 21. 5 18. 1 9. 9 9. 1 7. 8 6. 5 _____________ 3. 2______________
Soil Organic Carbon - Efaw Sample Strategy Error – Sampling Strategy by Sample Size 1 % 2 5 7 10 14 ______________%______________ Random 4. 2 --- --- --- Fixed Interval 9. 3 --- --- --- Stratified Random 5. 1 --- --- --- LSD. 05 1. 2 Mean LSD. 05 _____________ N. S. ______________ 10. 0 7. 4 5. 5 1. 7 4. 5 4. 1
Soil p. H - Efaw Sample Strategy Error – Sampling Strategy by Sample Size 1 % 2 5 7 10 14 ______________%______________ Random 1. 2 2. 0 1. 5 1. 3 0. 9 0. 8 0. 6 Fixed Interval 1. 7 2. 3 2. 0 1. 6 1. 7 1. 8 0. 9 Stratified Random 1. 0 2. 5 1. 2 0. 5 0. 7 0. 4 0. 5 LSD. 05 0. 2 Mean LSD. 05 _____________ 0. 5______________ 2. 3 1. 6 1. 1 1. 0 0. 7 _____________ 0. 3______________
Number of randomly selected samples required to reach 10, 5, and 2 % error from the true average value with a 90% probability Number of Samples Variable Location C. V. Total Soil N Burneyville 31. 2 11 41 81 Efaw 12. 3 --- 6 52. 1 29 92 270 Efaw 22. 9 5 22 105 Burneyville 28. 9 10 35 140 Efaw 29. 4 10 35 140 Burneyville 32. 2 17 54 165 Efaw 14. 1 2 8 43 Burneyville 4. 2 --- 4 Efaw 3. 2 --- 3 Phosphorus Burneyville Potassium Organic C p. H 10% Error 5% Error 2% Error
Conclusions • Random sampling and stratified random sampling strategies require a similar number of samples to precisely describe the mean value of the soil variables measured in the 7 ft by 70 ft area. • Fixed interval sampling required more samples to produce the same precision as random or stratified random sampling. • The OSU recommendation of collecting 15 to 20 soil samples and averaging them should give us an estimate within 5 to 10% of the true mean value.
Conclusions • Stratified random sampling may provide a more precise measure of the true mean, when it is known that in local regions the measured value is related and not randomly distributed.
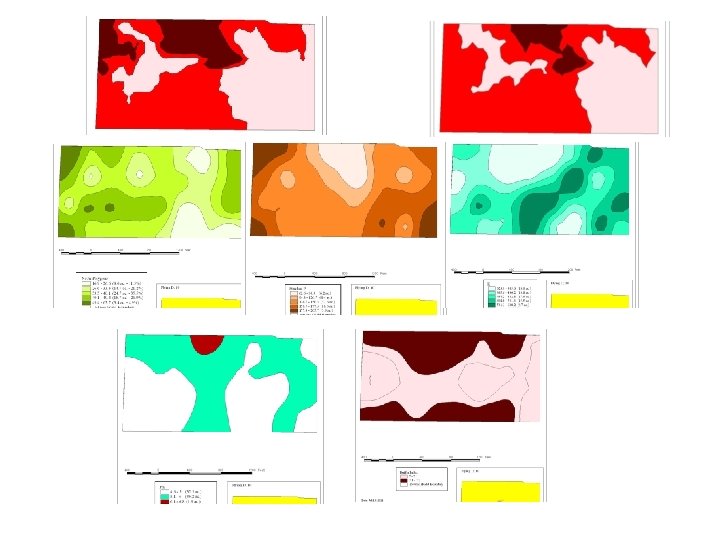
Distribution of Nutrients Throughout Fields
Drawing Lines • Lines for zones based on 1 factor – Yield History • Yield levels • Yield Stability – Topography – Soil Type – Soil EC – Geography / boundaries – Organic Matter – Nutrient levels
Electrical Conductivity (EC) • Soil EC is soil electrical conductivity– a measurement of how much electrical current soil can conduct. It’s an effective way to map soil texture because smaller soil particles such as clay conduct more current than larger silt and sand particles. Soil EC measurements have been used since the early 1900’s • Veris mobilized the process and added GPS. As the Veris EC cart is pulled through the field, one pair of coulter-electrodes injects a known voltage into the soil, while the other coulterelectrodes measure the drop in that voltage. • The result: a detailed map of the soil texture variability in the crop rooting zone
Deteriming the Variable • Using 1 factor to determine other unrelated factors P P Elevation K
Elevation
Soil EC
Soil p. H
Buffer Index Lime required (tons 100% ECCE) Buffer Index p. H 6. 8 p. H 6. 4 Over 7. 1 None 7. 1 0. 5 None 7. 0 0. 7 None 6. 9 1. 0 None 6. 8 1. 2 0. 7 6. 7 1. 4 1. 2 6. 6 1. 9 1. 7 6. 5 2. 2 6. 4 3. 1 2. 7 6. 3 3. 7 3. 2
Phosphorus Soil Test P Index % Sufficiency P 2 O 5 lbs/ac 0 25 80 10 45 60 20 80 40 30 85 30 40 90 20 65+ 100 0
Potassium Soil Test K Index % Sufficiency K 2 O lbs/ac 0 50 60 75 70 50 125 80 40 200 95 20 250+ 100 0
Buffer Index Lime required (tons 100% ECCE) Buffer Index p. H 6. 8 p. H 6. 4 Over 7. 1 None 7. 1 0. 5 None 7. 0 0. 7 None 6. 9 1. 0 None 6. 8 1. 2 0. 7 6. 7 1. 4 1. 2 6. 6 1. 9 1. 7 6. 5 2. 2 6. 4 3. 1 2. 7 6. 3 3. 7 3. 2
Phosphorus Soil Test P Index % Sufficiency P 2 O 5 lbs/ac 0 25 80 10 45 60 20 80 40 30 85 30 40 90 20 65+ 100 0
Shallow EC K Elevation Soil p. H P
Partners in Research
Partners in Research • Yield closely related to BI <. 0001, • Yield not statistically related to any other variable. Relationship between all micros Sig but negatively. • Yield best related to depth to limiting layer. Trend is holding at specific sites
Ph
Buffer Index
Soil p. H P Shallow EC Buffer Index
Variability in your fields • Zone Management – What is the Product? – Yield Based – Topography based – Soil based • Grid Soil Sampling – What is the product? – Is it worth the money?
Summary • All techniques are potentially the right way and the wrong way. • MUST have variability before you treat for variability! • Sometimes Nutrient needs are the same sometimes its not, more often its not. • Look at the cost of the method versus the economics of the production system.
Perfection P & K • Immobile P and K • Soil and Crop Driven – First Year evaluate response
Perfection P & K • Immobile P and K � Rate Studies in each zone 10 lbs 20 lbs 30 lbs 40 lbs
Perfection P & K • Understand the Benefits and Limitations of Soil Testing • Broad sweeping recommendations • Recommendations are Conservative in both directions • Will recommend only when likely to respond • Rate will ensure maximum yield for the majority
Perfection N • Mobile Nutrients N, S, B • Yield Driven!! – Make determinations based off Environment and Plant measured in Season High / Adequate Rate
Perfection N • Understand the Benefits and Limitations of Soil Testing • Nitrogen levels in soil are not static – Soil test in August not always relevant in March. • Dependent upon environment and yield level • Multiple yield potentials in the field • Recommendation based on Averages.
Perfection N • N-Rich Strip as a decision tool – Not Perfection • Impact of right field rate • Simple Yes or No – No data, but means more is years of extreme. – Years of Moisture, Nuclear – Years of Drought, Abscent • N-Rich and SBNRC – 20 lbs N/acre on Winter Wheat, 0 difference in yield • Price of N drives value of Practice. – 18 locations in 2 yrs, Zero samples <12% Protien
Perfection N • Fields are highly variable – Why apply flat field rate – Why apply even zone level rate
Management Zones • Great way to break the field up • Moved from – 1 rate over entire farm – 1 rate for each field – 1 rate for each zone • Smaller the application area a informed decision is made on the more precise.
Drawing Lines • Lines for zones based on 1 factor – Yield History • Yield levels • Yield Stability – Topography – Soil Type – Soil EC – Geography / boundaries – Organic Matter – Nutrient levels
Deteriming the Variable • Using 1 factor to determine other unrelated factors P P Elevation K
Shallow EC K Elevation Soil p. H P
What is OSU Doing • NPKS response strips. • Looking at – Soil Type – Past practice – Soil Test Values – Cropping System – Environment