Chapter 3 Research Design a plan that shows
 and")


- Slides: 8
Chapter 3: Research Design – a plan that shows how (methods and data) and why (literature review and theory background) a researcher intends to study an empirical question. I. Selection of RDs shaped by: A. Purpose – exploratory, descriptive, or explanatory? B. Practical limitations – unethical, lack of data, time, or money C. RDs to testing hypotheses have at least one of the following objectives: 1. Establish relationships between ________ 2. Demonstrate that the results are ______ true in the real world 3. Reveal the time order of phenomena
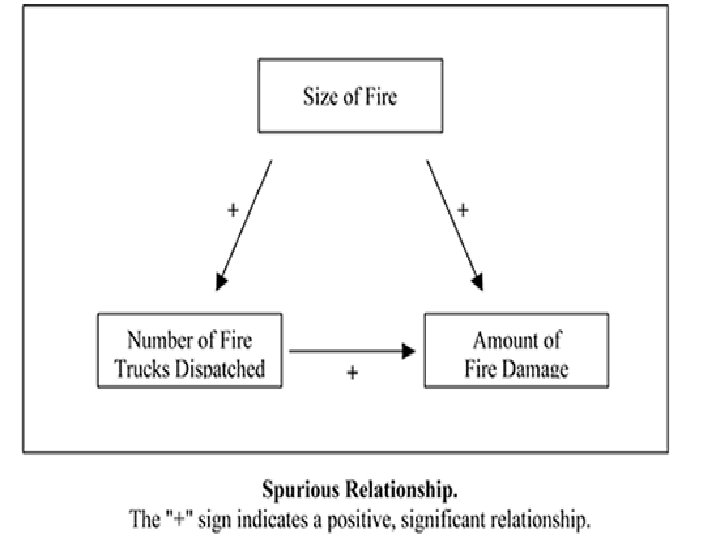
II. A. Causality and Controlled Experiments Correlation or Causation? Example: Negative Ads and Turnout (Table 3 -1) 1. There is a relationship; is it causal? Could be that the unexposed are more educated and have a stronger sense of civic duty. If true, then we observe a noncausal relationship only (outlawing negative ads would have no effect on turnout). 2. ______ relationships (joint causation) – when two things are both affected by a third factor and only appear to be related. When the third factor is taken into account (controlled for), the relationship weakens (example: # of fire trucks causes greater fire damage? ) B. Requirements for Causal Design 1. Covariation: X (cause) does in fact vary with Y (effect) in either a positive or negative direction. 2. Time order: X occurs before Y in time (cause must always precede effect). 3. Elimination of alternative causes (confounding factors and spurious relationships). How we design research helps us establish causal relationships.
III. A. 1. a. b. 2. 3. Randomized Controlled Experiments Experimentation (greater certainty of causality) – research that allows the researcher to control exposure to an experimental variable (test factor or independent variable), the assignment of subjects to different groups, and the observation or measurement of responses and behavior. Not common in Political Science, but adapted in survey research Subjects: Experimental group (exposed or tested to “treatment” variable). Control group – group not exposed to treatment/program Randomization – chance process of assigning subjects to each group (or using precision matching to assure group similarities). Goal = groups are same except for treatment. Researcher determines when, where and under what conditions treatment stimulus occurs.
4. Researcher measures the treatment impact or response (often referred to as pre and post-test results). Shows if and how much of an experimental effect there is. 5. Research controls environment and is able to exclude or control the effect of extraneous factors (contamination). B. Application Questions: how could we conduct this type of research on negative ads and voting? (p. 56 -57). 1. Identification of variables (dependent and independent) 2. Randomized group assignment (coin flipping) 3. Questionnaire for demographic and political factors as well as dv question (averages should be same) 4. Pretest – both groups view 15 minute news report. 5. Treatment – Experimental group views negative commercials 6. Posttest – all subjects view another 15 minute news report. 7. Experimental effect = change in experimental group’s intention to vote % (E = Mexp 2 – Mexp 1) How has this satisfied our requirements for causality?
C. Problems with Internal Validity of Experimentation (Internal Validity is the extent to which the research procedure demonstrated a true cause and effect relationship and was not due to some other factor). 1. History – allowing events or conditions to change in between pre and post testing. 2. Maturation – change in the subjects themselves in between pre and post testing (may change reaction to treatment too). 3. Testing – sometimes the treatment itself may change the predisposition of the subject (e. g. , effect of a political debate on political awareness; pretest question may sensitize them to politics suddenly). 4. Selection biases – subjects may be picked according to some nonrandom process (e. g. , smoking program). 5. Experimental mortality or attrition – subjects may leave one group or another and change the comparability of the groups. D. Problems with ______ Validity and Experimentation (External Validity is the extent to which the obtained results can be generalized to other populations, times, and settings). 1. Population from which pool is drawn may only be in one area, from one age group, from one race, etc.
2. IV. A. B. C. D. Artificial treatments may not reflect “real world” (e. g. , are groups exposed to one negative ad or hundreds? In the context of a room or filtered through comments of friends). Nonexperimental Designs (use of survey data, focus groups, aggregate data or collectivities, content or document analysis, case studies) Interrupted Time Series Analysis – Repeated measures of a dependent variable (e. g. , # of conservative SC Decisions). Then, an event in time is identified (say change in party control of Congress). Observe changes in dv Continuous Time Series Analysis – repeated measures of both dv and iv (conservative SC decisions and “public mood” p. 79). Cross-sectional design – measurements of dv and iv at a particular point in time (e. g. , Survey and question: were evangelicals more likely to vote Republican in the 2004 election? Or compare two school districts science test scores; one with no instruction in evolutionary theory). No randomization and no trend observation. Panel Studies – cross-sectional design that introduces time. Same subjects or units measured repeatedly over time.
E. Case study – researcher examines one or a few cases in detail, typically using data collection methods such as personal interviews, document analysis, and observation (distinctive from empirical inquiry; not quantitative typically but qualitative). Example: Do countries that adopt popular election methods have greater public trust of government. Case study vs Large-case # (n) study. F. _______ modeling – simple and abstract representation of reality that purports to show variables or parts of a system fit together. Assumes people are rational or “utility-maximizers” meaning they have preferences and make choices that always increase their well-being. For example, a simple formal model of vote choice is UAv. B= UA – UB where U is expected utility and A/B are candidates or parties (0 means you abstain, + number means you vote for A, - means you vote for B). But, if the absolute value of UAv. B is less than the value of another factor C (information and transaction costs of voting), then one abstains still. Also, we must consider E, the intangible benefits of voting. Called paradox of voting because of another factor P (probability of casting a decisive vote). So, we get P|UAv. B|+E </> C