
Chapter 3 Quality Management 1 What business are
Chapter 3: Quality Management 1
What business are you in? CEO of GM announced, “GM wasn’t in the business of making cars, GM was in the business of making money”. l Taylor > Drucker > Mc. Namara l l According to Tom Peters from “In Search of Excellence” fame Chapter 3: Quality Management 2
Chapter 3 Quality Management Chapter 3: Quality Management 3
Chapter 3: Quality Management 4
Examples Chapter 3: Quality Management 5
West Babylon School District Began applying continuous improvement and quality to its administrative and education processes. l TQE l Applied Deming’s “ 14 Points” for management to administrative process. l Numerous improvements made. l Chapter 3: Quality Management 6
National Semiconductor l Early proponent of total quality l l l Quality circles 1981 Preventive maintenance 1982 Statistical process control 1983 Design of experiment techniques 1984 Design for manufacturing techniques 1986 Chapter 3: Quality Management 7
National Semiconductor continued l Second stage of quality initiatives (1990 s) l Focused on customer-supplier relationships Customer satisfaction Customer score cards Process analysis Employee empowerment Team strategies Problem solving techniques l Visioning l l l Chapter 3: Quality Management 8
National Semiconductor continued l Third stage l l Personal mastery Shared vision Systems thinking Team learning Chapter 3: Quality Management 9
NCR Produces business information processing systems l Recognized need to continuously improve its products l Major component of its continuous improvement program is use of statistical techniques l Chapter 3: Quality Management 10
NCR continued l Began using statistical process control techniques in 1985 to monitor its autoinsertion operation on its printed circuit board assembly line. l l Line was producing an unacceptable number of defects. Reasons included misinserted or broken parts, using the wrong parts and so on. Chapter 3: Quality Management 11
NCR continued l Quality engineering department established process averages, control limits and guidelines for action for “out-ofcontrol” conditions. l l l Production was stopped when out-of-control condition detected until cause identified. Random samples of 1000 insertions were collected each hour and the results plotted on a c chart. Out-of-control situations were investigated to identify the assignable cause. Chapter 3: Quality Management 12
NCR concluded l Learned a great deal about the autoinsertion operation using the control charts. l l l Problem of broken parts was traced to a specific supplier. Because of the success of this experiment, statistical process control was implemented across the entire assembly line. NCR has since changed its approach from “inspect and repair” to “prevent and design for quality. ” Chapter 3: Quality Management 13
Timber Companies l Because of environmental restrictions and limited quantities of large-diameter trees, many timber companies are using statistical quality control techniques to maximize the quality and quantity of finished lumber produced Chapter 3: Quality Management 14
Converting Logs into Finished Lumber Debarked log split down the middle l Split log resawed to create boards l Ends of boards trimmed l Boards are stacked l Log debarked l Boards dried in kiln for 2 to 30 days l Boards are planed l Chapter 3: Quality Management 15
Applying SPC to the Stacking Operation Important because this determines straightness of finished lumber. l Lumber stacked in layers. l Separators placed between layers to form air channels and transfer weight of wood. l Automated equipment used to stack lumber making it necessary to monitor the alignment of the separators. l Chapter 3: Quality Management 16
Stacking Operation continued Estimated cost of misplaced separator is $31. 50 owing to board warping. l Average sawmill handles upwards of 30, 000 separators each day. l Measuring board placed in front of each column of separators to monitor separator alignment. l Stack of lumber contains approximately 15 columns of separators and 360 separators. l Chapter 3: Quality Management 17
Stacking Operation concluded Total number of misplaced separators is divided by the total number of separators in the stack of lumber and result plotted on p chart. l Using p chart, workers monitor the stacking equipment and identify problems before an out-of-control situation arises. l Chapter 3: Quality Management 18
Quality Management Perspectives Chapter 3: Quality Management 19
Quality Costs l Two primary sets of costs involved in quality l l Control costs Failure costs These costs are often as high as 15 to 35% of sales l Costs often broken down into four categories l Chapter 3: Quality Management 20
Category 1: Prevention Costs l Costs associated with trying to prevent defects and errors l l l Training for quality Educating suppliers Designing product for quality Designing production system for quality Preventive maintenance Chapter 3: Quality Management 21
Category 2: Appraisal Costs of determining current quality l l l Measuring and testing parts Running special test laboratories Acquiring special testing equipment Conducting statistical process control Inspecting incoming materials Chapter 3: Quality Management 22
Category 3: Internal Costs of Defects l Costs incurred when defects are found before shipment/delivery to customer. l l Labor and materials going into scrap Reworking and retesting to correct defects Downtime of equipment and labor while waiting for repairs Yield losses Chapter 3: Quality Management 23
Category 4: External Costs of Defects l Costs of trying to correct defects after receipt by customer. l l l Lost of customer goodwill Recalls to correct problem Warranty, insurance, and legal suit settlements Chapter 3: Quality Management 24
Quality Management Philosophies Chapter 3: Quality Management 25
Chapter 3: Quality Management 26
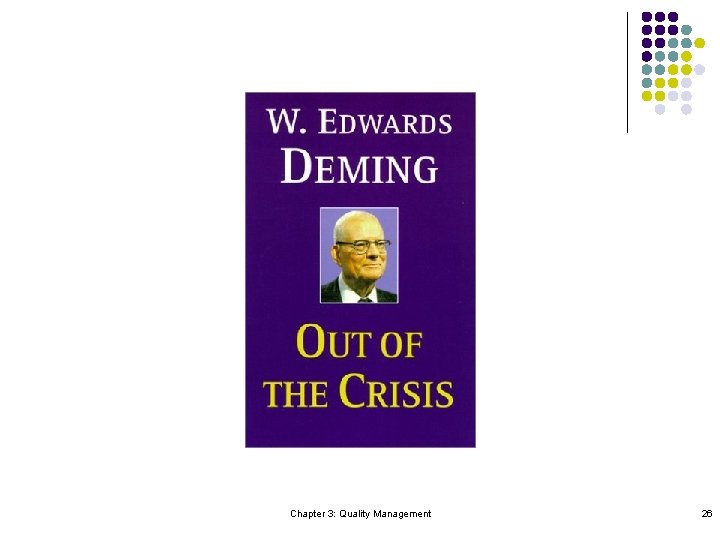
W. Edwards Deming Major source of poor quality is variation l Quality improvement the responsibility of top management l All employees should be trained in use of problem solving tools and especially statistical techniques l Chapter 3: Quality Management 27
Deming’s 14 Points Create constancy of purpose l Adopt the new philosophy l Cease dependence on mass inspection l End practice of awarding business on basis of price tags l Improve constantly and forever l Institute modern methods of training l Chapter 3: Quality Management 28
Deming’s 14 Points continued Institute modern method of supervision l Drive out fear l Breakdown organizational barriers l Eliminate arbitrary numerical goals l Eliminate work standards and quotas l Remove barriers that reduce pride of workmanship l Chapter 3: Quality Management 29
Deming’s 14 Points continued Institute a vigorous program of education and training l Push the other 13 points everyday l Chapter 3: Quality Management 30
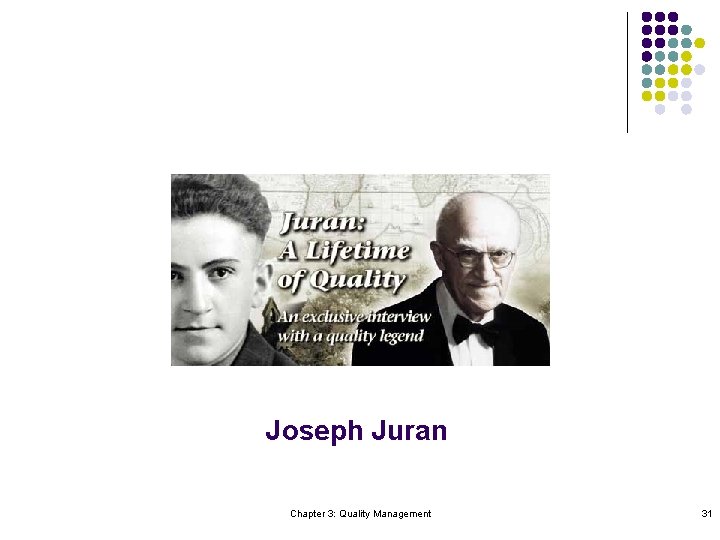
Joseph Juran Chapter 3: Quality Management 31
Joseph Juran Quality Control Handbook (1951) l Quality Trilogy l l l Quality Planning Quality Control Quality Improvement Need to place more emphasis on planning and improvement Chapter 3: Quality Management 32
Joseph Juran l continued Organizations move through 4 phases 1. Minimize prevention and appraisal costs – results in increased external failure costs 2. Increase appraisal costs – finds defects sooner and raises internal costs 3. Process control introduced increasing appraisal costs but lowering internal and external failure costs 4. Prevention costs increased in effort to lower total quality costs Chapter 3: Quality Management 33

Phillip Crosby Chapter 3: Quality Management 34
Philip B. Crosby Quality is conformance to requirements, not elegance l Better to produce item right the first time than to try to inspect quality in l Quality at the source - responsibility shifted from quality control department to workers l Chapter 3: Quality Management 35
Total Quality Management (TQM) Quality problems do not exist, rather organizations have functional problems l Zero defects only meaningful performance standard l Cost of quality the only performance measure l Chapter 3: Quality Management 36
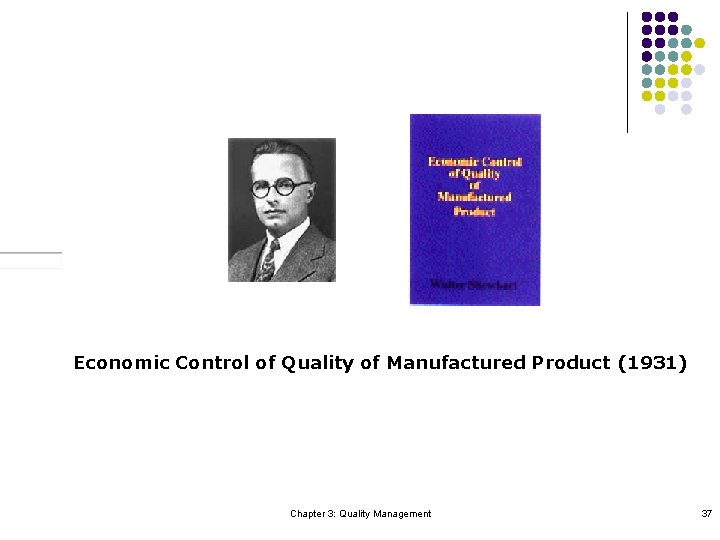
Economic Control of Quality of Manufactured Product (1931) Chapter 3: Quality Management 37
History of TQM Dr. Shewart began using statistical control at the Bell Institute in 1930 s l Military standards developed in 1950 s l After World War II, Japanese Union of Scientist and Engineers began consulting with Deming l Deming Prize introduced in Japan in 1950 l Chapter 3: Quality Management 38
History of TQM continued Juran writes “Total Quality Control” 1951 l Juran makes first trip to Japan in 1954 l “Quality” Japan’s national slogan in 1956 l First quality circles created in 1957 l 10, 000 quality circles by 1966 l 100, 000 quality circles by 1977 l First U. S. quality circle 1974 l Chapter 3: Quality Management 39
Five Steps in TQM Determine what customers want l Develop products and services l Develop production system l Monitor the system l Include customers and suppliers l Chapter 3: Quality Management 40
New Responsibilities of Quality Control Department Training employees how to control quality l Conducting random quality audits l Consulting on quality problems l Determining cost of quality l Helping implement quality control ideas l Overseeing final test of finished goods l Chapter 3: Quality Management 41
Quality Circles Focus on all problems facing workers l Composed of natural work groups l Not limited to shop employees l Usually spend couple hours per week on company time analyzing problems l Chapter 3: Quality Management 42
Quality Tools Process analysis l Runs chart l Control chart l Pareto chart l Histogram l Scatter diagram l Fishbone chart l Presentation skills l Analysis skills l Brainstorming l Chapter 3: Quality Management 43
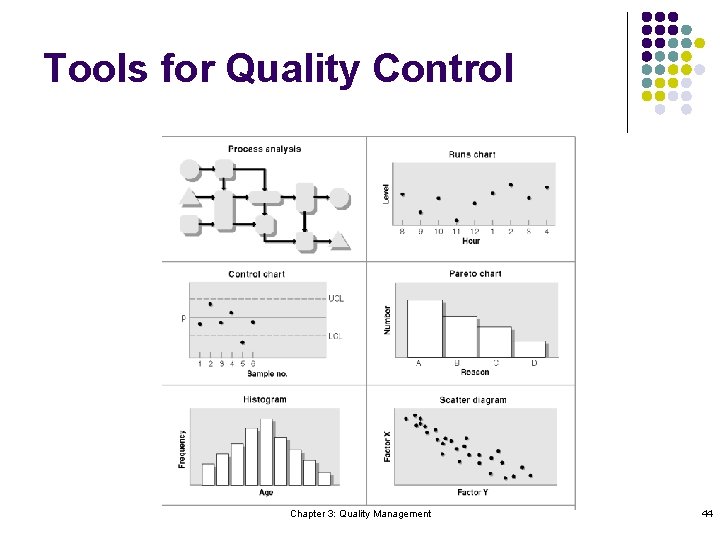
Tools for Quality Control Chapter 3: Quality Management 44
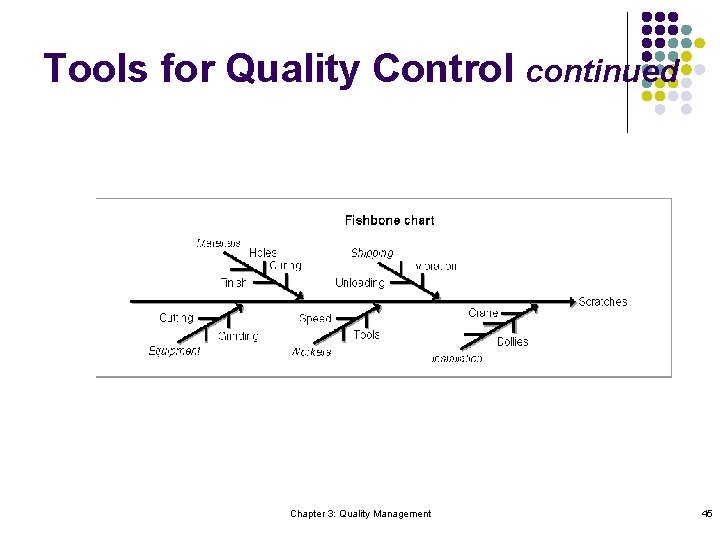
Tools for Quality Control continued Chapter 3: Quality Management 45
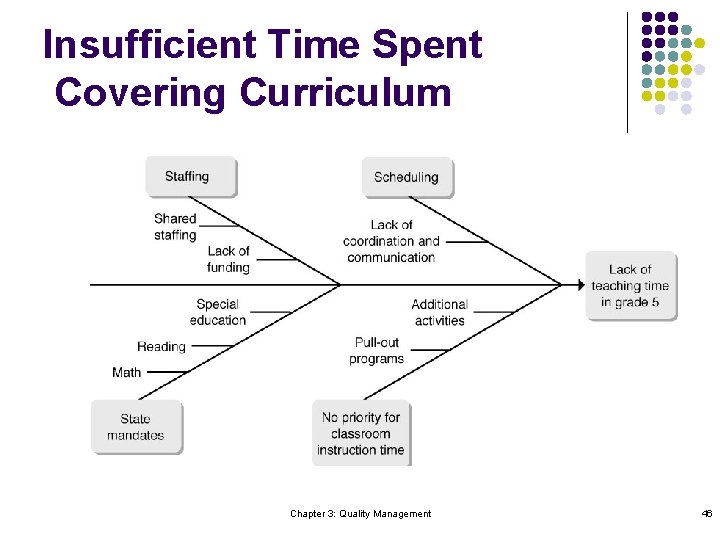
Insufficient Time Spent Covering Curriculum Chapter 3: Quality Management 46
Taguchi Methods Design for Manufacturability (DFM) l Procedure for statistical testing to determine best combination of product and transformation system design that will make output relatively independent of normal fluctuations in the production system l Chapter 3: Quality Management 47
Quality Function Deployment (QFD) l Tools for helping translate customer desires directly into product service attributes. Chapter 3: Quality Management 48
Benchmarking Comparing an organization’s performance to performance of other organizations. Chapter 3: Quality Management 49
Purposes for Benchmarking Comparing an organization’s performance to the best organization’s performance l Comparing an organization’s business processes with similar processes l Comparing products and services l Identifying best practices to implement l Projecting trends l Chapter 3: Quality Management 50
Steps in Benchmarking l Preparing for the study l l Collecting data l l l obtaining top management support published data original research Using what was learned to improve organizational performance Chapter 3: Quality Management 51
Benchmarking Goals Learning from experiences of others l Determining how organization is performing relative to the best l Helping to prioritize improvement efforts l l l developing stretch goals overcoming complacency within organization Chapter 3: Quality Management 52
Quality in Services Measuring is difficult l Training in standard procedures often used to improve quality l One way to measure quality of services is to use customer satisfaction surveys l J. D. Power and Associates uses surveys to rate domestic airlines, hotel chains, and rental car companies. l Chapter 3: Quality Management 53
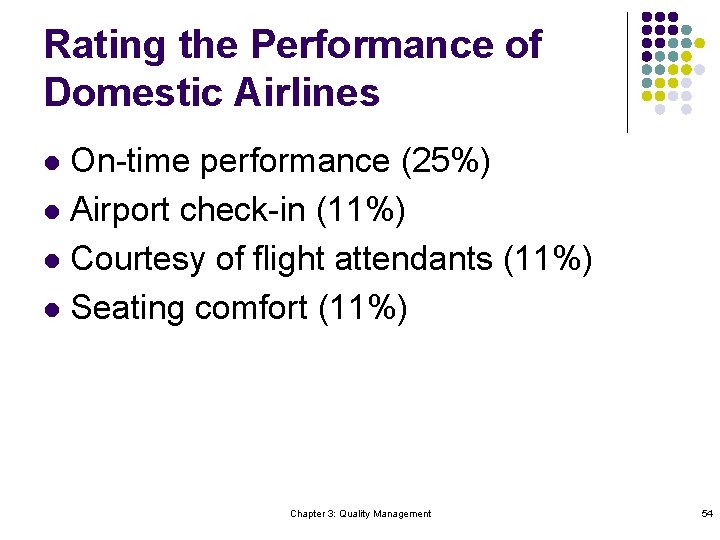
Rating the Performance of Domestic Airlines On-time performance (25%) l Airport check-in (11%) l Courtesy of flight attendants (11%) l Seating comfort (11%) l Chapter 3: Quality Management 54
Service Defections l Organizations should monitor customer defections l l l feedback from defecting customers can be used to identify problem areas can determine what is needed to win them back changes in defection rate can be used as early warning signal Chapter 3: Quality Management 55
Quality Awards/Certifications Chapter 3: Quality Management 56
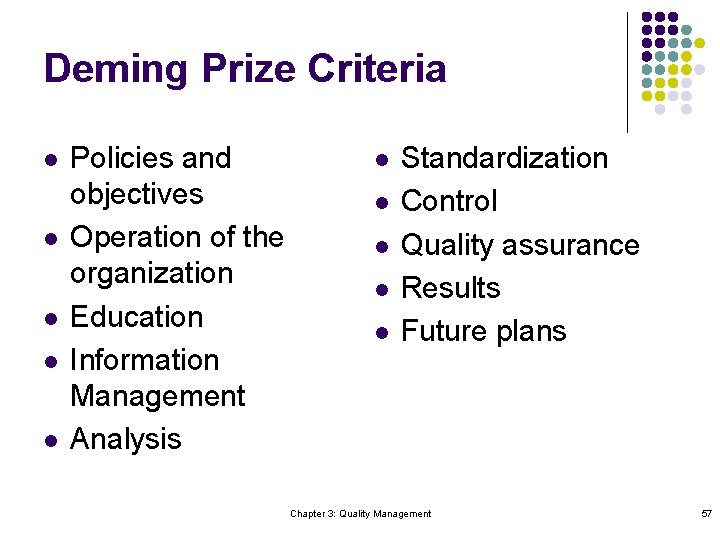
Deming Prize Criteria l l l Policies and objectives Operation of the organization Education Information Management Analysis l l l Standardization Control Quality assurance Results Future plans Chapter 3: Quality Management 57
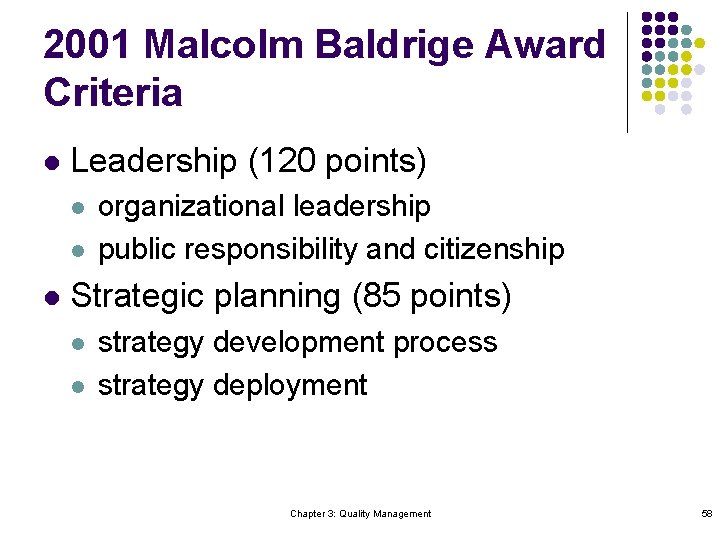
2001 Malcolm Baldrige Award Criteria l Leadership (120 points) l l l organizational leadership public responsibility and citizenship Strategic planning (85 points) l l strategy development process strategy deployment Chapter 3: Quality Management 58
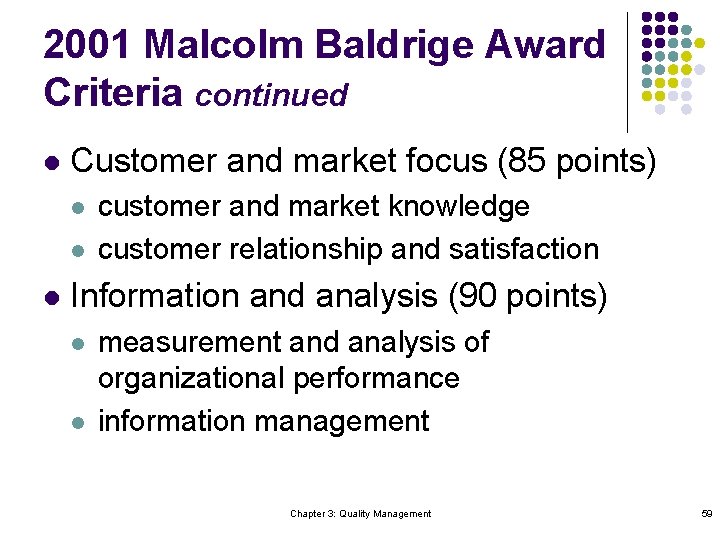
2001 Malcolm Baldrige Award Criteria continued l Customer and market focus (85 points) l l l customer and market knowledge customer relationship and satisfaction Information and analysis (90 points) l l measurement and analysis of organizational performance information management Chapter 3: Quality Management 59
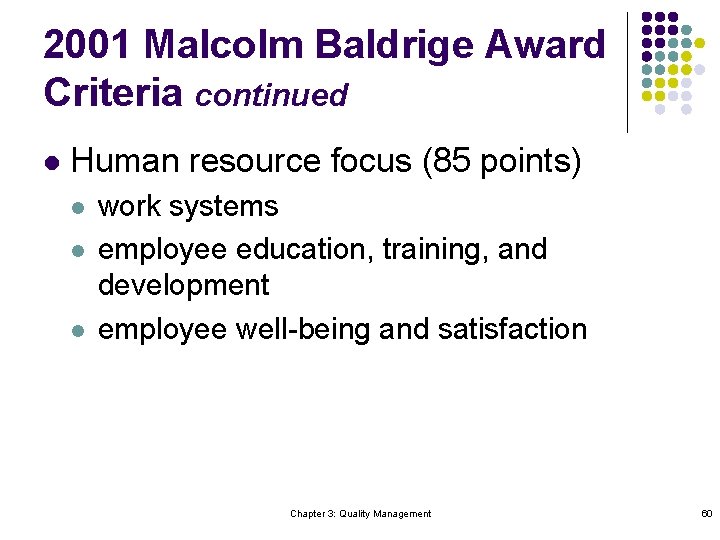
2001 Malcolm Baldrige Award Criteria continued l Human resource focus (85 points) l l l work systems employee education, training, and development employee well-being and satisfaction Chapter 3: Quality Management 60
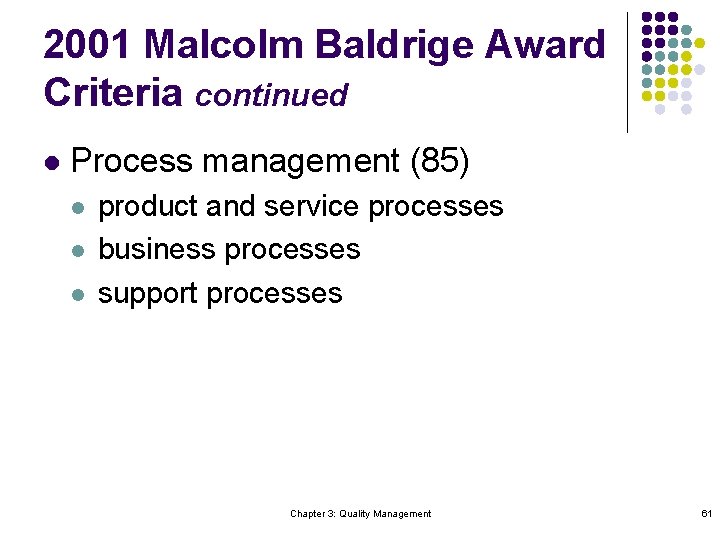
2001 Malcolm Baldrige Award Criteria continued l Process management (85) l l l product and service processes business processes support processes Chapter 3: Quality Management 61
2001 Malcolm Baldrige Award Criteria continued l Business results (450 points) l l Customer-focused results financial and market results human resource results organizational effectiveness results Chapter 3: Quality Management 62
ISO 9000 Guidelines for designing, manufacturing, selling, and servicing products. l Selecting an ISO 9000 certified supplier provides some assurance that supplier follows accepted business practices in areas covered by the standard l Chapter 3: Quality Management 63
Elements of ISO 9000 l l l l l Management Responsibility Quality System Contract Review Design Control Document and Data Control Purchasing Control of Customer Supplied Product Identification and Traceability Process Control Inspection and Testing l l l l l Control of Inspection, Measuring, and Test Equipment Inspection and Test Status Control of Nonconforming Product Corrective and Preventive Action Handling, Storage, Packaging, Preservation, and Delivery Internal Quality Audits Training Servicing Statistical Techniques Chapter 3: Quality Management 64
ISO 14000 l l Series of standards covering environmental management systems, environmental auditing, evaluation of environmental performance, environmental labeling, and lifecycle assessment. Intent is to help organizations improve their environmental performance through documentation control, operational control, control of records, training, statistical techniques, and corrective and preventive actions. Chapter 3: Quality Management 65
Process Capability Chapter 3: Quality Management 66
Process Capability l l TQM’s emphasis on “making it right the first time” has resulted in organizations emphasizing the ability of a production system to meet design specifications rather than evaluating the quality of outputs after the fact with acceptance sampling. Process capability measures the extent to which an organization’s production system can meet design specifications. Chapter 3: Quality Management 67
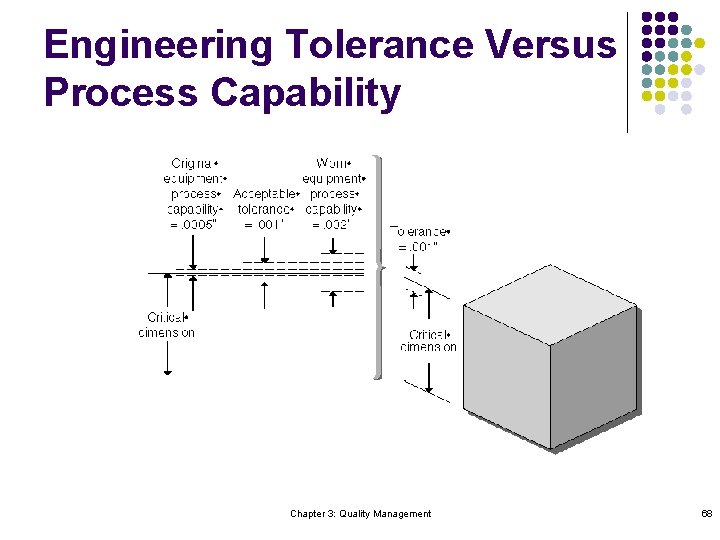
Engineering Tolerance Versus Process Capability Chapter 3: Quality Management 68
Process Capability Depends On: Location of the process mean. l Natural variability inherent in the process. l Stability of the process. l Product’s design requirements. l Chapter 3: Quality Management 69
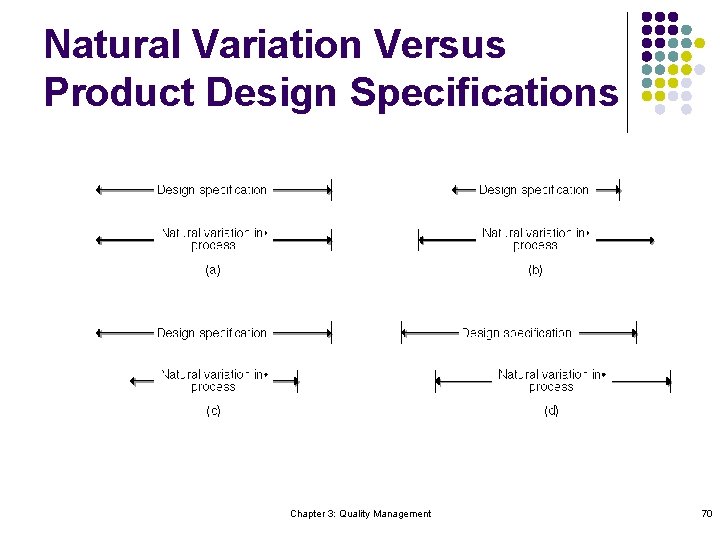
Natural Variation Versus Product Design Specifications Chapter 3: Quality Management 70
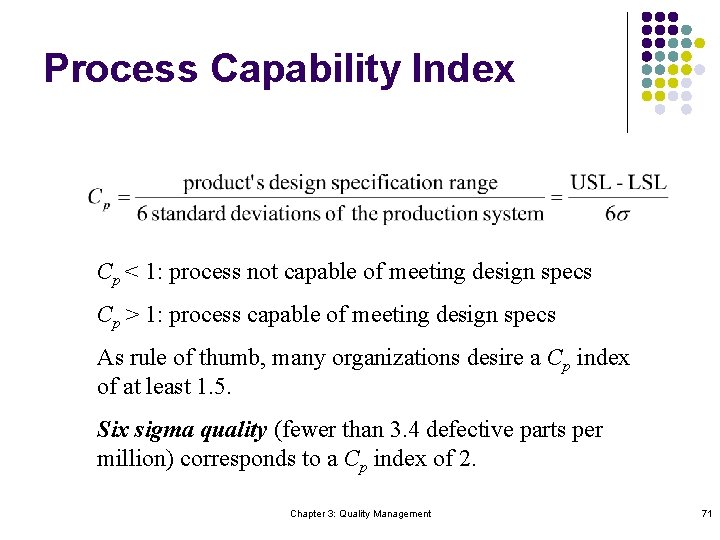
Process Capability Index Cp < 1: process not capable of meeting design specs Cp > 1: process capable of meeting design specs As rule of thumb, many organizations desire a Cp index of at least 1. 5. Six sigma quality (fewer than 3. 4 defective parts per million) corresponds to a Cp index of 2. Chapter 3: Quality Management 71
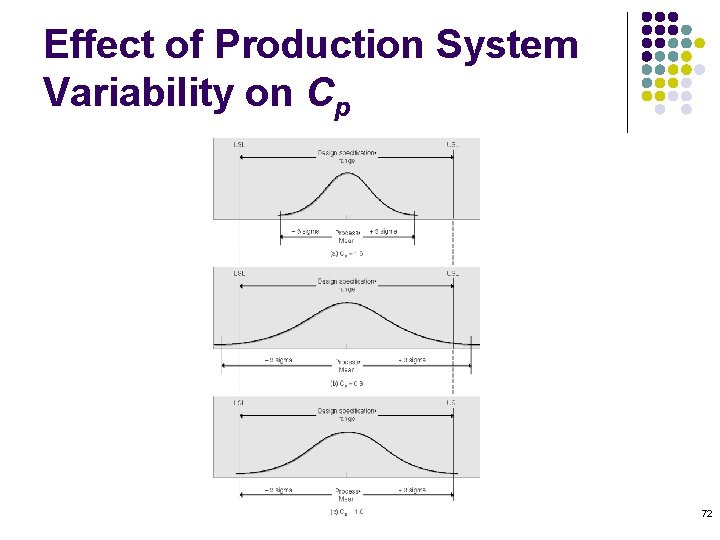
Effect of Production System Variability on Cp 72
Statistical Quality Control Chapter 3: Quality Management 73
Chance Versus Assignable Variation Chance variation is variability built into the system. l Assignable variation occurs because some element of the system or some operating condition is out of control. l Quality control seeks to identify when assignable variation is present so that corrective action can be taken. l Chapter 3: Quality Management 74
Control Based on Attributes and Variables Inspection for Variables: measuring a variable that can be scaled such as weight, length, temperature, and diameter. l Inspection of Attributes: determining the existence of a characteristic such as acceptable-defective, timely-late, and right-wrong. l Chapter 3: Quality Management 75
Control Charts Chapter 3: Quality Management 76
Control Charts l Developed in 1920 s to distinguish between chance variation in a system and variation caused by the system’s being out of control - assignable variation. Chapter 3: Quality Management 77
Control Charts continued Repetitive operation will not produce exactly the same outputs. l Pattern of variability often described by normal distribution. l Random samples that fully represent the population being checked are taken. l Sample data plotted on control charts to determine if the process is still under control. l Chapter 3: Quality Management 78
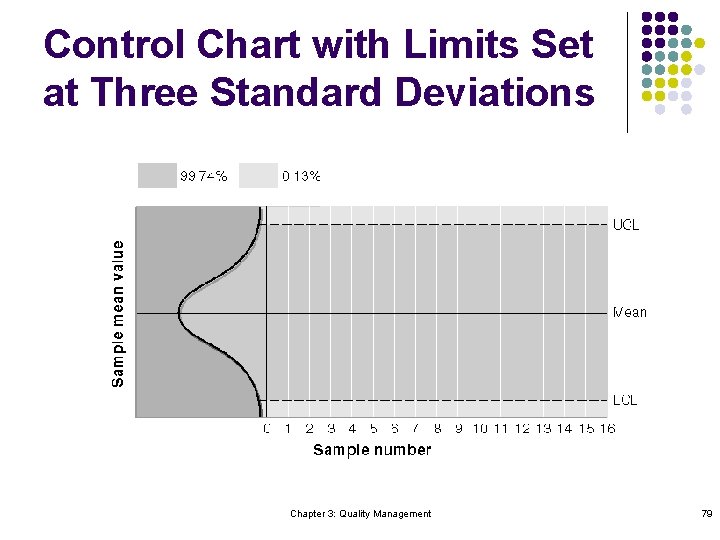
Control Chart with Limits Set at Three Standard Deviations Chapter 3: Quality Management 79
Control Charts for Variables Chapter 3: Quality Management 80
Two Control Charts Sample Means Chart l Range Chart l Chapter 3: Quality Management 81
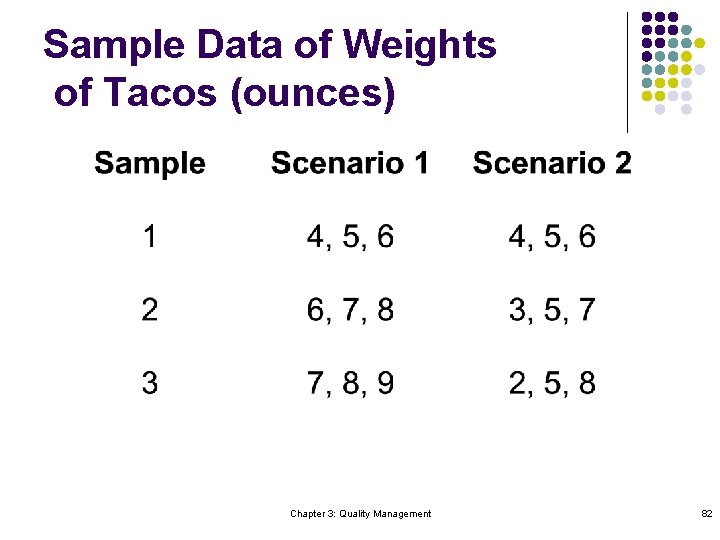
Sample Data of Weights of Tacos (ounces) Chapter 3: Quality Management 82
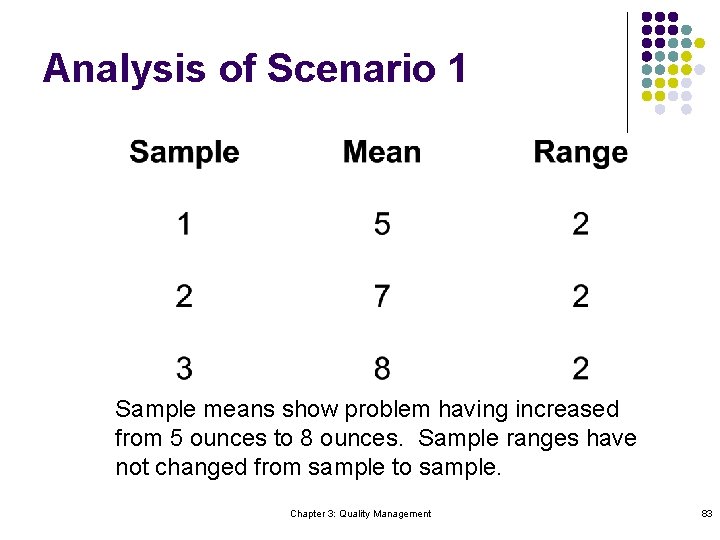
Analysis of Scenario 1 Sample means show problem having increased from 5 ounces to 8 ounces. Sample ranges have not changed from sample to sample. Chapter 3: Quality Management 83
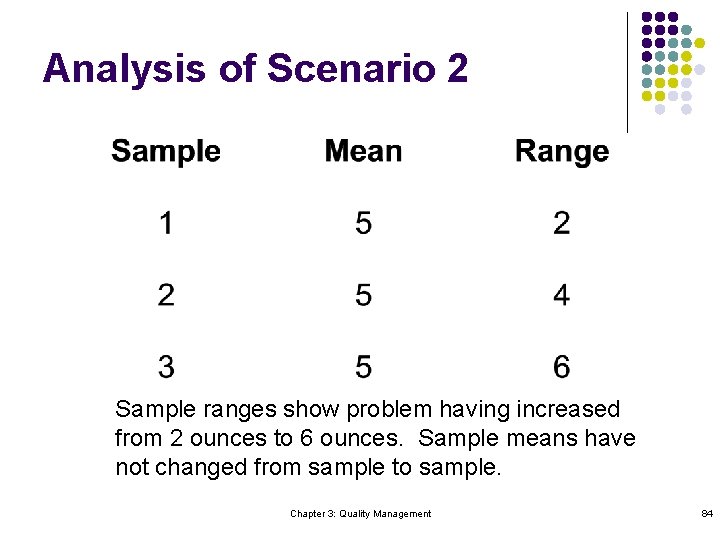
Analysis of Scenario 2 Sample ranges show problem having increased from 2 ounces to 6 ounces. Sample means have not changed from sample to sample. Chapter 3: Quality Management 84
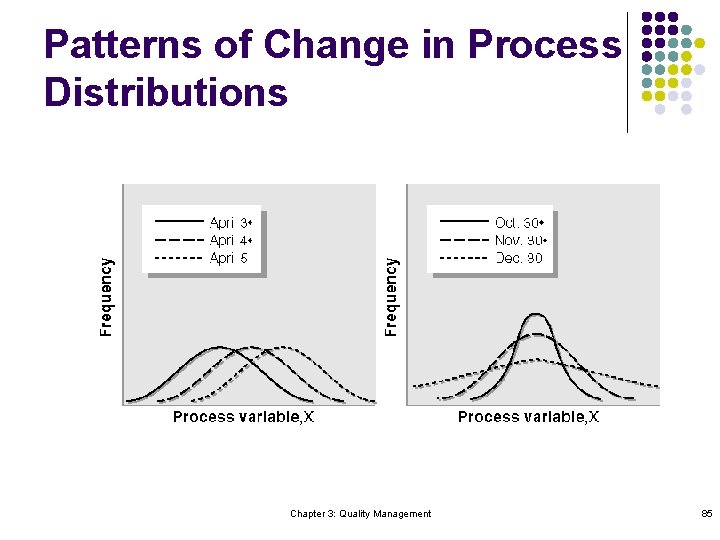
Patterns of Change in Process Distributions Chapter 3: Quality Management 85
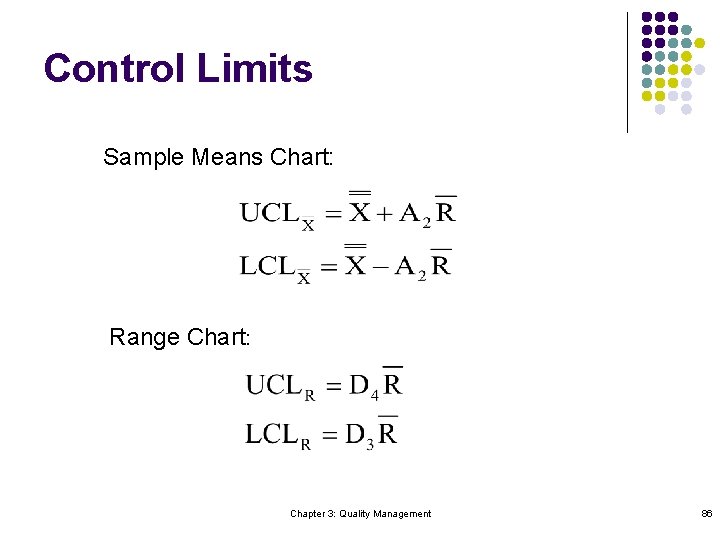
Control Limits Sample Means Chart: Range Chart: Chapter 3: Quality Management 86
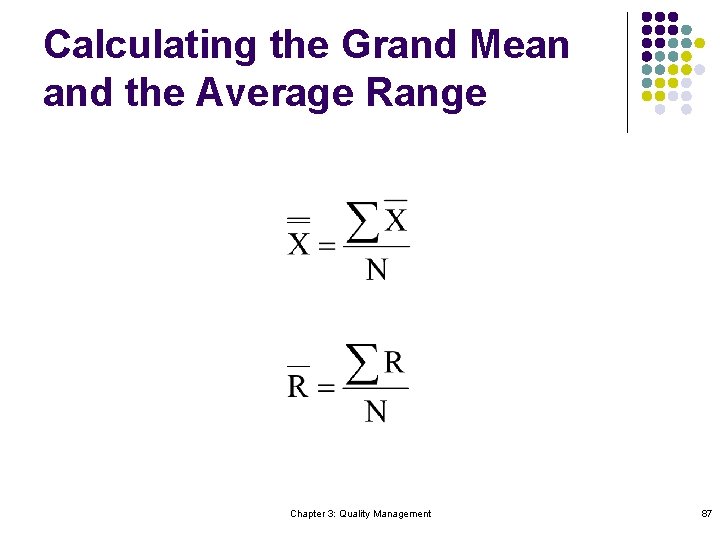
Calculating the Grand Mean and the Average Range Chapter 3: Quality Management 87
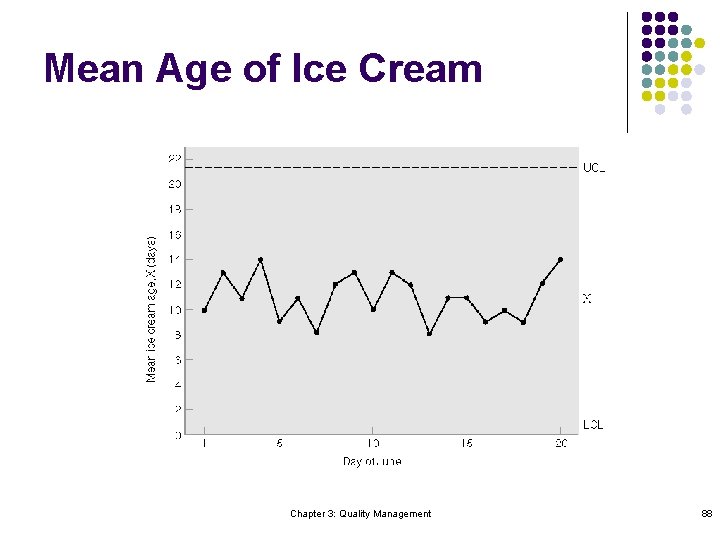
Mean Age of Ice Cream Chapter 3: Quality Management 88
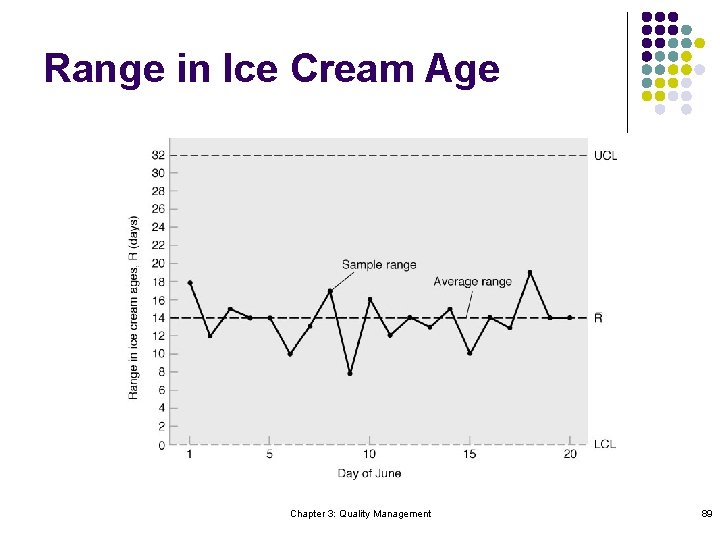
Range in Ice Cream Age Chapter 3: Quality Management 89
Control Charts for Attributes Chapter 3: Quality Management 90
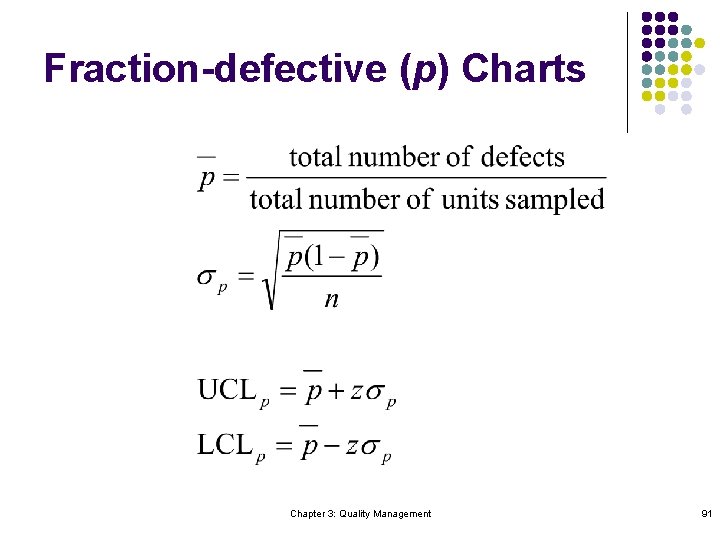
Fraction-defective (p) Charts Chapter 3: Quality Management 91
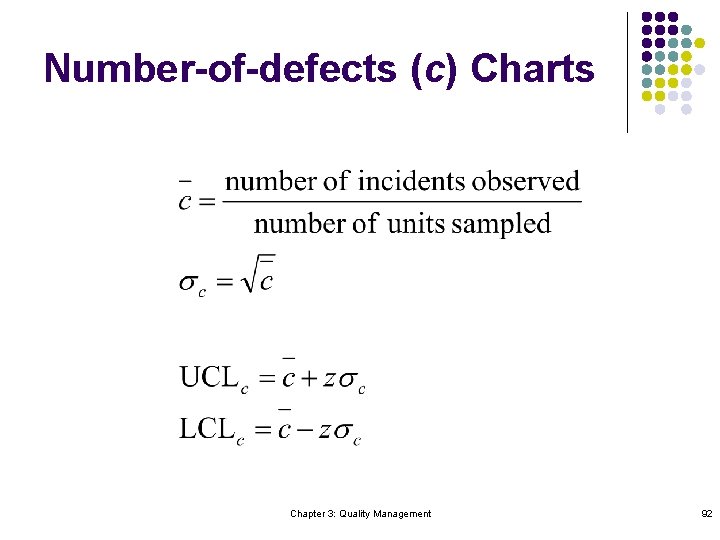
Number-of-defects (c) Charts Chapter 3: Quality Management 92
- Slides: 92