Chapter 3 Poverty Measuring Poverty The Headcount Index


 and Gap-squared (Severity) • For person i: • Total Poverty")
 Severity of Poverty 3 in")
: • Poverty Gap (α=1) •")
, calculate the poverty")

 -U. S. poverty income")


")
- Slides: 14
Chapter 3 Poverty
Measuring Poverty: The Headcount Index • q = Number of people with income below the poverty line (which we’ll call z) • N = Total population (the max that can be in poverty—if everyone were poor)
Advantages/Disadvantages • Easy to calculate • Just need z, q (add up how many people are in households below the poverty line), and N • Insensitive to how far below the poverty line the poor people are
The Poverty Gap (Depth) and Gap-squared (Severity) • For person i: • Total Poverty Gap: • Poverty Gap-Squared
Measuring Poverty: FGT • • Headcount Poverty Gap (Depth) Severity of Poverty 3 in One: The Foster-Greer-Thorbecke measure (ranges from 0 (no poor) to 1 (everyone’s poor with zero income))
The Three FGT Measures Derived from: • Headcount (α=0): • Poverty Gap (α=1) • Poverty Severity (α=2)
Recipe for Calculating the FGT 1. For each POOR household (yi<z), calculate the poverty gap: 2. Raise it to the α power: 3. Take the sum (Σ) of gaps across all q poor households (add ‘em up): 4. Divide by (multiply by 1 over) Nzα:
FGT: An Example
Where’s the Poverty Line? -Average developing-country z: $2/day (PPP adjusted) -U. S. poverty income for a family of 4 in 2012 was $23, 050 (15. 79/person/day)
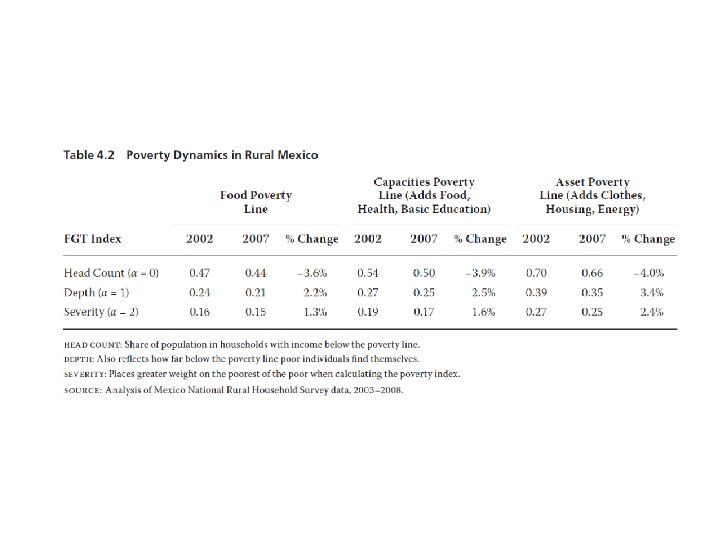
Poverty Dynamics: It’s Harder than You Think
Convex Asset Growth Curve At+1: Assets next year At: Assets this year
Convex Asset Growth Curve with Steady-state at B At+1: Assets next year At+1> At At+1= At along 45° line B At+1< At A* At: Assets this year
Non-convex Asset Growth and the Poverty Trap (Steady-states at B & 0)