
Chapter 3 Multiple Regression Analysis Estimation 2016 Cengage
- Slides: 36
Chapter 3 Multiple Regression Analysis: Estimation © 2016 Cengage Learning®. May not be scanned, copied or duplicated, or posted to a publicly accessible website, in whole or in part, except for use as permitted in a license distributed with a certain product or service or otherwise on a password-protected website or school-approved learning management system for classroom use. © kentoh/Shutterstock.
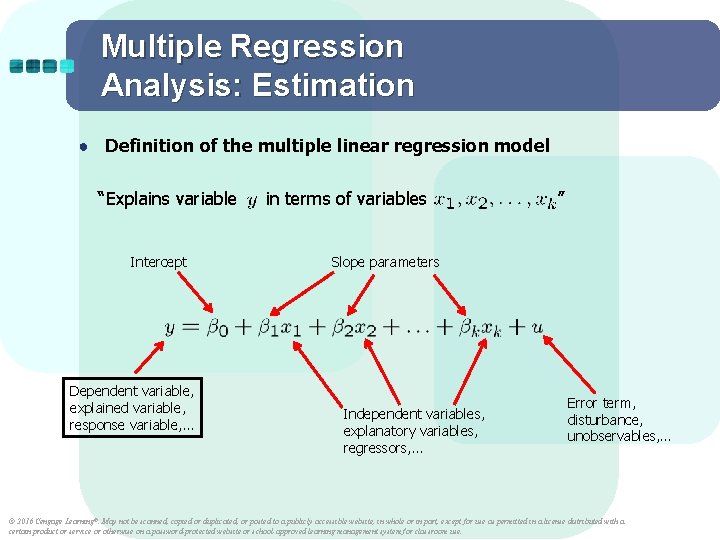
Multiple Regression Analysis: Estimation ● Definition of the multiple linear regression model “Explains variable Intercept Dependent variable, explained variable, response variable, … in terms of variables ” Slope parameters Independent variables, explanatory variables, regressors, … Error term, disturbance, unobservables, … © 2016 Cengage Learning®. May not be scanned, copied or duplicated, or posted to a publicly accessible website, in whole or in part, except for use as permitted in a license distributed with a certain product or service or otherwise on a password-protected website or school-approved learning management system for classroom use.
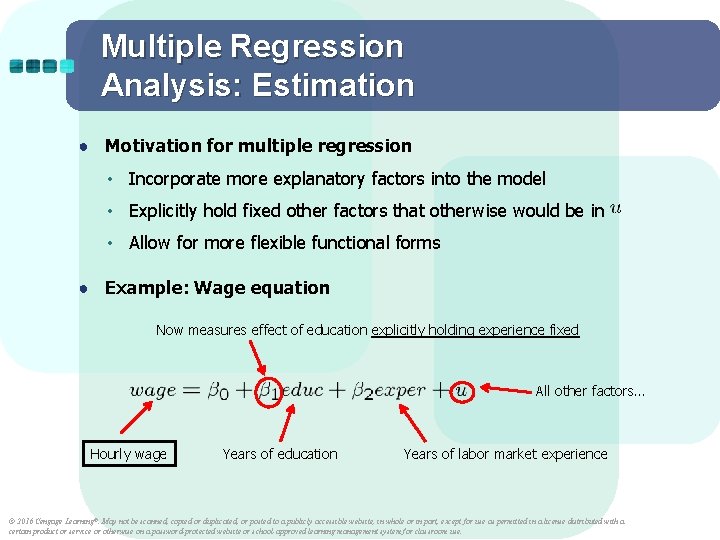
Multiple Regression Analysis: Estimation ● Motivation for multiple regression • Incorporate more explanatory factors into the model • Explicitly hold fixed other factors that otherwise would be in • Allow for more flexible functional forms ● Example: Wage equation Now measures effect of education explicitly holding experience fixed All other factors… Hourly wage Years of education Years of labor market experience © 2016 Cengage Learning®. May not be scanned, copied or duplicated, or posted to a publicly accessible website, in whole or in part, except for use as permitted in a license distributed with a certain product or service or otherwise on a password-protected website or school-approved learning management system for classroom use.
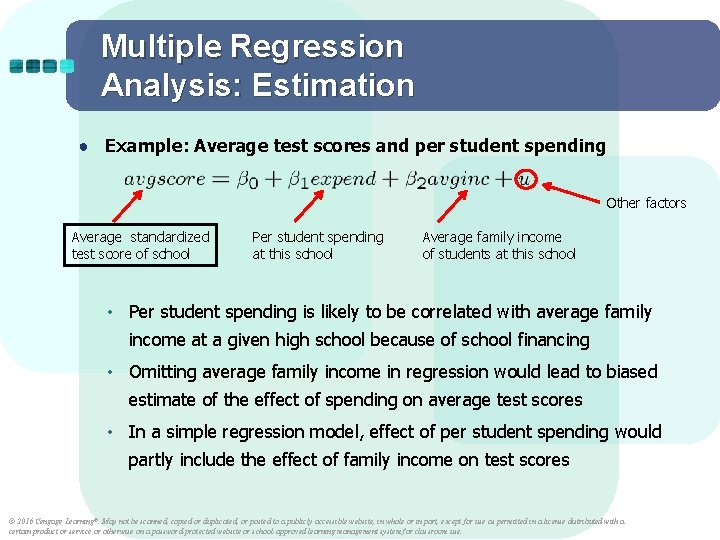
Multiple Regression Analysis: Estimation ● Example: Average test scores and per student spending Other factors Average standardized test score of school Per student spending at this school Average family income of students at this school • Per student spending is likely to be correlated with average family income at a given high school because of school financing • Omitting average family income in regression would lead to biased estimate of the effect of spending on average test scores • In a simple regression model, effect of per student spending would partly include the effect of family income on test scores © 2016 Cengage Learning®. May not be scanned, copied or duplicated, or posted to a publicly accessible website, in whole or in part, except for use as permitted in a license distributed with a certain product or service or otherwise on a password-protected website or school-approved learning management system for classroom use.
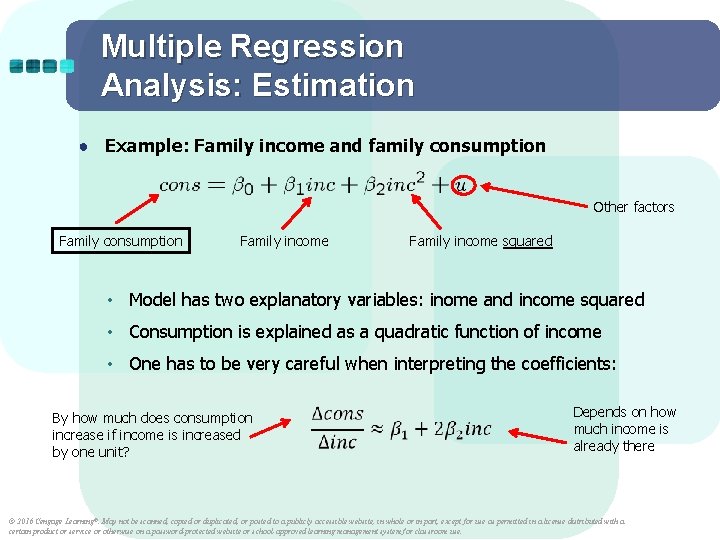
Multiple Regression Analysis: Estimation ● Example: Family income and family consumption Other factors Family consumption Family income squared • Model has two explanatory variables: inome and income squared • Consumption is explained as a quadratic function of income • One has to be very careful when interpreting the coefficients: By how much does consumption increase if income is increased by one unit? Depends on how much income is already there © 2016 Cengage Learning®. May not be scanned, copied or duplicated, or posted to a publicly accessible website, in whole or in part, except for use as permitted in a license distributed with a certain product or service or otherwise on a password-protected website or school-approved learning management system for classroom use.
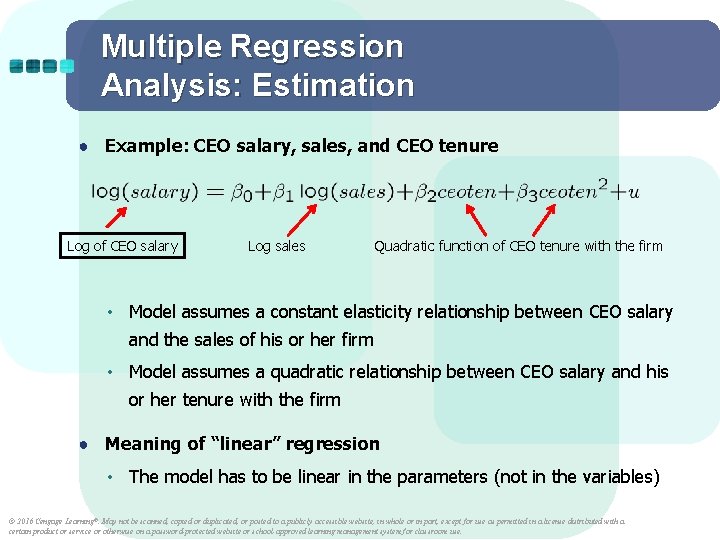
Multiple Regression Analysis: Estimation ● Example: CEO salary, sales, and CEO tenure Log of CEO salary Log sales Quadratic function of CEO tenure with the firm • Model assumes a constant elasticity relationship between CEO salary and the sales of his or her firm • Model assumes a quadratic relationship between CEO salary and his or her tenure with the firm ● Meaning of “linear” regression • The model has to be linear in the parameters (not in the variables) © 2016 Cengage Learning®. May not be scanned, copied or duplicated, or posted to a publicly accessible website, in whole or in part, except for use as permitted in a license distributed with a certain product or service or otherwise on a password-protected website or school-approved learning management system for classroom use.
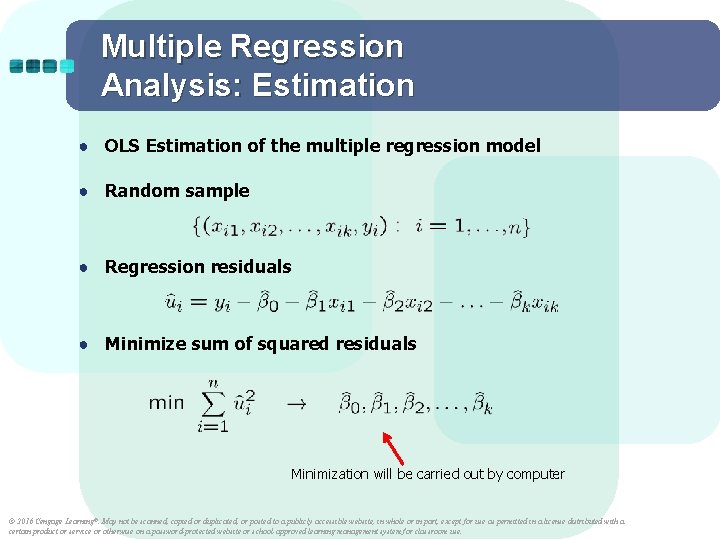
Multiple Regression Analysis: Estimation ● OLS Estimation of the multiple regression model ● Random sample ● Regression residuals ● Minimize sum of squared residuals Minimization will be carried out by computer © 2016 Cengage Learning®. May not be scanned, copied or duplicated, or posted to a publicly accessible website, in whole or in part, except for use as permitted in a license distributed with a certain product or service or otherwise on a password-protected website or school-approved learning management system for classroom use.
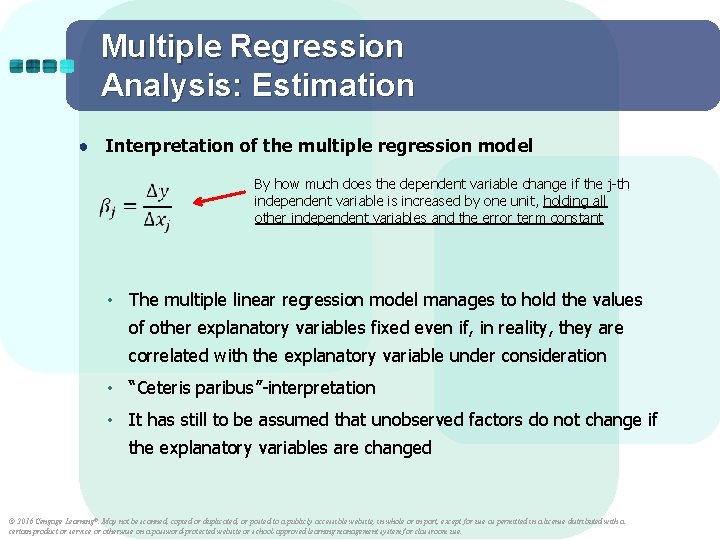
Multiple Regression Analysis: Estimation ● Interpretation of the multiple regression model By how much does the dependent variable change if the j-th independent variable is increased by one unit, holding all other independent variables and the error term constant • The multiple linear regression model manages to hold the values of other explanatory variables fixed even if, in reality, they are correlated with the explanatory variable under consideration • “Ceteris paribus”-interpretation • It has still to be assumed that unobserved factors do not change if the explanatory variables are changed © 2016 Cengage Learning®. May not be scanned, copied or duplicated, or posted to a publicly accessible website, in whole or in part, except for use as permitted in a license distributed with a certain product or service or otherwise on a password-protected website or school-approved learning management system for classroom use.
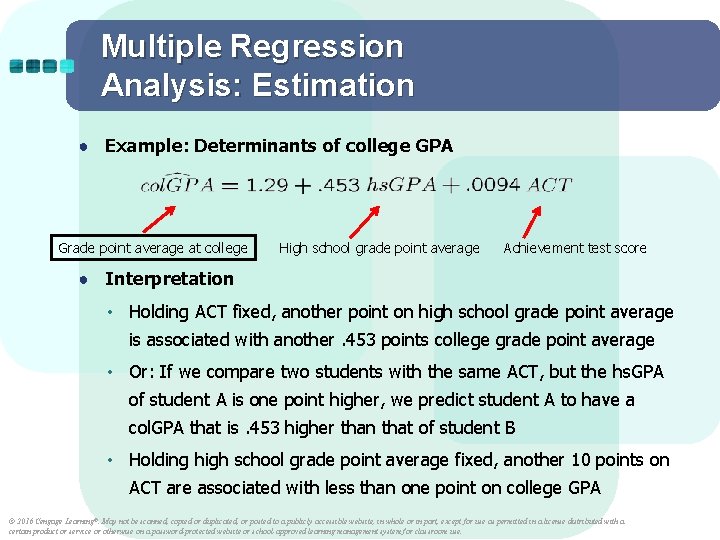
Multiple Regression Analysis: Estimation ● Example: Determinants of college GPA Grade point average at college High school grade point average Achievement test score ● Interpretation • Holding ACT fixed, another point on high school grade point average is associated with another. 453 points college grade point average • Or: If we compare two students with the same ACT, but the hs. GPA of student A is one point higher, we predict student A to have a col. GPA that is. 453 higher than that of student B • Holding high school grade point average fixed, another 10 points on ACT are associated with less than one point on college GPA © 2016 Cengage Learning®. May not be scanned, copied or duplicated, or posted to a publicly accessible website, in whole or in part, except for use as permitted in a license distributed with a certain product or service or otherwise on a password-protected website or school-approved learning management system for classroom use.
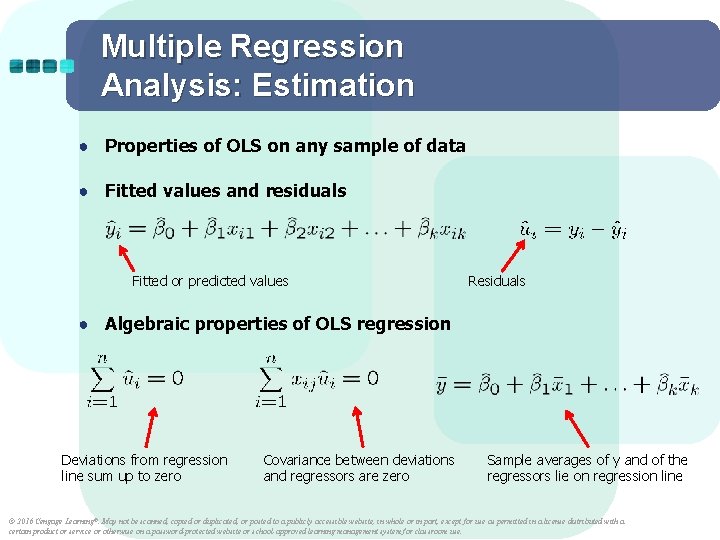
Multiple Regression Analysis: Estimation ● Properties of OLS on any sample of data ● Fitted values and residuals Fitted or predicted values Residuals ● Algebraic properties of OLS regression Deviations from regression line sum up to zero Covariance between deviations and regressors are zero Sample averages of y and of the regressors lie on regression line © 2016 Cengage Learning®. May not be scanned, copied or duplicated, or posted to a publicly accessible website, in whole or in part, except for use as permitted in a license distributed with a certain product or service or otherwise on a password-protected website or school-approved learning management system for classroom use.
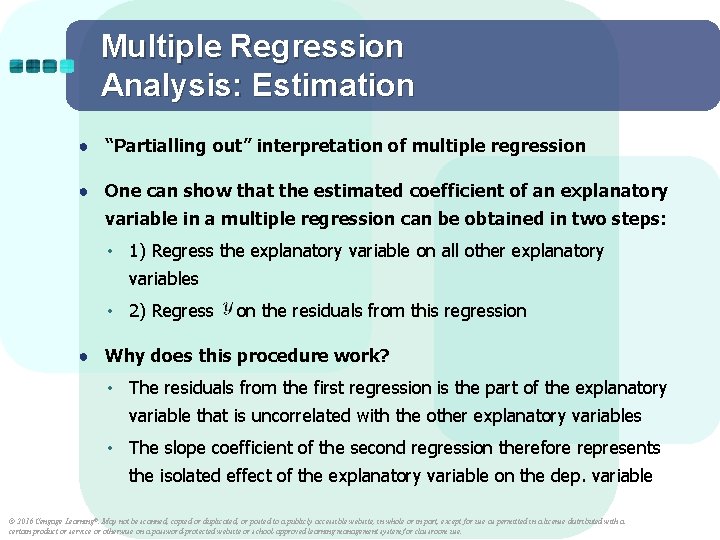
Multiple Regression Analysis: Estimation ● “Partialling out” interpretation of multiple regression ● One can show that the estimated coefficient of an explanatory variable in a multiple regression can be obtained in two steps: • 1) Regress the explanatory variable on all other explanatory variables • 2) Regress on the residuals from this regression ● Why does this procedure work? • The residuals from the first regression is the part of the explanatory variable that is uncorrelated with the other explanatory variables • The slope coefficient of the second regression therefore represents the isolated effect of the explanatory variable on the dep. variable © 2016 Cengage Learning®. May not be scanned, copied or duplicated, or posted to a publicly accessible website, in whole or in part, except for use as permitted in a license distributed with a certain product or service or otherwise on a password-protected website or school-approved learning management system for classroom use.
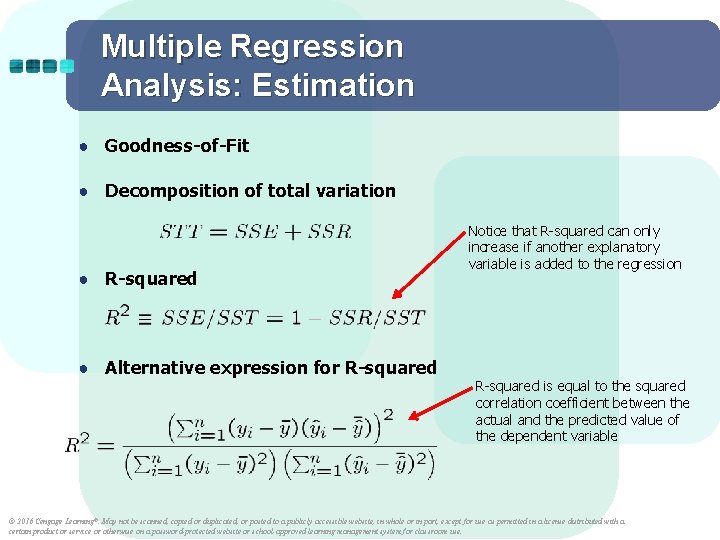
Multiple Regression Analysis: Estimation ● Goodness-of-Fit ● Decomposition of total variation ● R-squared ● Alternative expression for R-squared Notice that R-squared can only increase if another explanatory variable is added to the regression R-squared is equal to the squared correlation coefficient between the actual and the predicted value of the dependent variable © 2016 Cengage Learning®. May not be scanned, copied or duplicated, or posted to a publicly accessible website, in whole or in part, except for use as permitted in a license distributed with a certain product or service or otherwise on a password-protected website or school-approved learning management system for classroom use.
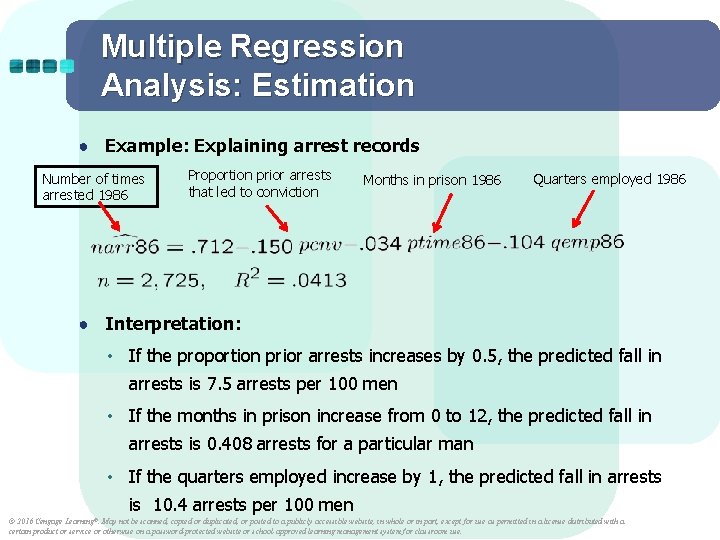
Multiple Regression Analysis: Estimation ● Example: Explaining arrest records Number of times arrested 1986 Proportion prior arrests that led to conviction Months in prison 1986 Quarters employed 1986 ● Interpretation: • If the proportion prior arrests increases by 0. 5, the predicted fall in arrests is 7. 5 arrests per 100 men • If the months in prison increase from 0 to 12, the predicted fall in arrests is 0. 408 arrests for a particular man • If the quarters employed increase by 1, the predicted fall in arrests is 10. 4 arrests per 100 men Learning®. © 2016 Cengage May not be scanned, copied or duplicated, or posted to a publicly accessible website, in whole or in part, except for use as permitted in a license distributed with a certain product or service or otherwise on a password-protected website or school-approved learning management system for classroom use.
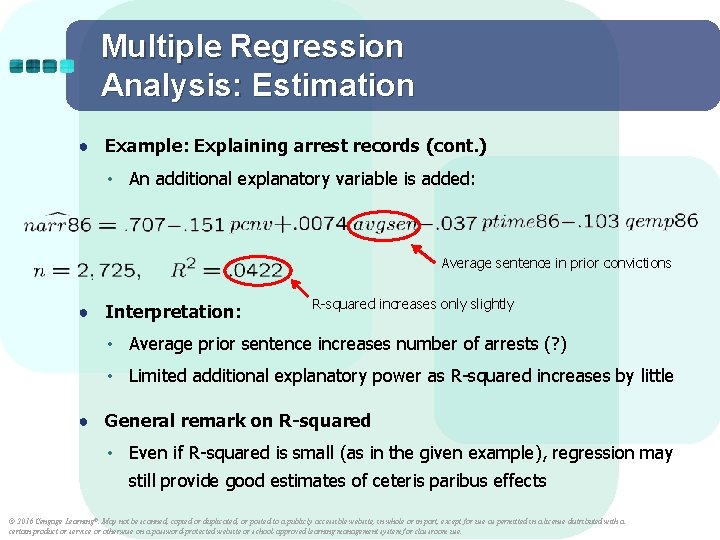
Multiple Regression Analysis: Estimation ● Example: Explaining arrest records (cont. ) • An additional explanatory variable is added: Average sentence in prior convictions ● Interpretation: R-squared increases only slightly • Average prior sentence increases number of arrests (? ) • Limited additional explanatory power as R-squared increases by little ● General remark on R-squared • Even if R-squared is small (as in the given example), regression may still provide good estimates of ceteris paribus effects © 2016 Cengage Learning®. May not be scanned, copied or duplicated, or posted to a publicly accessible website, in whole or in part, except for use as permitted in a license distributed with a certain product or service or otherwise on a password-protected website or school-approved learning management system for classroom use.
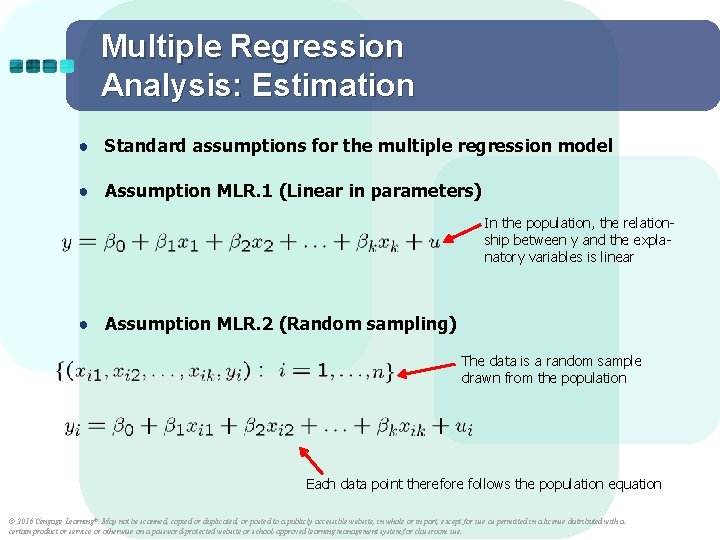
Multiple Regression Analysis: Estimation ● Standard assumptions for the multiple regression model ● Assumption MLR. 1 (Linear in parameters) In the population, the relationship between y and the explanatory variables is linear ● Assumption MLR. 2 (Random sampling) The data is a random sample drawn from the population Each data point therefore follows the population equation © 2016 Cengage Learning®. May not be scanned, copied or duplicated, or posted to a publicly accessible website, in whole or in part, except for use as permitted in a license distributed with a certain product or service or otherwise on a password-protected website or school-approved learning management system for classroom use.
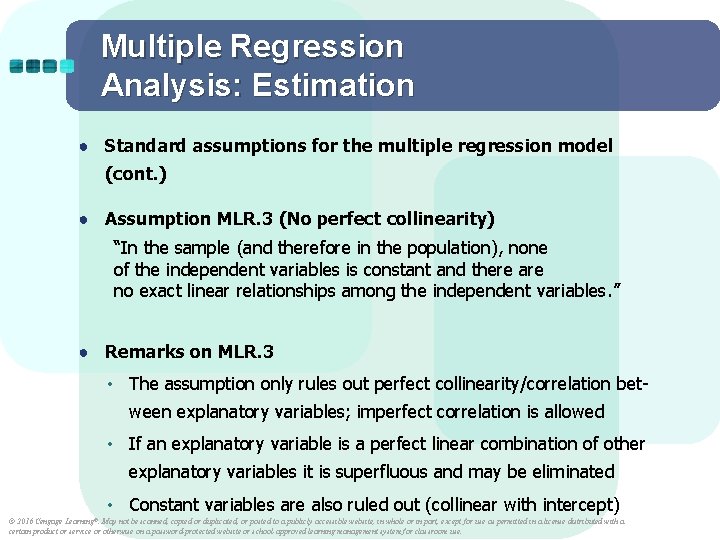
Multiple Regression Analysis: Estimation ● Standard assumptions for the multiple regression model (cont. ) ● Assumption MLR. 3 (No perfect collinearity) “In the sample (and therefore in the population), none of the independent variables is constant and there are no exact linear relationships among the independent variables. ” ● Remarks on MLR. 3 • The assumption only rules out perfect collinearity/correlation between explanatory variables; imperfect correlation is allowed • If an explanatory variable is a perfect linear combination of other explanatory variables it is superfluous and may be eliminated • Constant variables are also ruled out (collinear with intercept) Learning®. © 2016 Cengage May not be scanned, copied or duplicated, or posted to a publicly accessible website, in whole or in part, except for use as permitted in a license distributed with a certain product or service or otherwise on a password-protected website or school-approved learning management system for classroom use.
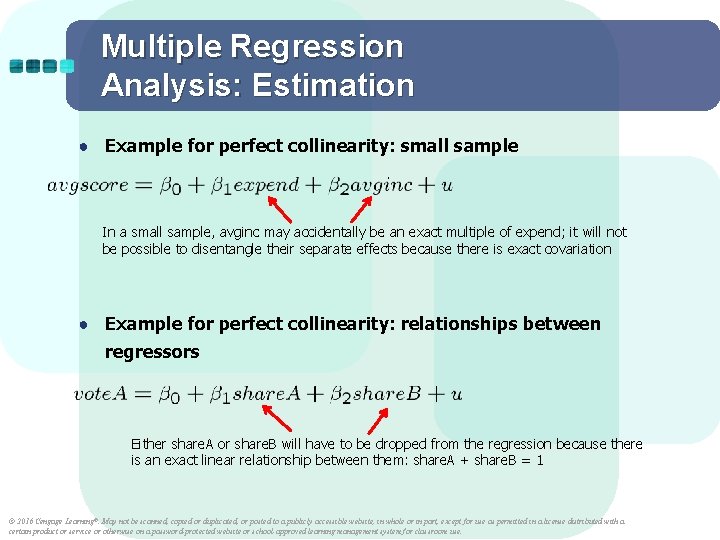
Multiple Regression Analysis: Estimation ● Example for perfect collinearity: small sample In a small sample, avginc may accidentally be an exact multiple of expend; it will not be possible to disentangle their separate effects because there is exact covariation ● Example for perfect collinearity: relationships between regressors Either share. A or share. B will have to be dropped from the regression because there is an exact linear relationship between them: share. A + share. B = 1 © 2016 Cengage Learning®. May not be scanned, copied or duplicated, or posted to a publicly accessible website, in whole or in part, except for use as permitted in a license distributed with a certain product or service or otherwise on a password-protected website or school-approved learning management system for classroom use.
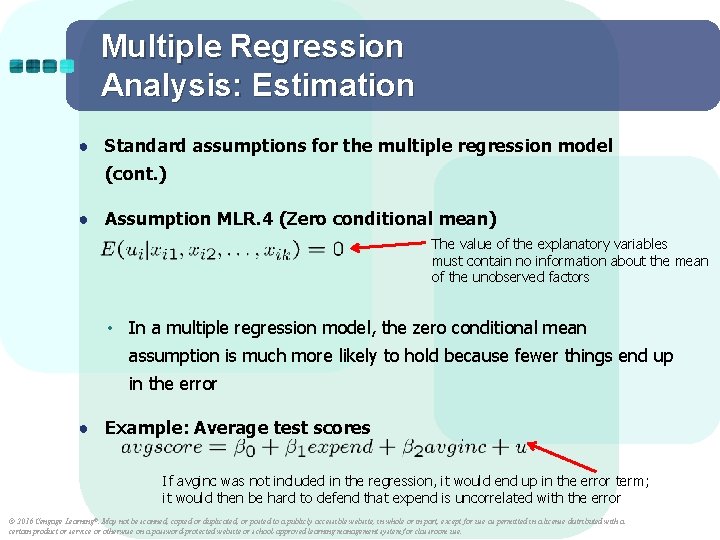
Multiple Regression Analysis: Estimation ● Standard assumptions for the multiple regression model (cont. ) ● Assumption MLR. 4 (Zero conditional mean) The value of the explanatory variables must contain no information about the mean of the unobserved factors • In a multiple regression model, the zero conditional mean assumption is much more likely to hold because fewer things end up in the error ● Example: Average test scores If avginc was not included in the regression, it would end up in the error term; it would then be hard to defend that expend is uncorrelated with the error © 2016 Cengage Learning®. May not be scanned, copied or duplicated, or posted to a publicly accessible website, in whole or in part, except for use as permitted in a license distributed with a certain product or service or otherwise on a password-protected website or school-approved learning management system for classroom use.
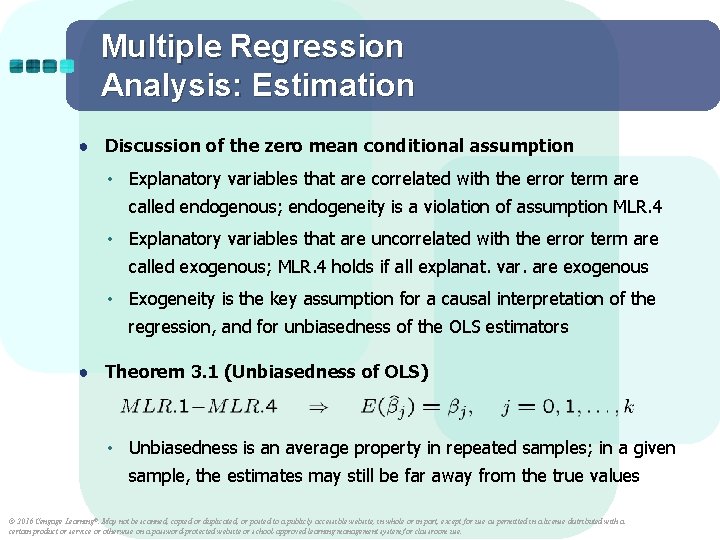
Multiple Regression Analysis: Estimation ● Discussion of the zero mean conditional assumption • Explanatory variables that are correlated with the error term are called endogenous; endogeneity is a violation of assumption MLR. 4 • Explanatory variables that are uncorrelated with the error term are called exogenous; MLR. 4 holds if all explanat. var. are exogenous • Exogeneity is the key assumption for a causal interpretation of the regression, and for unbiasedness of the OLS estimators ● Theorem 3. 1 (Unbiasedness of OLS) • Unbiasedness is an average property in repeated samples; in a given sample, the estimates may still be far away from the true values © 2016 Cengage Learning®. May not be scanned, copied or duplicated, or posted to a publicly accessible website, in whole or in part, except for use as permitted in a license distributed with a certain product or service or otherwise on a password-protected website or school-approved learning management system for classroom use.
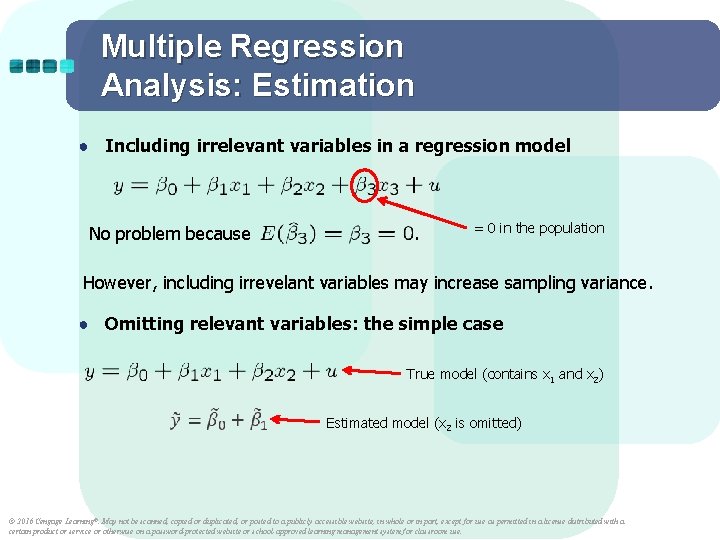
Multiple Regression Analysis: Estimation ● Including irrelevant variables in a regression model No problem because . = 0 in the population However, including irrevelant variables may increase sampling variance. ● Omitting relevant variables: the simple case True model (contains x 1 and x 2) Estimated model (x 2 is omitted) © 2016 Cengage Learning®. May not be scanned, copied or duplicated, or posted to a publicly accessible website, in whole or in part, except for use as permitted in a license distributed with a certain product or service or otherwise on a password-protected website or school-approved learning management system for classroom use.
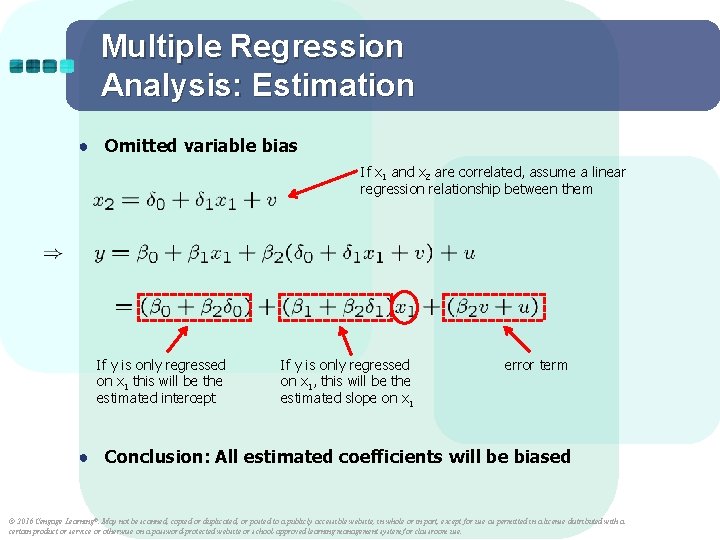
Multiple Regression Analysis: Estimation ● Omitted variable bias If x 1 and x 2 are correlated, assume a linear regression relationship between them If y is only regressed on x 1 this will be the estimated intercept If y is only regressed on x 1, this will be the estimated slope on x 1 error term ● Conclusion: All estimated coefficients will be biased © 2016 Cengage Learning®. May not be scanned, copied or duplicated, or posted to a publicly accessible website, in whole or in part, except for use as permitted in a license distributed with a certain product or service or otherwise on a password-protected website or school-approved learning management system for classroom use.
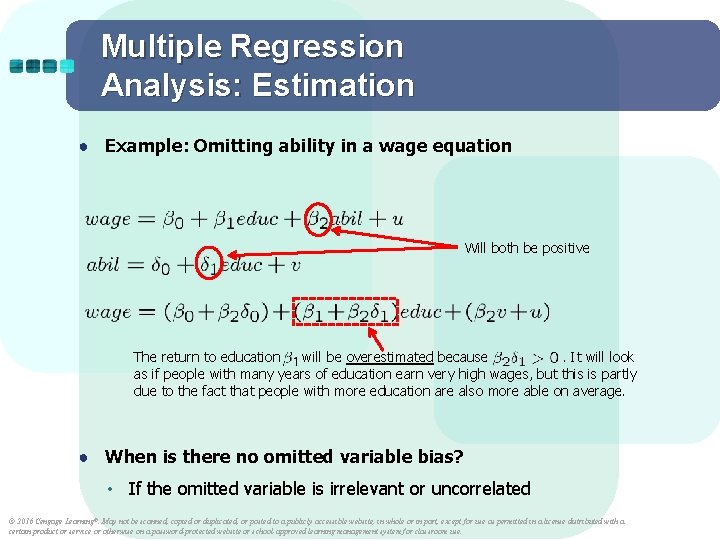
Multiple Regression Analysis: Estimation ● Example: Omitting ability in a wage equation Will both be positive The return to education will be overestimated because. It will look as if people with many years of education earn very high wages, but this is partly due to the fact that people with more education are also more able on average. ● When is there no omitted variable bias? • If the omitted variable is irrelevant or uncorrelated © 2016 Cengage Learning®. May not be scanned, copied or duplicated, or posted to a publicly accessible website, in whole or in part, except for use as permitted in a license distributed with a certain product or service or otherwise on a password-protected website or school-approved learning management system for classroom use.
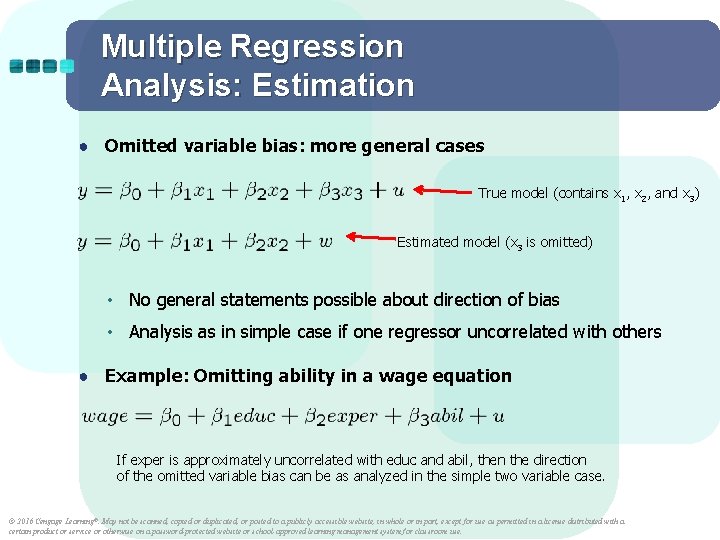
Multiple Regression Analysis: Estimation ● Omitted variable bias: more general cases True model (contains x 1, x 2, and x 3) Estimated model (x 3 is omitted) • No general statements possible about direction of bias • Analysis as in simple case if one regressor uncorrelated with others ● Example: Omitting ability in a wage equation If exper is approximately uncorrelated with educ and abil, then the direction of the omitted variable bias can be as analyzed in the simple two variable case. © 2016 Cengage Learning®. May not be scanned, copied or duplicated, or posted to a publicly accessible website, in whole or in part, except for use as permitted in a license distributed with a certain product or service or otherwise on a password-protected website or school-approved learning management system for classroom use.
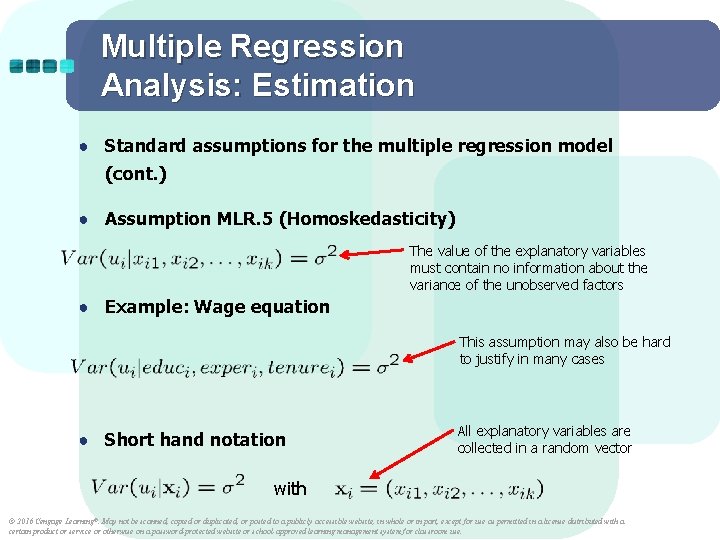
Multiple Regression Analysis: Estimation ● Standard assumptions for the multiple regression model (cont. ) ● Assumption MLR. 5 (Homoskedasticity) The value of the explanatory variables must contain no information about the variance of the unobserved factors ● Example: Wage equation This assumption may also be hard to justify in many cases ● Short hand notation All explanatory variables are collected in a random vector with © 2016 Cengage Learning®. May not be scanned, copied or duplicated, or posted to a publicly accessible website, in whole or in part, except for use as permitted in a license distributed with a certain product or service or otherwise on a password-protected website or school-approved learning management system for classroom use.
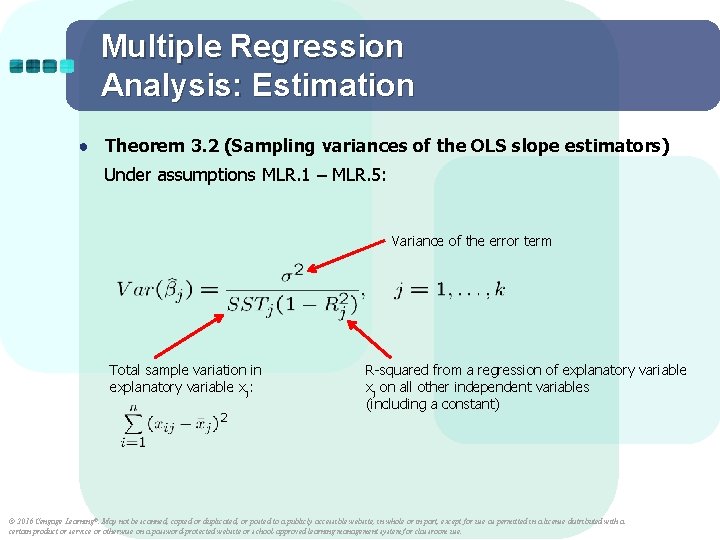
Multiple Regression Analysis: Estimation ● Theorem 3. 2 (Sampling variances of the OLS slope estimators) Under assumptions MLR. 1 – MLR. 5: Variance of the error term Total sample variation in explanatory variable xj: R-squared from a regression of explanatory variable xj on all other independent variables (including a constant) © 2016 Cengage Learning®. May not be scanned, copied or duplicated, or posted to a publicly accessible website, in whole or in part, except for use as permitted in a license distributed with a certain product or service or otherwise on a password-protected website or school-approved learning management system for classroom use.
Multiple Regression Analysis: Estimation ● Components of OLS Variances: ● 1) The error variance • A high error variance increases the sampling variance because there is more “noise” in the equation • A large error variance necessarily makes estimates imprecise • The error variance does not decrease with sample size ● 2) The total sample variation in the explanatory variable • More sample variation leads to more precise estimates • Total sample variation automatically increases with the sample size • Increasing the sample size is thus a way to get more precise estimates © 2016 Cengage Learning®. May not be scanned, copied or duplicated, or posted to a publicly accessible website, in whole or in part, except for use as permitted in a license distributed with a certain product or service or otherwise on a password-protected website or school-approved learning management system for classroom use.
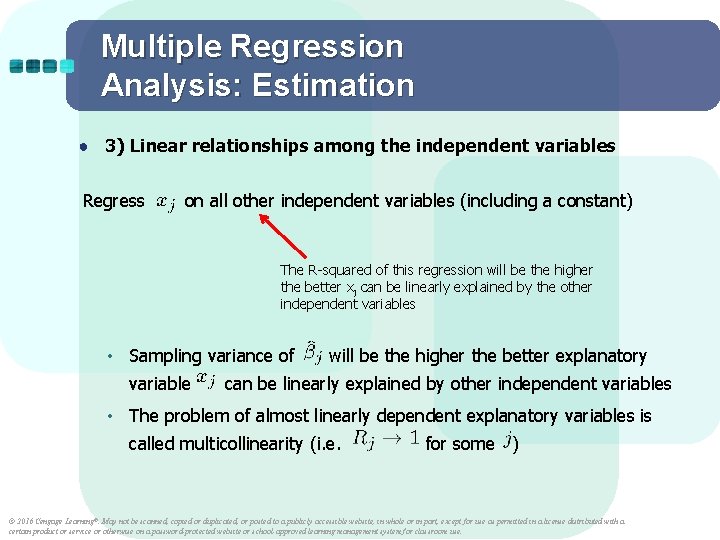
Multiple Regression Analysis: Estimation ● 3) Linear relationships among the independent variables Regress on all other independent variables (including a constant) The R-squared of this regression will be the higher the better xj can be linearly explained by the other independent variables • Sampling variance of variable will be the higher the better explanatory can be linearly explained by other independent variables • The problem of almost linearly dependent explanatory variables is called multicollinearity (i. e. for some ) © 2016 Cengage Learning®. May not be scanned, copied or duplicated, or posted to a publicly accessible website, in whole or in part, except for use as permitted in a license distributed with a certain product or service or otherwise on a password-protected website or school-approved learning management system for classroom use.
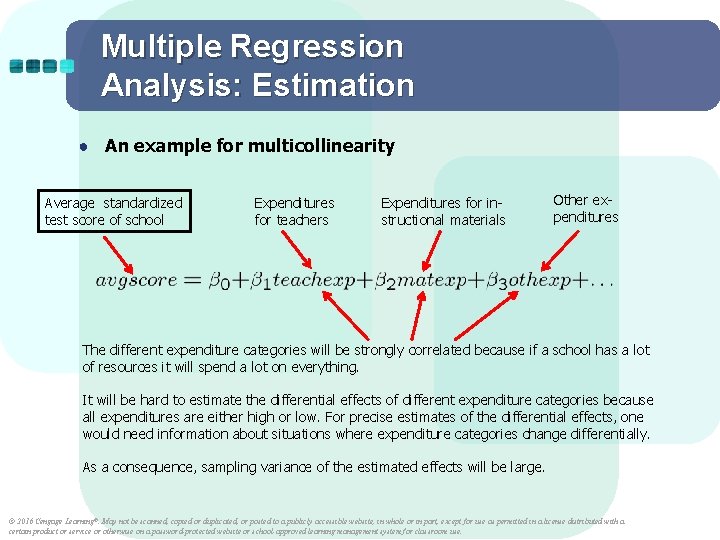
Multiple Regression Analysis: Estimation ● An example for multicollinearity Average standardized test score of school Expenditures for teachers Expenditures for instructional materials Other expenditures The different expenditure categories will be strongly correlated because if a school has a lot of resources it will spend a lot on everything. It will be hard to estimate the differential effects of different expenditure categories because all expenditures are either high or low. For precise estimates of the differential effects, one would need information about situations where expenditure categories change differentially. As a consequence, sampling variance of the estimated effects will be large. © 2016 Cengage Learning®. May not be scanned, copied or duplicated, or posted to a publicly accessible website, in whole or in part, except for use as permitted in a license distributed with a certain product or service or otherwise on a password-protected website or school-approved learning management system for classroom use.
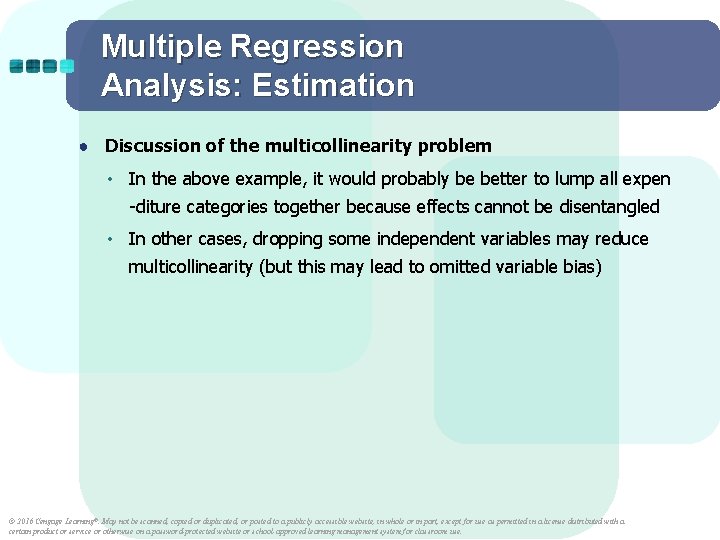
Multiple Regression Analysis: Estimation ● Discussion of the multicollinearity problem • In the above example, it would probably be better to lump all expen -diture categories together because effects cannot be disentangled • In other cases, dropping some independent variables may reduce multicollinearity (but this may lead to omitted variable bias) © 2016 Cengage Learning®. May not be scanned, copied or duplicated, or posted to a publicly accessible website, in whole or in part, except for use as permitted in a license distributed with a certain product or service or otherwise on a password-protected website or school-approved learning management system for classroom use.
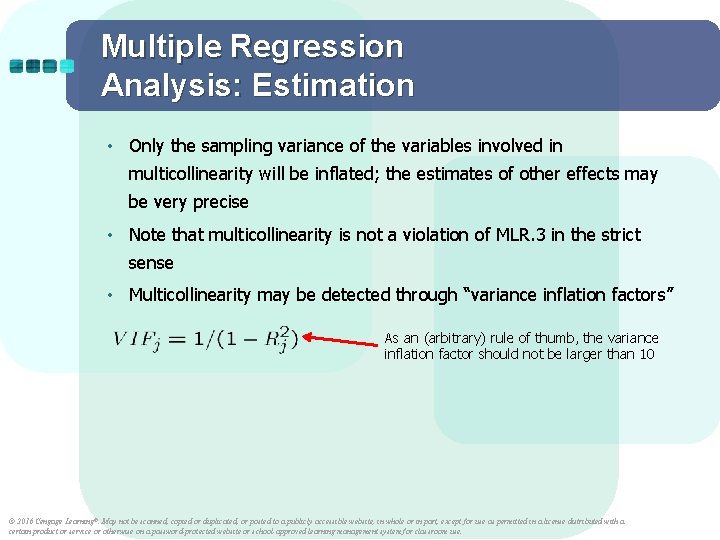
Multiple Regression Analysis: Estimation • Only the sampling variance of the variables involved in multicollinearity will be inflated; the estimates of other effects may be very precise • Note that multicollinearity is not a violation of MLR. 3 in the strict sense • Multicollinearity may be detected through “variance inflation factors” As an (arbitrary) rule of thumb, the variance inflation factor should not be larger than 10 © 2016 Cengage Learning®. May not be scanned, copied or duplicated, or posted to a publicly accessible website, in whole or in part, except for use as permitted in a license distributed with a certain product or service or otherwise on a password-protected website or school-approved learning management system for classroom use.
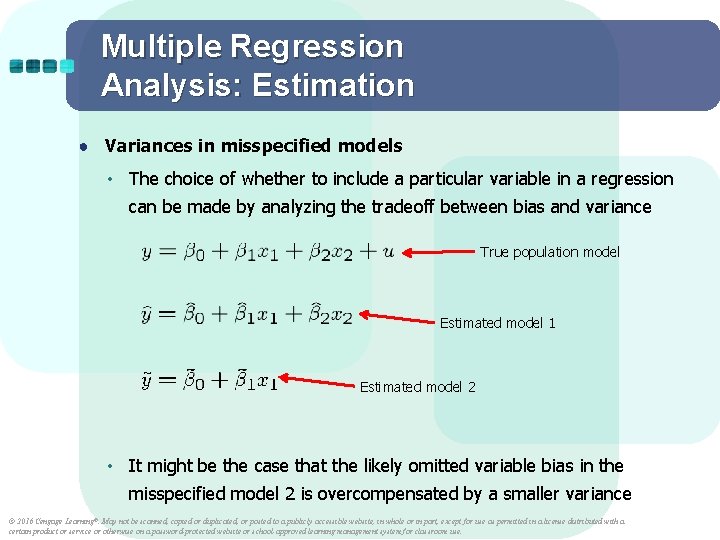
Multiple Regression Analysis: Estimation ● Variances in misspecified models • The choice of whether to include a particular variable in a regression can be made by analyzing the tradeoff between bias and variance True population model Estimated model 1 Estimated model 2 • It might be the case that the likely omitted variable bias in the misspecified model 2 is overcompensated by a smaller variance © 2016 Cengage Learning®. May not be scanned, copied or duplicated, or posted to a publicly accessible website, in whole or in part, except for use as permitted in a license distributed with a certain product or service or otherwise on a password-protected website or school-approved learning management system for classroom use.
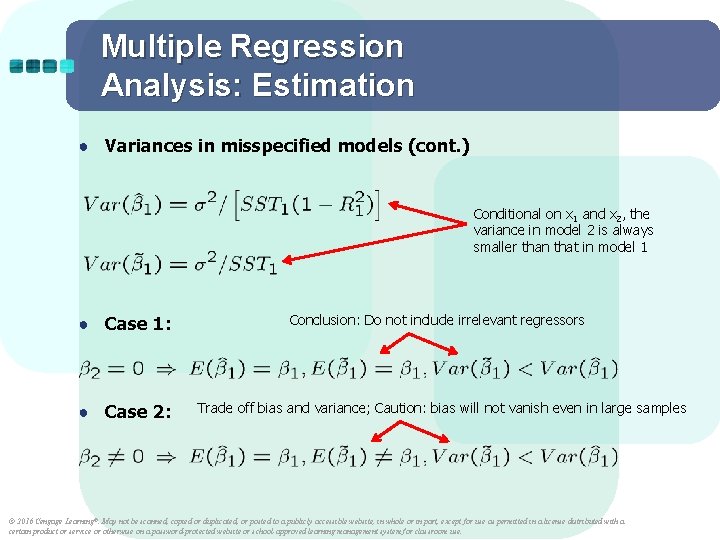
Multiple Regression Analysis: Estimation ● Variances in misspecified models (cont. ) Conditional on x 1 and x 2, the variance in model 2 is always smaller than that in model 1 ● Case 1: ● Case 2: Conclusion: Do not include irrelevant regressors Trade off bias and variance; Caution: bias will not vanish even in large samples © 2016 Cengage Learning®. May not be scanned, copied or duplicated, or posted to a publicly accessible website, in whole or in part, except for use as permitted in a license distributed with a certain product or service or otherwise on a password-protected website or school-approved learning management system for classroom use.
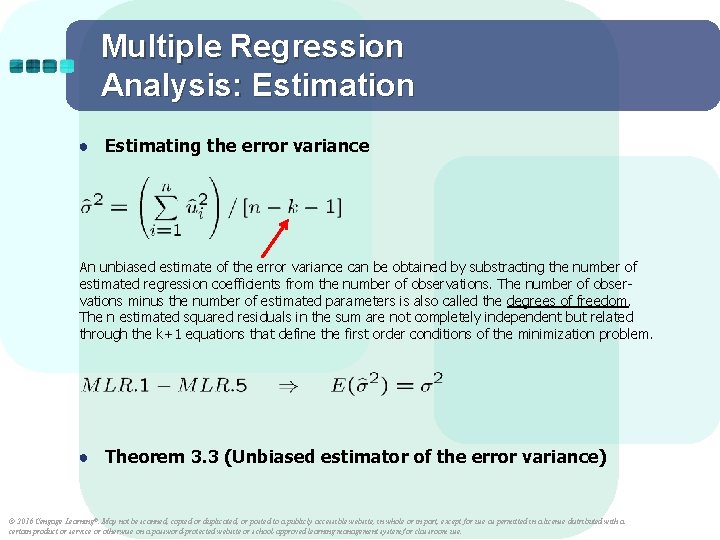
Multiple Regression Analysis: Estimation ● Estimating the error variance An unbiased estimate of the error variance can be obtained by substracting the number of estimated regression coefficients from the number of observations. The number of observations minus the number of estimated parameters is also called the degrees of freedom. The n estimated squared residuals in the sum are not completely independent but related through the k+1 equations that define the first order conditions of the minimization problem. ● Theorem 3. 3 (Unbiased estimator of the error variance) © 2016 Cengage Learning®. May not be scanned, copied or duplicated, or posted to a publicly accessible website, in whole or in part, except for use as permitted in a license distributed with a certain product or service or otherwise on a password-protected website or school-approved learning management system for classroom use.
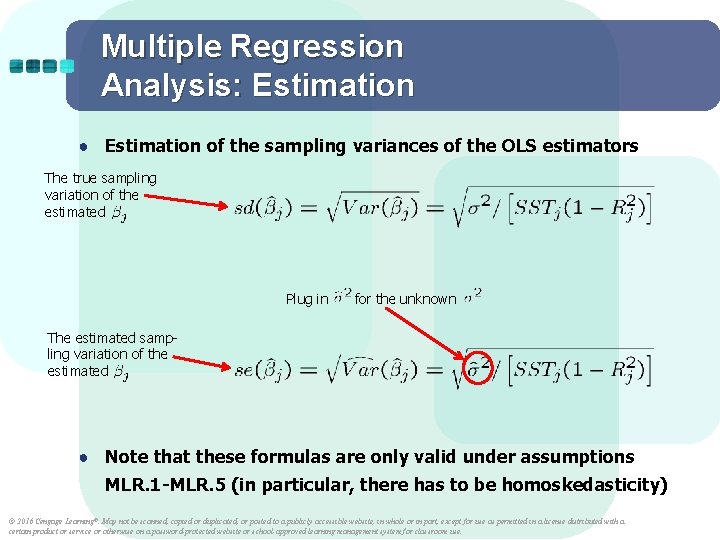
Multiple Regression Analysis: Estimation ● Estimation of the sampling variances of the OLS estimators The true sampling variation of the estimated Plug in for the unknown The estimated sampling variation of the estimated ● Note that these formulas are only valid under assumptions MLR. 1 -MLR. 5 (in particular, there has to be homoskedasticity) © 2016 Cengage Learning®. May not be scanned, copied or duplicated, or posted to a publicly accessible website, in whole or in part, except for use as permitted in a license distributed with a certain product or service or otherwise on a password-protected website or school-approved learning management system for classroom use.
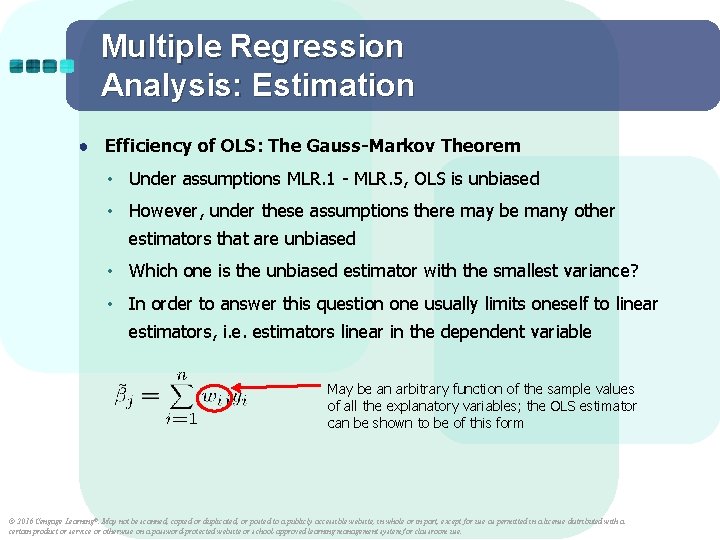
Multiple Regression Analysis: Estimation ● Efficiency of OLS: The Gauss-Markov Theorem • Under assumptions MLR. 1 - MLR. 5, OLS is unbiased • However, under these assumptions there may be many other estimators that are unbiased • Which one is the unbiased estimator with the smallest variance? • In order to answer this question one usually limits oneself to linear estimators, i. e. estimators linear in the dependent variable May be an arbitrary function of the sample values of all the explanatory variables; the OLS estimator can be shown to be of this form © 2016 Cengage Learning®. May not be scanned, copied or duplicated, or posted to a publicly accessible website, in whole or in part, except for use as permitted in a license distributed with a certain product or service or otherwise on a password-protected website or school-approved learning management system for classroom use.
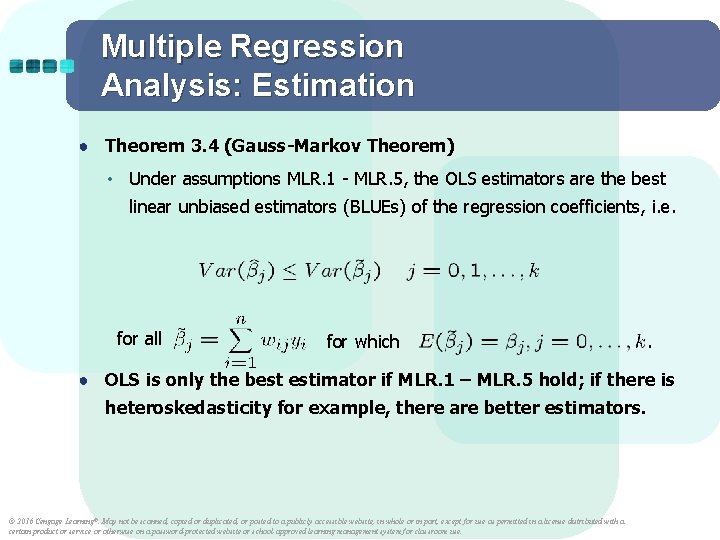
Multiple Regression Analysis: Estimation ● Theorem 3. 4 (Gauss-Markov Theorem) • Under assumptions MLR. 1 - MLR. 5, the OLS estimators are the best linear unbiased estimators (BLUEs) of the regression coefficients, i. e. for all for which . ● OLS is only the best estimator if MLR. 1 – MLR. 5 hold; if there is heteroskedasticity for example, there are better estimators. © 2016 Cengage Learning®. May not be scanned, copied or duplicated, or posted to a publicly accessible website, in whole or in part, except for use as permitted in a license distributed with a certain product or service or otherwise on a password-protected website or school-approved learning management system for classroom use.