Chapter 3 Experimental Error 3 1 Significant Figures


 Precision and")


 + (the first")


 Analyst 1 : relatively high")
 instrumental errors 2) method")

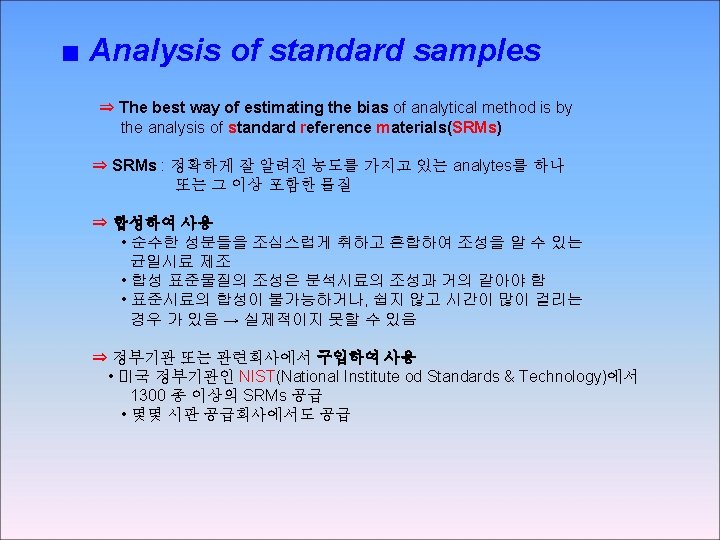


 SRMs 2670 a, 2671 a and")


 61. 06, 61. 46, 61. 55, 61. 61 →")

- Slides: 67
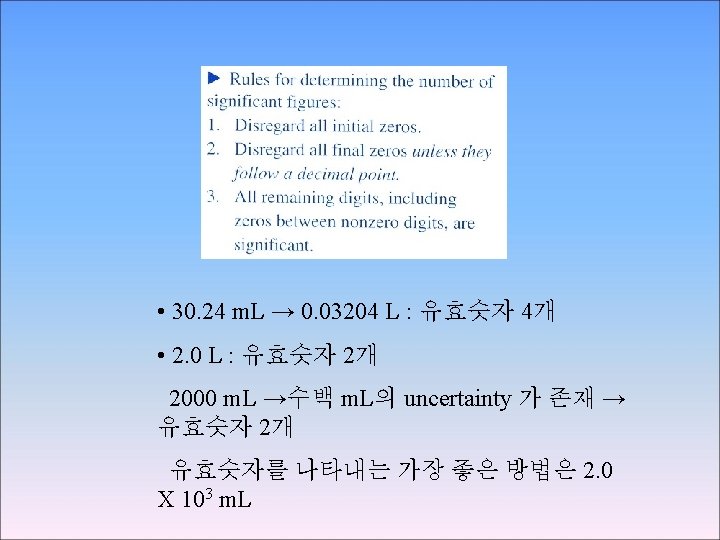
Chapter 3 Experimental Error 3 -1 Significant Figures The number of significant figures is the minimum number of digits needed to write a given value in scientific notation without loss of precision 9. 25 × 104 9. 2500 × 104 3 significant figures
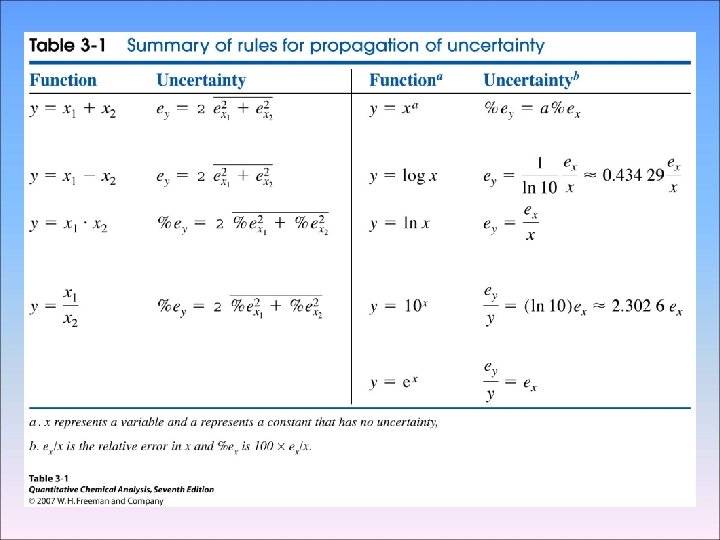
3 -2 Significant Figures in Arithmetic We now consider how many digits to retain in the answer After you have performed arithmetic operations with your data - Addition and Subtraction 1. 362 × 10 -4 + 3. 111 × 10 -4 4. 473 × 10 -4 5. 345 + 6. 728 12. 073 7. 26 × 10 14 -6. 69 × 10 14 0. 57 × 10 14 18. 9984032 (F) + 18. 9984032 (F) + 83. 789 (Kr) 121. 794 8064 1. 632 × 105 +4. 107 × 103 +0. 984 × 106 1. 632 × +0. 04107 × +9. 84 × 11. 51 × 105 105
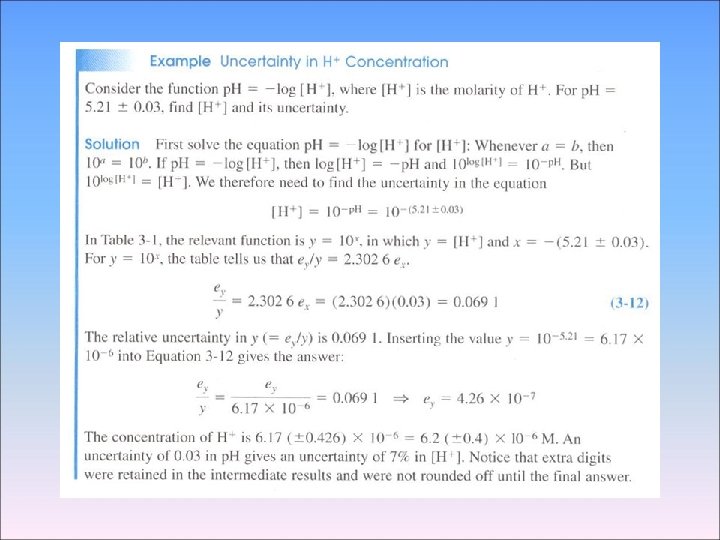
- Multiplication and Division In multiplication and division, we are normally limited to the Number of digits contained in the number with the fewest significant figures: 3. 26 × 10 -5 × 1. 78 5. 80 × 10 -5 4. 3179 × 1012 × 3. 6 × 10 -19 1. 6 × 10 -6 34. 60 ÷ 2. 46287 14. 05 - Logarithms and antilogarithms IF n = 10 a, than we say that a is the base logarithm of n :
A logarithm is composed of a characteristic and a mantissa. The characteristic is the integer part and the mantissa is the decimal part log 339=2. 530 log 3. 39× 10 -5= -4. 470 Characteristic Mantissa Characteristic Mantissa = 2 =0. 530 =-4 =0. 470 10 2. 531 =340(339. 6) 10 2. 530 =339(338. 8) 10 2. 529 =338(338. 1) antilog (-3. 42) = 10 -3. 42 = 3. 8 × 10 -4 log 0. 001237= -2. 9076 antilog 4. 37=2. 3 × 10 4 Log 1. 237= 3. 0924 10 4. 37=2. 3 × 10 4 Log 3. 2=0. 51 10 -2. 600=2. 51 × 10 -3
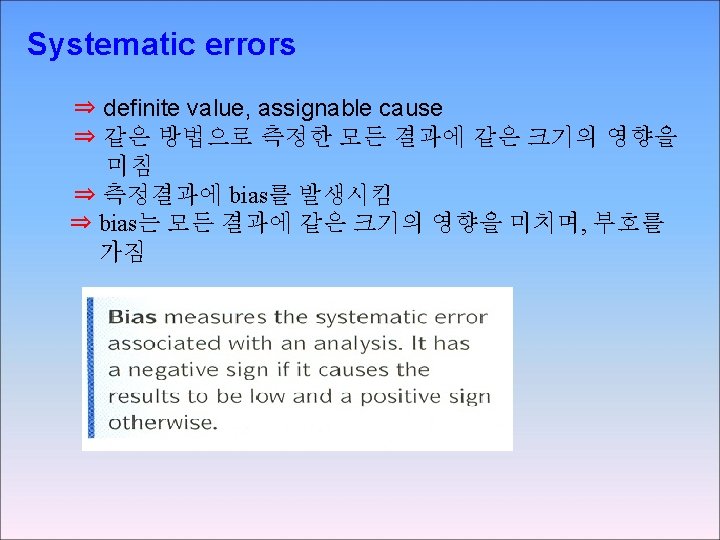
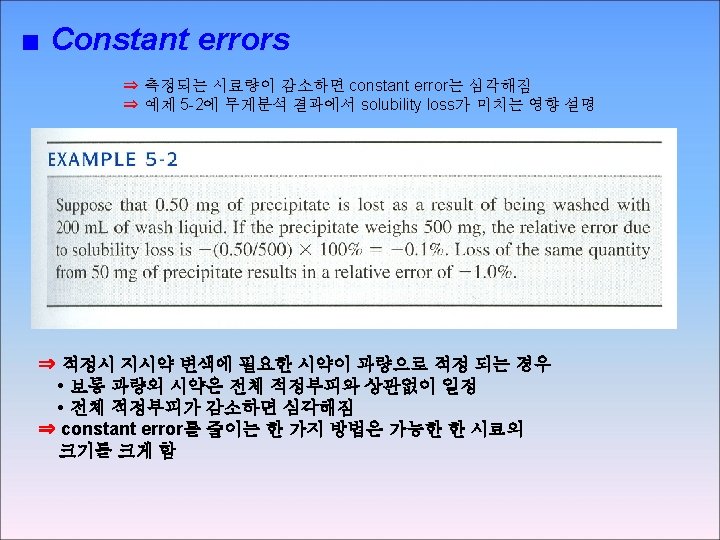
3 -3 Types of Error SYSTEMATIC ERROR Systematic error , also called determinate error arises from a flaw In equipment or the design of experiment.
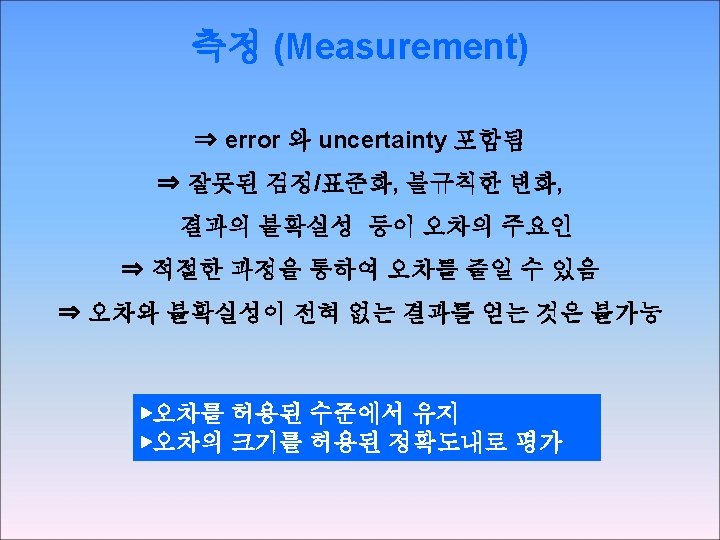
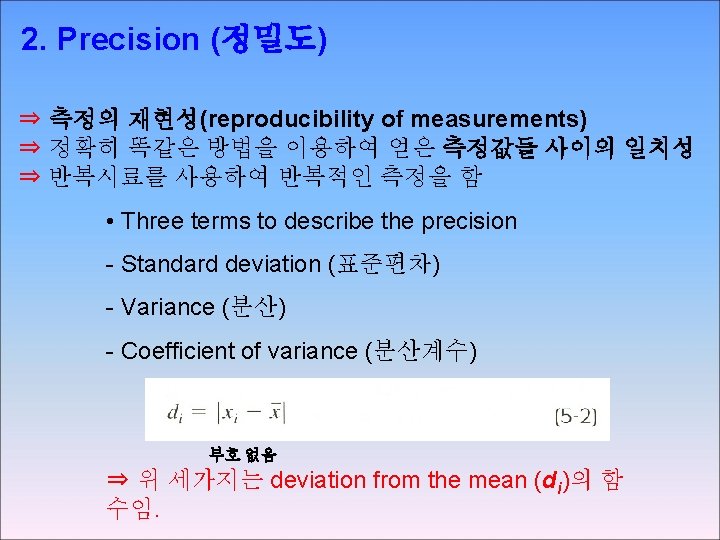
Random error, also called indeterminate error arises from uncontrolled (and maybe uncontrollable) Precision and accuracy Precision describes the reproducibility of a result, if you measure A quantity several time and the values agree closely with on another your measurement is precise. Accrue describes how close a measured value is to the “true” value If a known stands is available , accuracy hoe close your value is to the known value Absolute and relative uncertainty Absolute uncertainty expresses the margin of uncertainty associated With a measurement. Relative uncertainty compares the size of the absolute uncertainty With the size of its associated measuremen
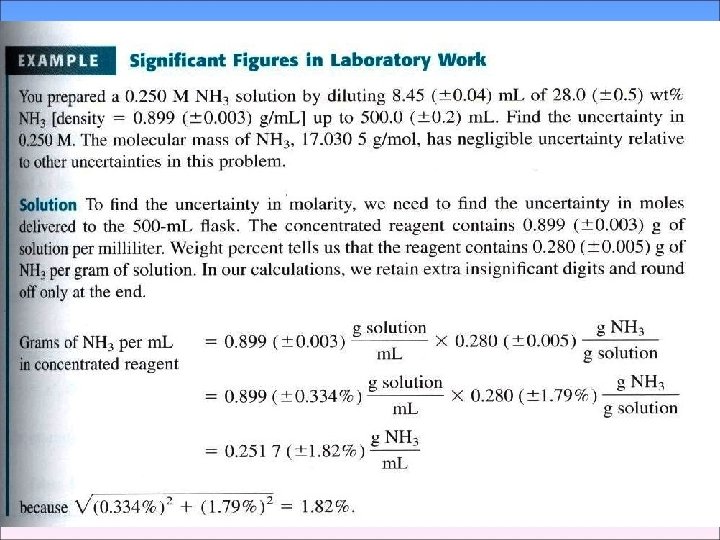
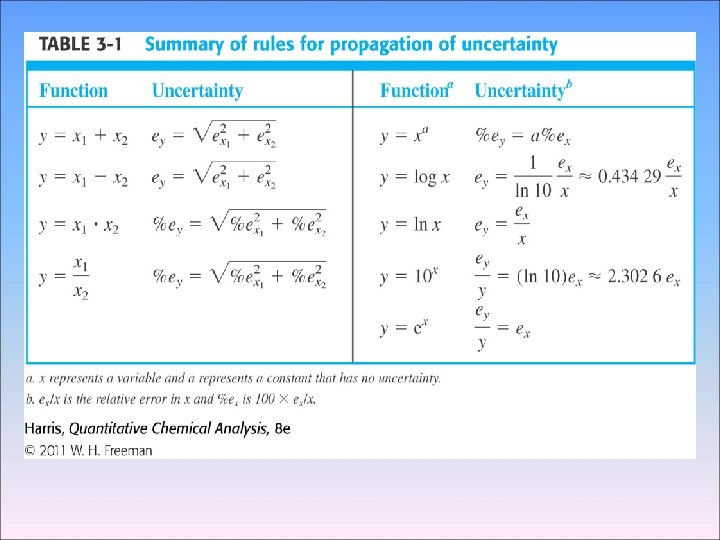
3 -4 Propagation of Uncertainty from Random Error 2 We can usually estimate or measure the random error associated with measurement, Such as the length of an object or the temperature of a solution - Addition and Subtraction 1. 76 (± 0. 03) + 1. 89 (± 0. 02) -0. 59(± 0. 02) 3. 06(±e 4) e 1 e 2 e 3 Percent relative uncertainty=0. 041 × 100=1. 3% 3. 06
- Multiplication and Division
Uncertainty in molecular mass
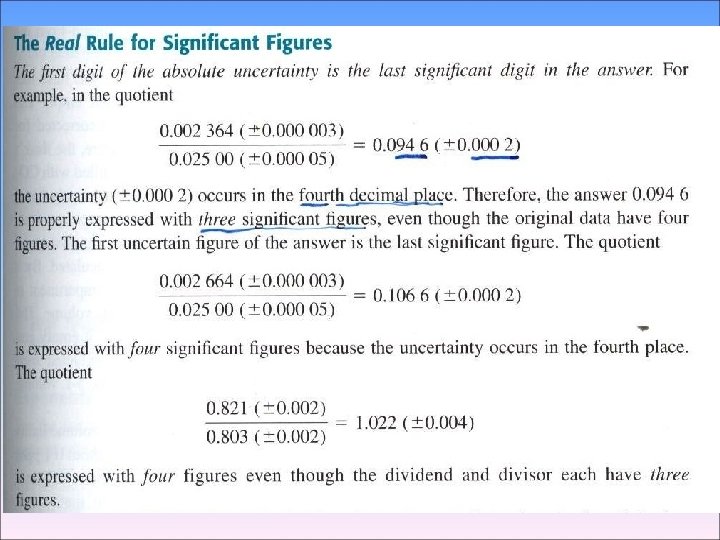
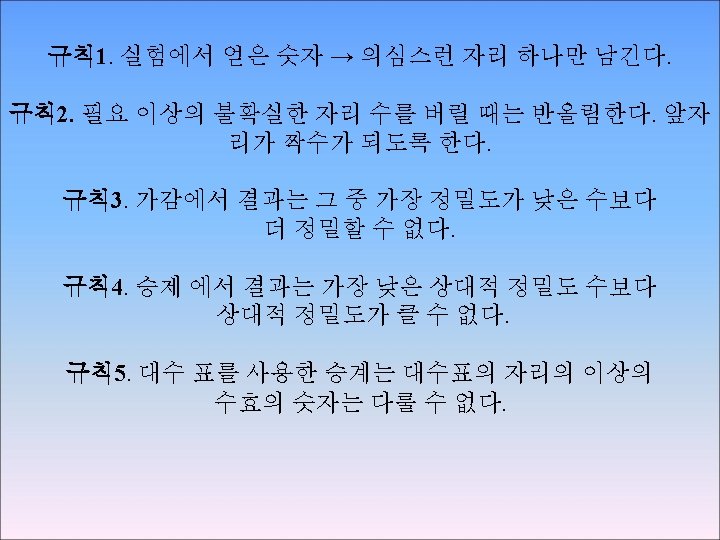
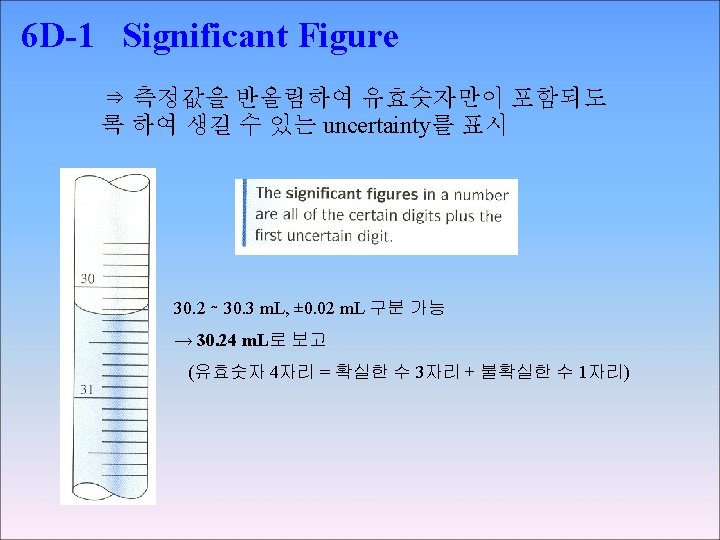
◉ Significant Figure Convention convention → (the digits known with centainty) + (the first uncertain one) ex) 61. 60, 61. 46, 61. 55, 61. 61의 평균 61. 555 �� 61. 555(± 0. 069) 61. 6 ± 0. 1 ���� > 소수 2째자리 수 → 불확실 하므로 61. 55⑤ → 반올림 5일 경우 가장 가까운 자리수가 짝수가 되도록 한다. 즉, 61. 56 → 61. 56(± 0. 07)
Errors in Chemical Analyses ▶오차의 종류와 오차의 검출방법
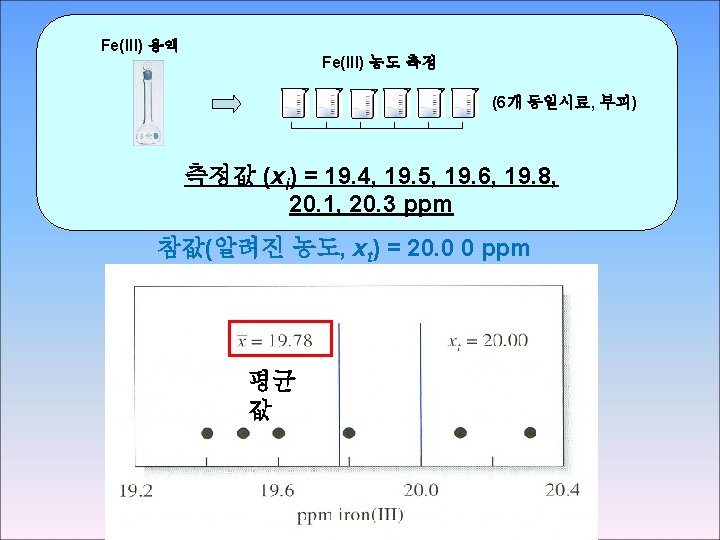
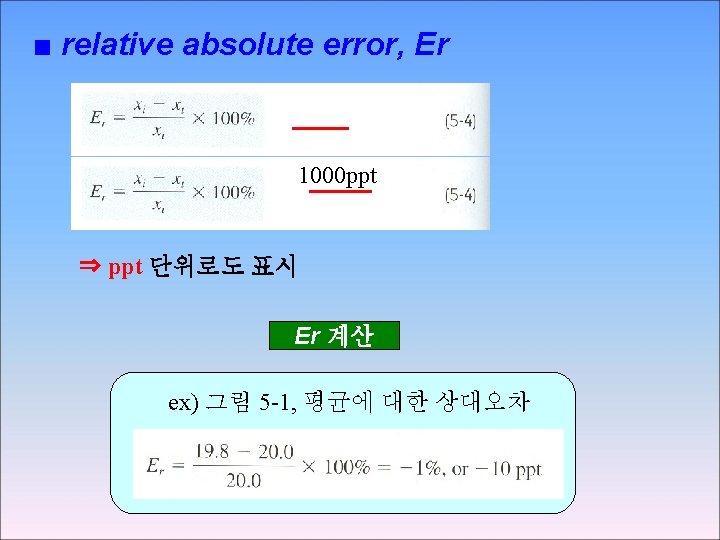
■ absolute error, E * xt : accepted value xi : observed value ⇒ 부호 (+/-) 있음: 측정값이 작으면 “ – “ 측정값이 크면 “ + “ E 계산 ex) 그림 5 -1, xt = 20. 00 ppm 19. 80 ppm의 absolute error = -0. 2 ppm 20. 10 ppm의 absolute error = +0. 1 ppm
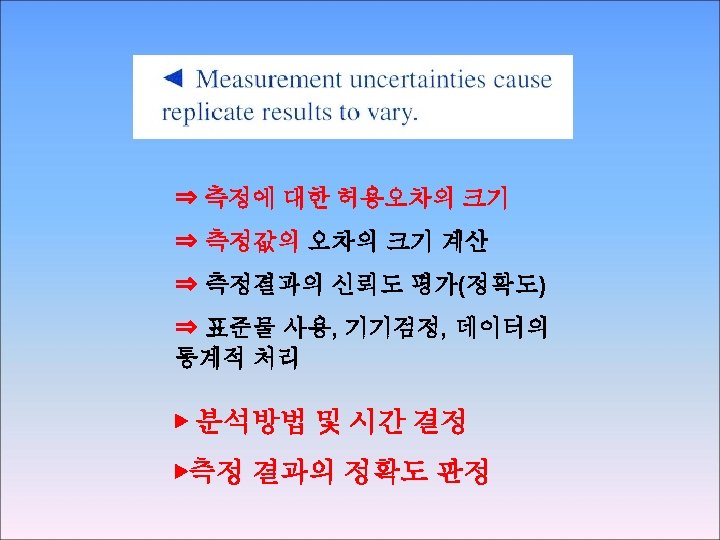
Absolute errors in the micro-Kjeldahl determination (질소 함량 결정) Analyst 1 : relatively high precision relatively high accuracy Analyst 3 : precision is excellent significant error exists Analyst 2 : poor precision good accuracy Analyst 4 : poor precision poor accuracy
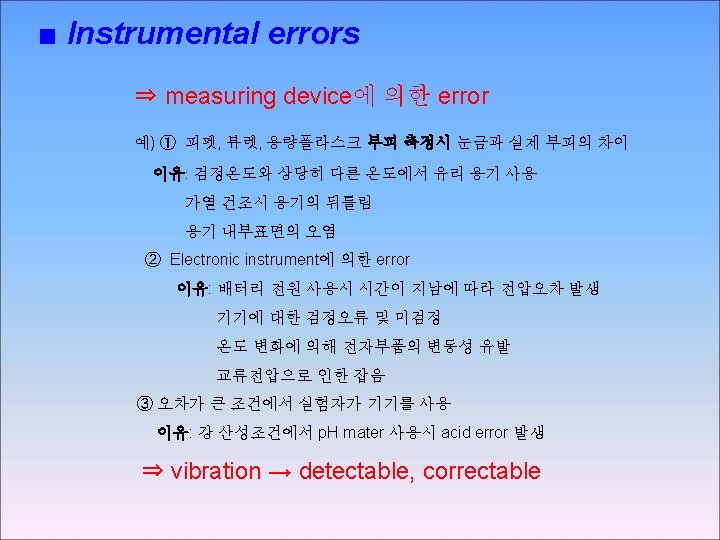
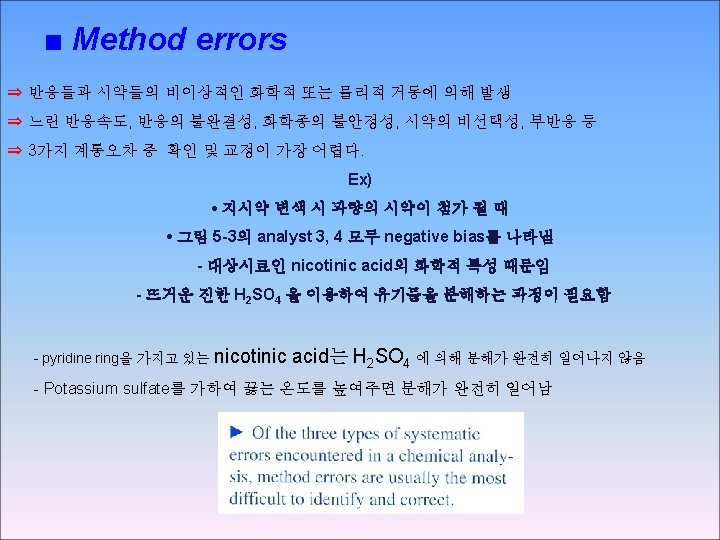
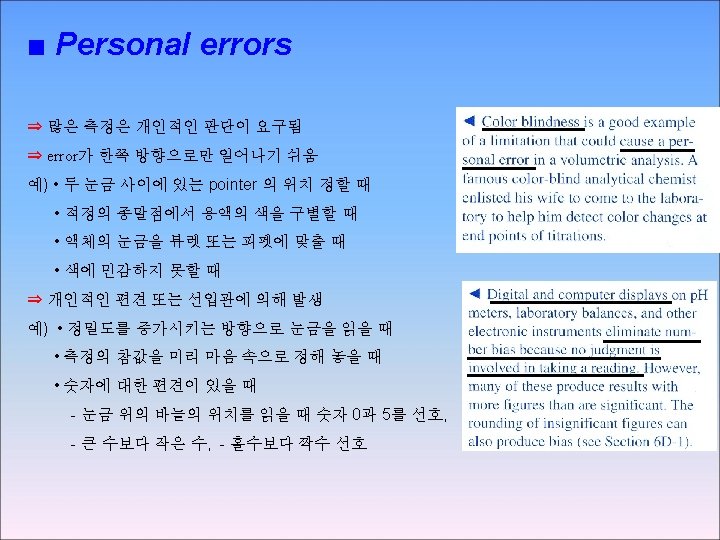
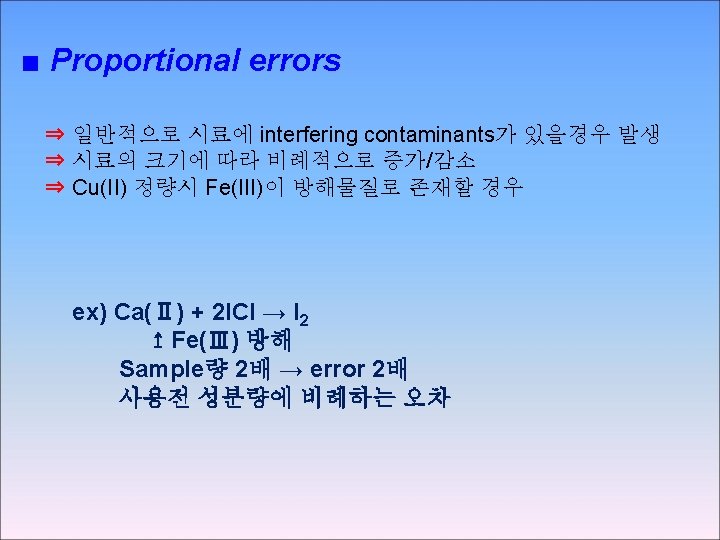
Sources of systematic errors Three types of systematic errors 1) instrumental errors 2) method errors 3) personal errors
Detection of systematic instrumental & personal errors ⇒ Instrumental error • can be founded and corrected by calibration • 주기적 검정이 필요 • 분석물의 반응에 영향을 주는 interference 가 시료에 존재하여 기기오차가 발생하는 경우 → 단순한 검정으로 영향제거 불가능 → 8 C-1 에서 제거방법 설명 ⇒ Personal error • 주의, 훈련에 의해 최소화 할 수 있음 • Check instrument reading, notebook entries & calculations • 실험자의 한계로 인한 error는 분석방법을 잘 선택하여 피함
http: //www. nist. gov/
http: //ts. nist. gov/measurementservices/referencematerials/index. cfm
105. 4 Toxic Substances in Urine (powder form) SRMs 2670 a, 2671 a and 2672 a are for determining toxic substances in human urine. They consist of freeze-dried urine and are provided in sets of four 30 m. L bottles -- two each at low and elevated levels. NOTE: The values listed for these SRMs apply only to reconstituted urine.
- Absolute and Relative Uncertainty
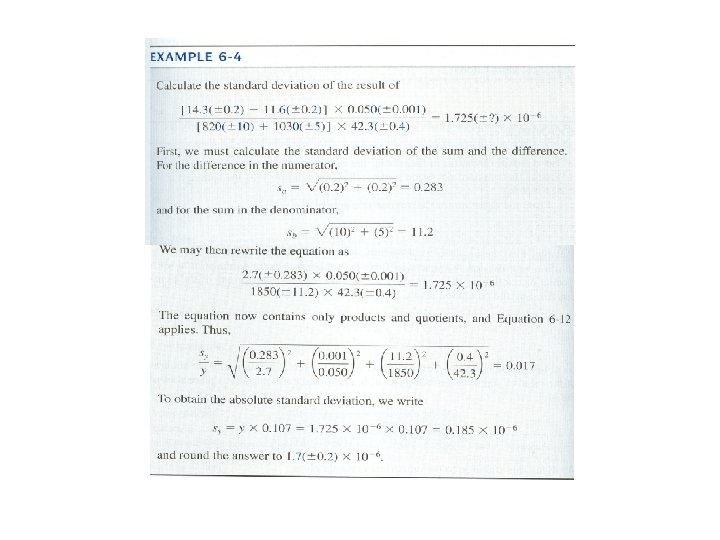
6 C-1 Standard Deviation of a Sum or Difference Absolute standard deviation The variance of y (sy 2) The standard deviation of the result (sy) ∴
6 C-2 Standard Deviation of a Product or Quotient Relative standard deviation Absolute standard deviation ∴ 0. 0104 (± 0. 0003)
6 C Standard Deviation of Calculated Results
6 D Reporting Computed Data ⇒ Data의 quality를 알 수 없는 결과는 가치가 없음 ⇒ 항상 data의 신뢰도를 나타내어야 함 ⇒ 신뢰도를 나타내는 가장 좋은 방법중의 하나는 90% 또는 95% confidence level 에서 confidence interval을 제시 ⇒ 또 다른 방법으로 data의 absolute standard deviation 또는 coefficient of variation을 보고 → data의 수도 같이 표기 ⇒ 덜 만족스럽지만 data quality를 나타내는 좀더 일반적인 것은 significant figure convention 임
6 D-2 Significant Figure in Numerical Computations 산술 계산시 → 적절한 유효숫자의 수를 결정 하도록 함 Sums and Differences 3. 4 + 0. 020 + 7. 31 = 10. 730 (round to 10. 7)
Products and Quotients 반올림 = 1. 1 = 1. 08 Relative uncertainty in the result 반올림 = 0. 96 Relative uncertainty in the result
Logarithms and Antilogarithms
6 D-3 Rounding Data 예) 61. 06, 61. 46, 61. 55, 61. 61 → → the result as 61. 6 ± 0. 1 = 61. 555, s = 0. 069 x