Chapter 3 CARBOHYDRATE METABOLISM BREAKDOWN OF GLUCOSE TO

Chapter 3 CARBOHYDRATE METABOLISM

BREAK-DOWN OF GLUCOSE TO GENERATE ENERGY - Also known as Respiration. - Comprises of these different processes depending on type of organism: I. Anaerobic Respiration II. Aerobic Respiration

ANAEROBIC RESPIRATION Comprises of these stages: glycolysis: glucose 2 pyruvate + NADH fermentation: pyruvate lactic acid or ethanol cellular respiration:

AEROBIC RESPIRATION Comprises of these stages: Oxidative decarboxylation of pyruvate Citric Acid cycle Oxidative phosphorylation/ Electron Transport Chain(ETC)

Brief overview of catabolism of glucose to generate energy STARCHY FOOD α – AMYLASE ; MALTASES Glucose converted to glu-6 -PO 4 Start of cycle Glycolysis in cytosol Cycle : anaerobic 2[Pyruvate+ATP+NADH] Anaerobic condition Lactic Acid fermentation in muscle. Only in yeast/bacteria Anaerobic respiration or Alcohol fermentation Aerobic condition; in mitochondria Pyruvate enters as Acetylco. A - Krebs Cycle - E transport chain

GLYCOLYSIS Show time. .

GLYCOLYSIS 1 st stage of glucose metabolism → glycolysis An anaerobic process, yields 2 ATP (additional energy source) Glucose will be metabolized via gycolysis; pyruvate as the end product The pyruvate will be converted to lactic acid (muscles → liver) Aerobic conditions: the main purpose is to feed pyruvate into TCA cycle for further rise of ATP
 → 2")
The breakdown of glucose to pyruvate as summarized: Glucose (six C atoms) → 2 pyruvate (three C atoms) 2 ATP + 4 ADP + 2 Pi → 2 ADP + 4 ATP (phosphorylation) Glucose + 2 ADP + 2 Pi → 2 Pyruvate + 2 ATP (Net reaction) Fig. 17 -1, p. 464

Fig. 17 -2, p. 465

Louis Pasteur - French biologist - did research on fermentation which led to important discoveries in microbiology and chemistry

HOW 6 -CARBON GLUCOSE CONVERTED TO THE 3 CARBON GLYCERALDEHYDE-3 -PHOSPHATE? Preparation phase Step 1 Glucose is phosphorylated to give gluc-6 -phosphate p. 467

Fig. 17 -3, p. 468
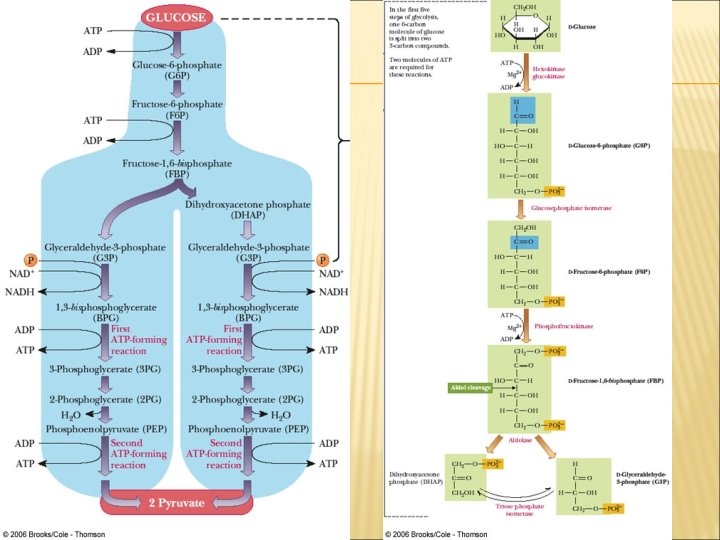

Table 17 -1, p. 469

Fig. 17 -4, p. 470

Step 2 Glucose-6 -phosphate isomerize to give fructose-6 phosphate p. 470 a

Step 3 Fructose-6 -phosphate is phosphorylated producing fructose-1, 6 -bisphosphate p. 470 b

Fig. 17 -6, p. 471

Step 4 Fructose-1, 6 -bisphosphate split into two 3 -carbon fragments p. 471 a

Step 5 Dihydroxyacetone phosphate is converted to glyceraldehyde-3 -phosphate p. 471 b

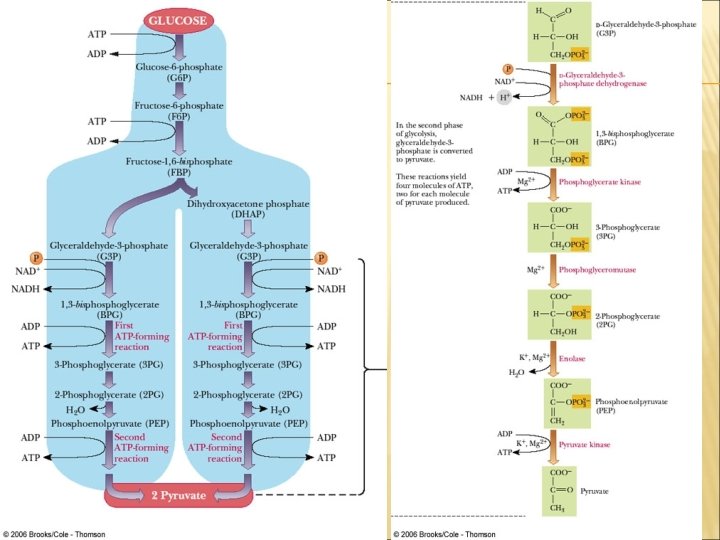
HOW IS GLYCERALDEHYDE-6 -PHOSPHATE CONVERTED TO Payoff phase PYRUVATE Step 6 Glyceraldehyde-6 -phosphate is oxidized to 1, 3 -bisphoglycerate p. 472

Fig. 17 -7, p. 473

p. 474 a

Fig. 17 -8, p. 475

Step 7 Production of ATP by phosphorylation of ADP p. 476

Step 8 Phosphate group is transferred from C-3 to C-2 p. 477 a

Step 9 Dehydration reaction of 2 -phosphoglycerate to phosphoenolpyruvate p. 477 b

Step 10 Phosphoenolpyruvate transfers its phosphate group to ADP → ATP and pyruvate p. 478

Control points in glycolysis Fig. 17 -10, p. 479

HOW IS PYRUVATE METABOLIZED ANAEROBICALLY? Conversion of pyruvate to lactate in muscle p. 479

Fig. 17 -11 b, p. 481

Pyruvate decarboxylase Fig. 17 -11 a, p. 481

Fig. 17 -12, p. 482

Acetaldehyde + NADH → Ethanol + NAD+ Glucose + 2 ADP + 2 Pi + 2 H+ → 2 Ethanol + 2 ATP + 2 CO 2 + 2 H 2 O p. 482
 Carbohydrate metabolism")
Chapter 3 (cont. ) Carbohydrate metabolism

Gluconeogenesis Conversion of pyruvate to glucose Biosynthesis and the degradation of many important biomolecules follow different pathways There are three irreversible steps in glycolysis and the differences bet. glycolysis and gluconeogenesis are found in these reactions Different pathway, reactions and enzyme ST EP 1 p. 495

is the biosynthesis of new glucose from non-CHO precursors. this glucose is as a fuel source by the brain, testes, erythrocytes and kidney medulla comprises of 9 steps and occurs in liver and kidney the process occurs when quantity of glycogen have been depleted - Used to maintain blood glucose levels. Designed to make sure blood glucose levels are high enough to meet the demands of brain and muscle (cannot do gluconeogenesis). promotes by low blood glucose level and high ATP inhibits by low ATP occurs when [glu] is low or during periods of fasting/starvation, or intense exercise pathway is highly endergonic *endergonic is energy consuming

STEP 2

The oxalocetate formed in the mitochondria have two fates: - continue to form PEP - turned into malate by malate dehydrogenase and leave the mitochondria, have a reaction reverse by cytosolic malate dehydrogenase Reason?

Controlling glucose metabolism • found in Cori cycle • shows the cycling of glucose due to gycolysis in muscle and gluconeogenesis in liver • This two metabolic pathways are not active simultaneously. • when the cell needs ATP, glycolisys is more active • When there is little need for ATP, gluconeogenesis is more active As energy store for next exercise Fig. 18 -12, p. 502

Cori cycle requires the net hydrolysis of two ATP and two GTP.

Fig. 18 -13, p. 503

The Citric Acid cycle Cycle where 30 to 32 molecules of ATP can be produced from glucose in complete aerobic oxidation Amphibolic – play roles in both catabolism and anabolism The other name of citric acid cycle: Krebs cycle and tricarboxylic acid cycle (TCA) Takes place in mitochondria

Fig. 19 -2, p. 513

Steps 3, 4, 6 and 8 – oxidation reactions Fig. 19 -3 b, p. 514

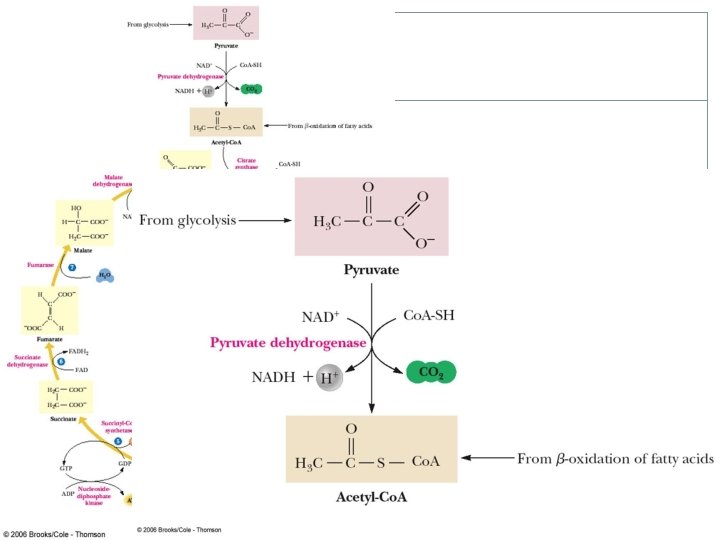
5 enzymes make up the pyruvate dehydrogenase complex: ü ü ü pyruvate dehydrogenase (PDH) Conversion of pyruvate Dihydrolipoyl transacetylase to acetyl-Co. A Dihydrolipoyl dehydrogenase Pyruvate dehydrogenase kinase Pyruvate dehydrogenase phosphatase

Step 1 Formation of citrate p. 518

Step 2 Isomerization Table 19 -1, p. 518

cis-Aconitate as an intermediate in the conversion of citrate to isocitrate Fig. 19 -6, p. 519

Step 3 Formation of αketoglutarate and CO 2 – first oxidation Fig. 19 -7, p. 521

Step 4 Formation of succinyl-Co. A and CO 2 – 2 nd oxidation p. 521

Step 5 Formation of succinate p. 522

Step 6 Formation of fumarate – FAD -linked oxidation p. 523 a

Step 7 Formation of L-malate p. 524 a

Step 8 Regeneration of oxaloacetate – final oxidation step p. 524 b

Krebs cycle produced: • 6 CO 2 • 2 ATP • 6 NADH • 2 FADH 2 Fig. 19 -8, p. 526

Table 19 -3, p. 527

Fig. 19 -10, p. 530

Fig. 19 -11, p. 531

Fig. 19 -12, p. 533

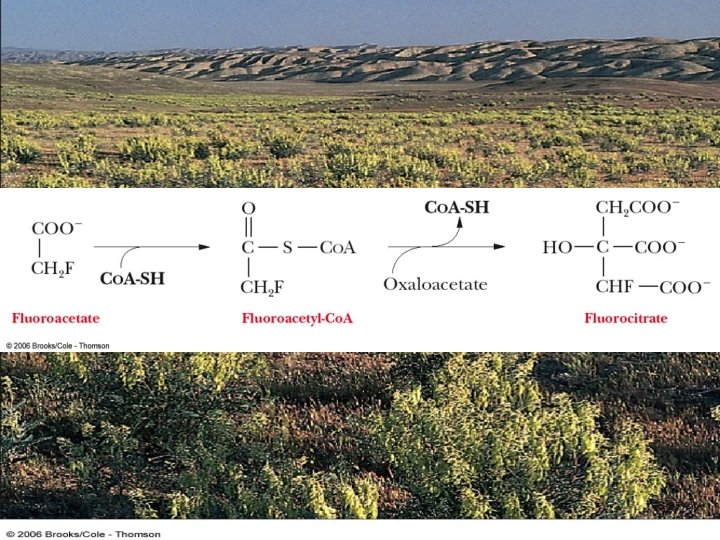
Fig. 19 -15, p. 535

Overall production from glycolysis, oxidative decarboxylation and TCA: Oxidative decarboxylation Glycolysis TCA cycle - 2 ATP 2 NADH 6 NADH , 2 FADH 2 2 CO 2 2 Pyruvate 4 CO 2 Electron transportation system
- Slides: 66