CHAPTER 27 PART 2 Inferences for Regression Conditions

The scatterplot needs to be “straight enough” meaning it has a linear trend.")


")

- Slides: 9
CHAPTER 27 PART 2 Inferences for Regression
Conditions: 1)The scatterplot needs to be “straight enough” meaning it has a linear trend. 2)We want a random (or representative) & independent sample. 3)The scatterplot for the residuals needs to show no pattern (meaning the linear model is appropriate). 4)A histogram for the residuals needs to be nearly Normal.
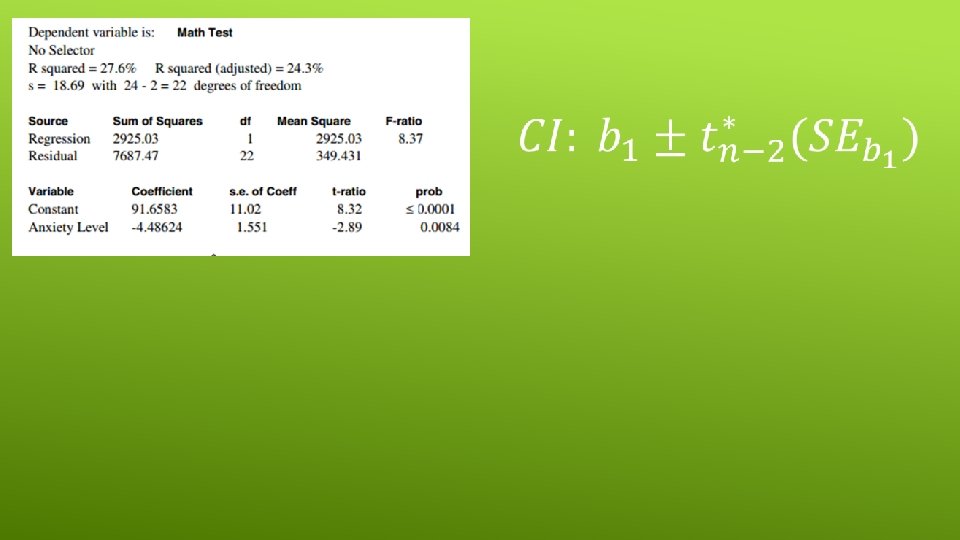
y-intercept Use this t-score and P-value
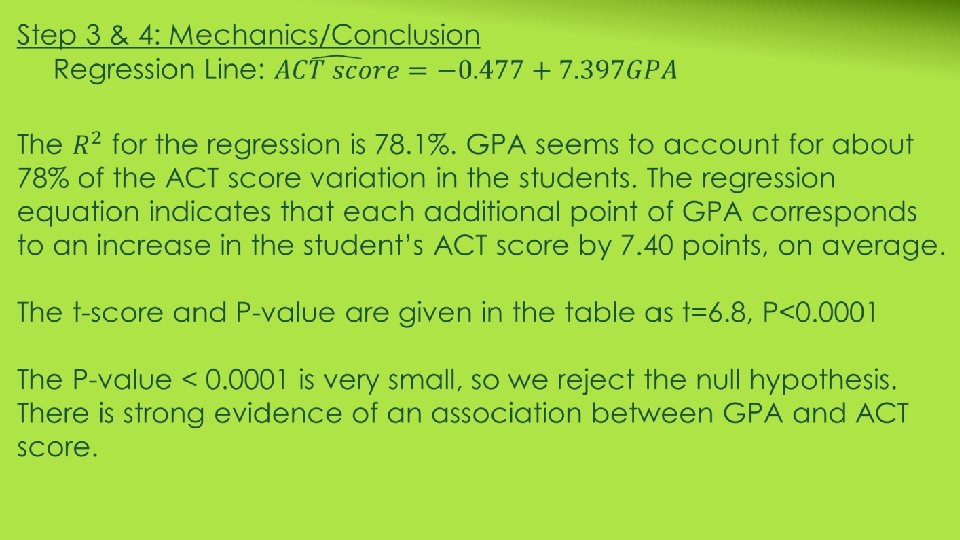
Is there evidence of an association between GPA and ACT score? Test an appropriate hypothesis.
Steps 1 & 2: Hypotheses and Conditions üStraight enough condition: There is no obvious bend in the original scatterplot of the data or in the plot of the residuals against the predicted values. üIndependence: These data were not collected over time and there is no pattern in the residuals plot. üDoes the plot thicken? : Neither the original scatterplot nor the residual plot shows any changes in the spread about the line. üNearly Normal condition: A histogram of the residuals is roughly unimodal and symmetric. Under these conditions the regression model is appropriate. We will use the linear regression t-test.
Steps 5: Confidence Interval (if there is an association)
Today’s Assignment: q HW: Pg. 673 #13 -16, 18, 20, 22 q Ch. 27 Homework Due Tuesday q Mock AP test in class the first week in May (last week of block schedule)