
Chapter 26 Phylogeny and the Tree of Life

- Slides: 90
Chapter 26 Phylogeny and the Tree of Life © 2017 Pearson Education, Inc. Lecture Presentations by Nicole Tunbridge and Kathleen Fitzpatrick
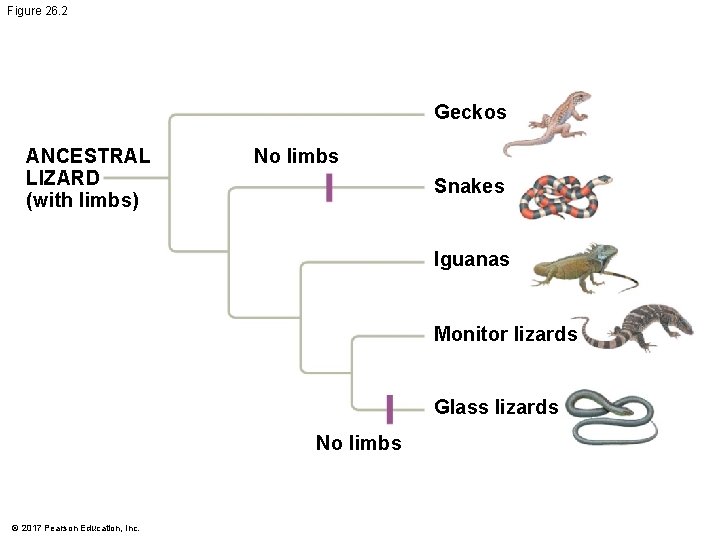
Investigating the Tree of Life § Phylogeny is the evolutionary history of a species or group of related species § For example, a phylogeny shows that legless lizards and snakes evolved from different lineages of legged lizards § The discipline of systematics classifies organisms and determines their evolutionary relationships © 2017 Pearson Education, Inc.
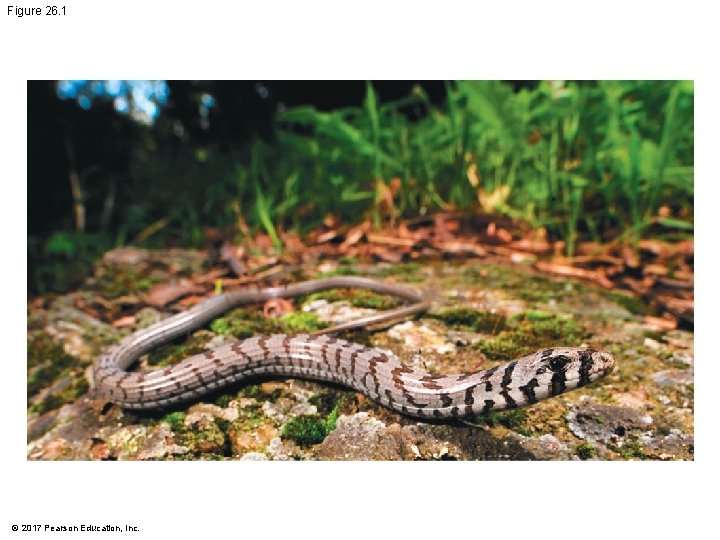
Figure 26. 1 © 2017 Pearson Education, Inc.
Figure 26. 2 Geckos ANCESTRAL LIZARD (with limbs) No limbs Snakes Iguanas Monitor lizards Glass lizards No limbs © 2017 Pearson Education, Inc.
Binomial Nomenclature § In the 18 th century, Carolus Linnaeus published a system of taxonomy based on resemblances § Two key features of his system remain useful today: two-part names for species and hierarchical classification © 2017 Pearson Education, Inc.
§ The two-part scientific name of a species is called a binomial § The first part of the name is the genus § The second part, called the specific epithet, is unique for each species within the genus § The first letter of the genus is capitalized, and the entire species name is italicized § Both parts together name the species (not the specific epithet alone) © 2017 Pearson Education, Inc.
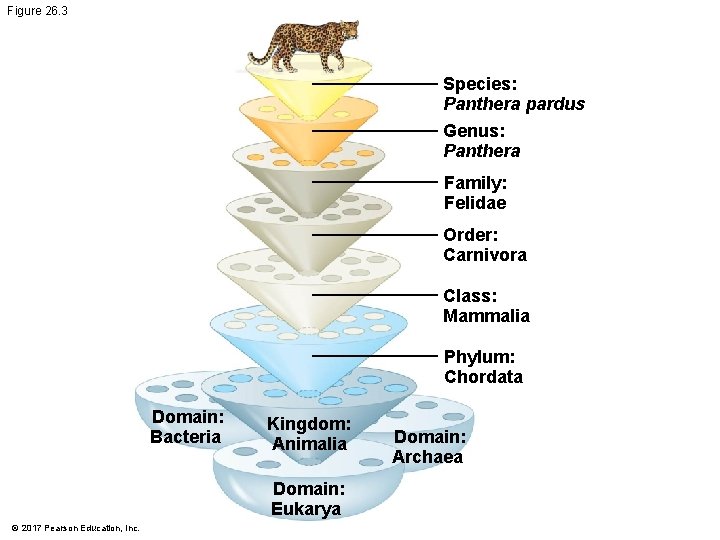
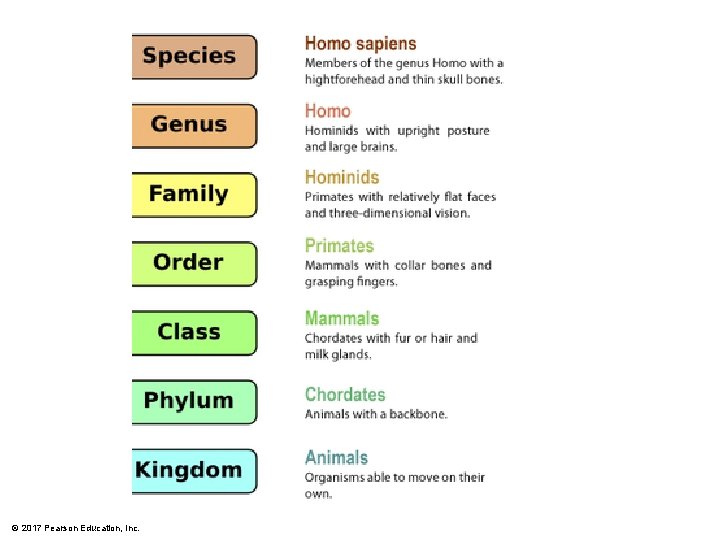
Hierarchical Classification § Linnaeus introduced a system for grouping species in increasingly inclusive categories § The taxonomic groups from broad to narrow are domain, kingdom, phylum, class, order, family, genus, and species § A taxonomic unit at any level of hierarchy is called a taxon § The broader taxa are not comparable between lineages § For example, an order of snails has less genetic diversity than an order of mammals © 2017 Pearson Education, Inc.
Figure 26. 3 Species: Panthera pardus Genus: Panthera Family: Felidae Order: Carnivora Class: Mammalia Phylum: Chordata Domain: Bacteria Kingdom: Animalia Domain: Eukarya © 2017 Pearson Education, Inc. Domain: Archaea
© 2017 Pearson Education, Inc.
Animation: Classification Schemes © 2017 Pearson Education, Inc.
Linking Classification and Phylogeny § The evolutionary history of a group of organisms can be represented in a branching phylogenetic tree © 2017 Pearson Education, Inc.
Figure 26. 4 Order Family Genus Panthera Felidae Taxidea Lutra Mustelidae Carnivora Canis Canidae © 2017 Pearson Education, Inc. Species Panthera pardus (leopard) Taxidea taxus (American badger) Lutra lutra (European otter) Canis latrans (coyote) Canis lupus (gray wolf)
§ Linnaean classification and phylogeny can differ from each other § Systematists have proposed a classification system that would recognize only groups that include a common ancestor and all its descendants © 2017 Pearson Education, Inc.
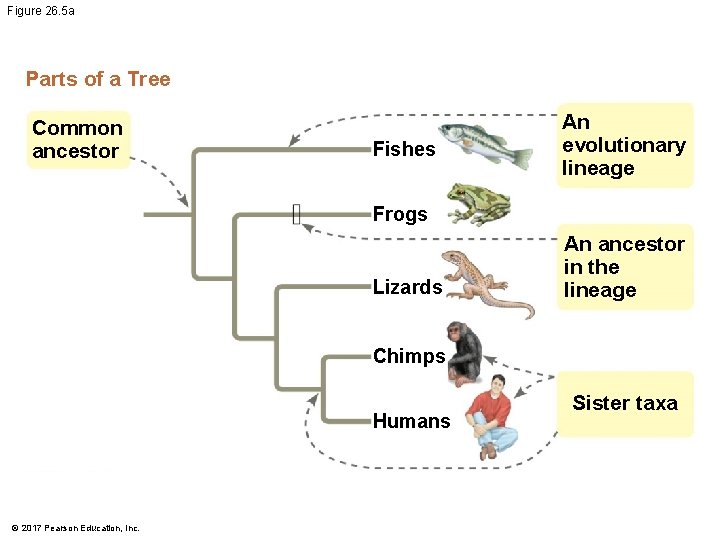
What We Can and Cannot Learn from Phylogenetic Trees § A phylogenetic tree represents a hypothesis about evolutionary relationships § Each branch point represents the divergence of two evolutionary lineages from a common ancestor § Sister taxa are groups that share an immediate common ancestor that is not shared by any other group © 2017 Pearson Education, Inc.
Figure 26. 5 a Parts of a Tree Common ancestor Fishes An evolutionary lineage Frogs Lizards An ancestor in the lineage Chimps Humans © 2017 Pearson Education, Inc. Sister taxa
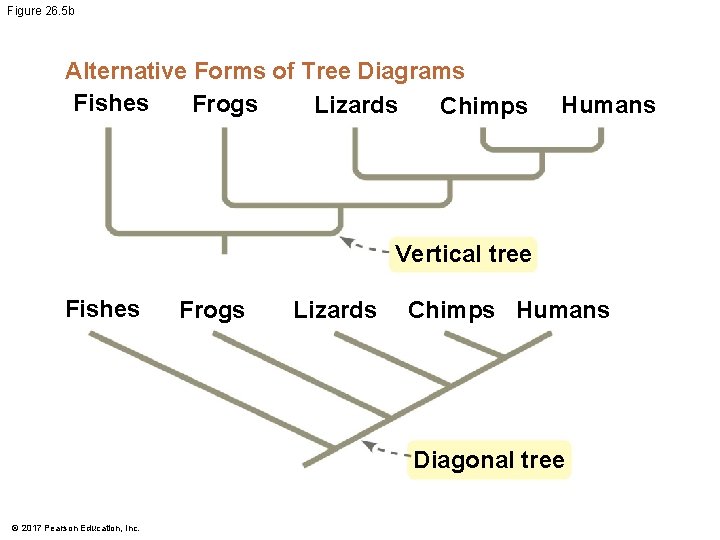
§ Phylogenetic trees can be drawn horizontally, vertically, or diagonally without changing the relationships between groups © 2017 Pearson Education, Inc.
Figure 26. 5 b Alternative Forms of Tree Diagrams Fishes Frogs Lizards Chimps Humans Vertical tree Fishes Frogs Lizards Chimps Humans Diagonal tree © 2017 Pearson Education, Inc.
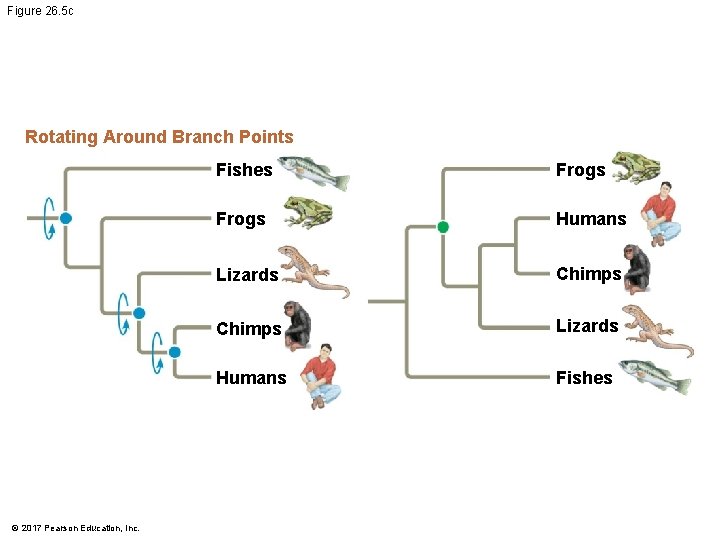
§ Tree branches can be rotated around a branch point without changing the evolutionary relationships © 2017 Pearson Education, Inc.
Figure 26. 5 c Rotating Around Branch Points © 2017 Pearson Education, Inc. Fishes Frogs Humans Lizards Chimps Lizards Humans Fishes
§ A rooted tree includes a branch to represent the most recent common ancestor of all taxa in the tree § A basal taxon diverges early in the history of a group and originates near the common ancestor of the group © 2017 Pearson Education, Inc.
§ Phylogenetic trees show patterns of descent, not phenotypic similarity § Phylogenetic trees do not indicate when species evolved or how much change occurred in a lineage § It should not be assumed that a taxon evolved from the taxon next to it © 2017 Pearson Education, Inc.
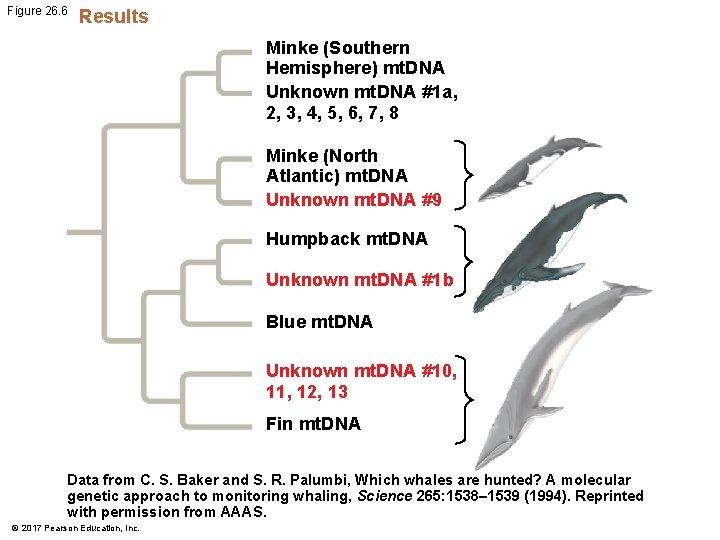
Applying Phylogenies § Phylogeny provides important information about similar characteristics in closely related species § A phylogeny was used to identify the species of whale from which “whale meat” originated to discover if the whale was harvested illegally © 2017 Pearson Education, Inc.
Figure 26. 6 Results Minke (Southern Hemisphere) mt. DNA Unknown mt. DNA #1 a, 2, 3, 4, 5, 6, 7, 8 Minke (North Atlantic) mt. DNA Unknown mt. DNA #9 Humpback mt. DNA Unknown mt. DNA #1 b Blue mt. DNA Unknown mt. DNA #10, 11, 12, 13 Fin mt. DNA Data from C. S. Baker and S. R. Palumbi, Which whales are hunted? A molecular genetic approach to monitoring whaling, Science 265: 1538– 1539 (1994). Reprinted with permission from AAAS. © 2017 Pearson Education, Inc.
Concept 26. 2: Phylogenies are inferred from morphological and molecular data § To infer phylogenies, systematists gather information about the morphologies, genes, and biochemistry of living organisms © 2017 Pearson Education, Inc.
Morphological and Molecular Homologies § Phenotypic and genetic similarities due to shared ancestry are called homologies § Organisms with similar morphologies or DNA sequences are likely to be more closely related than organisms with different structures or sequences © 2017 Pearson Education, Inc.
Sorting Homology from Analogy § When constructing a phylogeny, systematists need to distinguish whether a similarity is the result of homology or analogy § Homology is similarity due to shared ancestry § Analogy is similarity due to convergent evolution © 2017 Pearson Education, Inc.
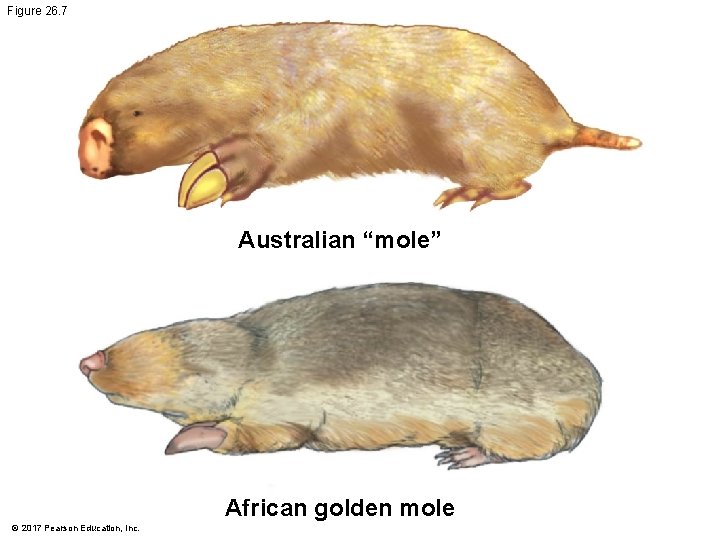
§ Convergent evolution occurs when similar environmental pressures and natural selection produce similar (analogous) adaptations in organisms from different evolutionary lineages © 2017 Pearson Education, Inc.
Figure 26. 7 Australian “mole” African golden mole © 2017 Pearson Education, Inc.
§ Homology can be distinguished from analogy by comparing fossil evidence and the degree of complexity § The more elements that are similar in two complex structures, the more likely it is that they are homologous § If the genes in two organisms share many portions of nucleotide sequence, it is likely they are homologous © 2017 Pearson Education, Inc.
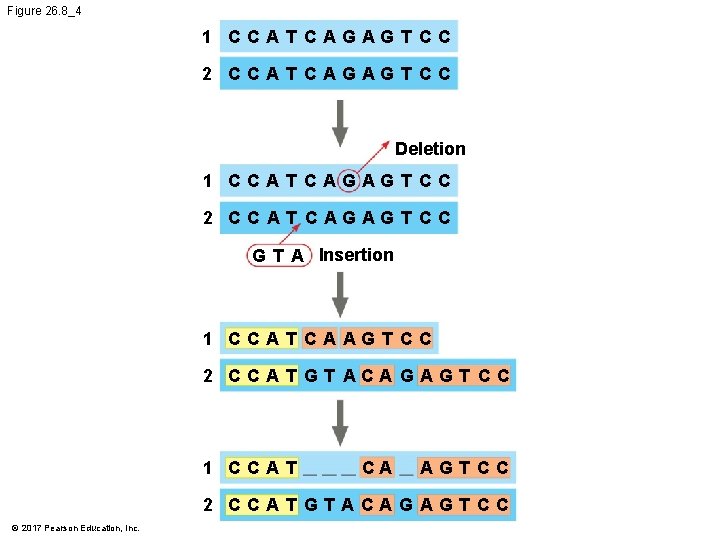
Evaluating Molecular Homologies § Systematists use computer programs and mathematical tools when analyzing comparable DNA segments from different organisms © 2017 Pearson Education, Inc.
Figure 26. 8_4 1 CCAT CAGAG T CC 2 CCAT CAGAG T CC Deletion 1 CCAT CAGAG T CC 2 CCAT CAGAG T CC G T A Insertion 1 CCAT CAAGTCC 2 CC A T GT ACA G AGT CC 1 CCAT CA AGTCC 2 CC A T G TA CA G AG T CC © 2017 Pearson Education, Inc.
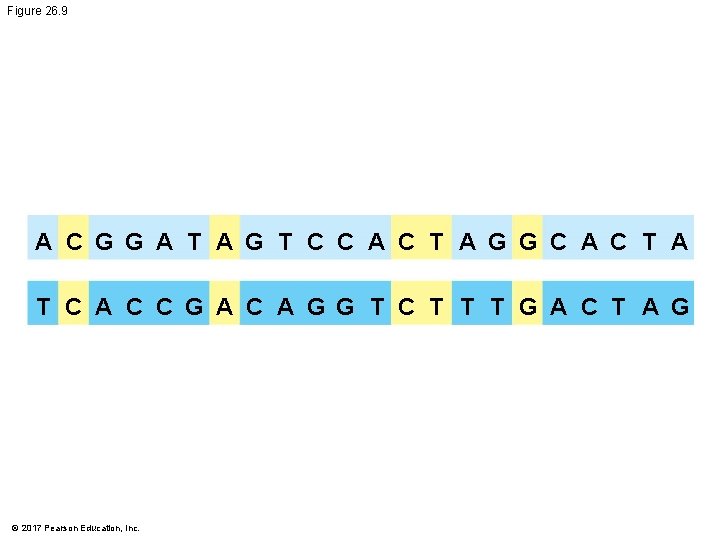
§ It is also important to distinguish homology from analogy in molecular similarities § Mathematical tools help to identify molecular homoplasies, or coincidental similarities © 2017 Pearson Education, Inc.
Figure 26. 9 A C G G A T A G T C C A C T A G G C A C T A T C A C C G A C A G G T C T T T G A C T A G © 2017 Pearson Education, Inc.
Concept 26. 3: Shared characters are used to construct phylogenetic trees § Once homologous characters have been identified, they can be used to infer a phylogeny © 2017 Pearson Education, Inc.
Cladistics § Cladistics groups organisms by common ancestry § A clade is a group of species that includes an ancestral species and all its descendants § Clades can be nested in larger clades, but not all groupings of organisms qualify as clades © 2017 Pearson Education, Inc.
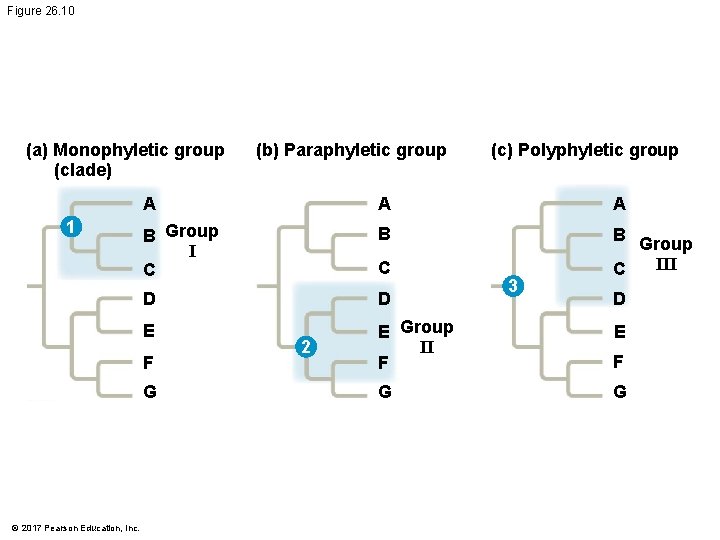
§ A valid clade is monophyletic, signifying that it consists of the ancestor species and all its descendants § A paraphyletic grouping consists of an ancestral species and some, but not all, of the descendants § A polyphyletic grouping includes distantly related species but does not include their most recent common ancestor © 2017 Pearson Education, Inc.
Figure 26. 10 (a) Monophyletic group (clade) 1 (c) Polyphyletic group A A A B Group I C B B D D E E Group II F F G G F G © 2017 Pearson Education, Inc. (b) Paraphyletic group C 2 3 Group III C D E
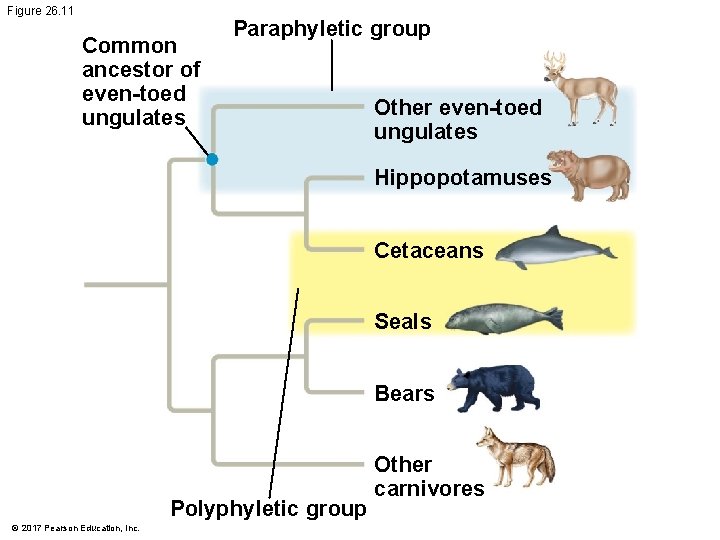
§ Polyphyletic groups are distinguished from paraphyletic groups by the fact that they do not include the most recent common ancestor § Biologists avoid defining polyphyletic groups and instead reclassify organisms if evidence suggests they are polyphyletic © 2017 Pearson Education, Inc.
Figure 26. 11 Common ancestor of even-toed ungulates Paraphyletic group Other even-toed ungulates Hippopotamuses Cetaceans Seals Bears Polyphyletic group © 2017 Pearson Education, Inc. Other carnivores
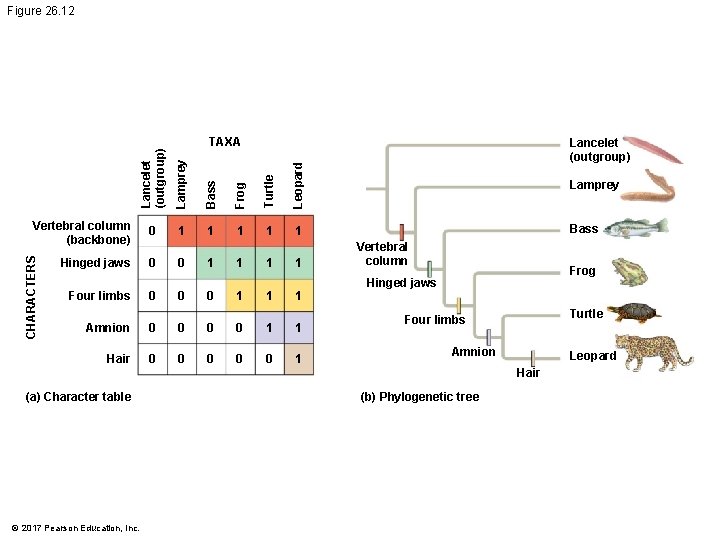
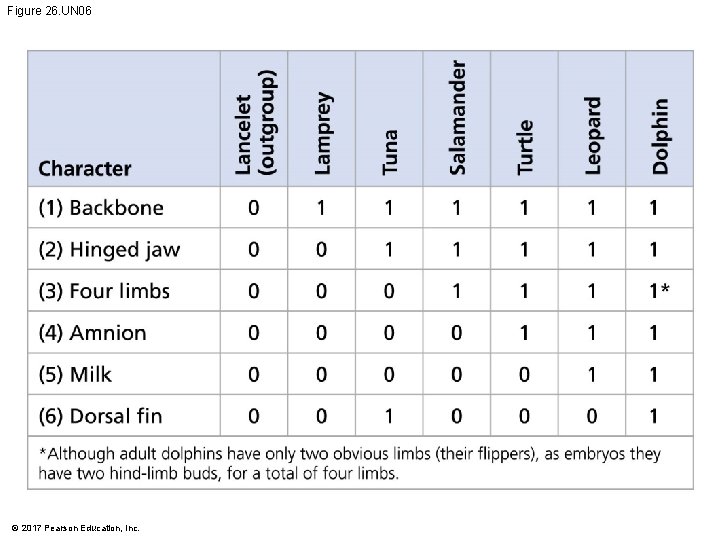
Shared Ancestral and Shared Derived Characters § In comparison with its ancestor, an organism has both shared and different characters § A shared ancestral character is a character that originated in an ancestor of the taxon § A shared derived character is an evolutionary novelty unique to a particular clade § A character can be both ancestral and derived, depending on the context © 2017 Pearson Education, Inc.
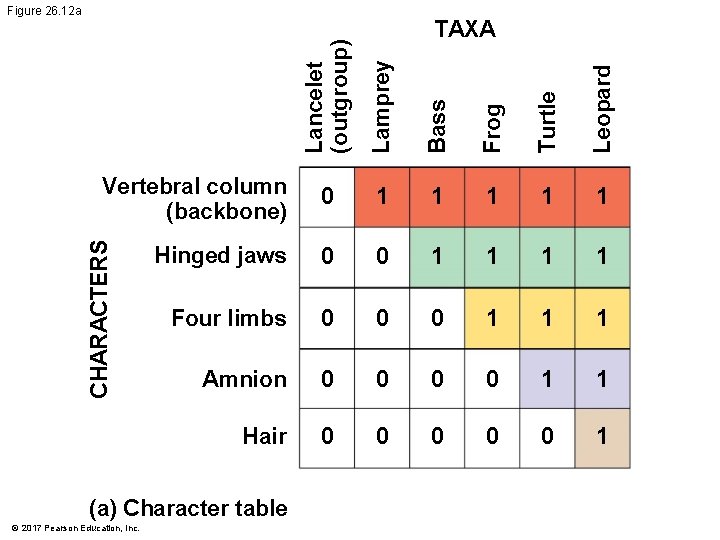
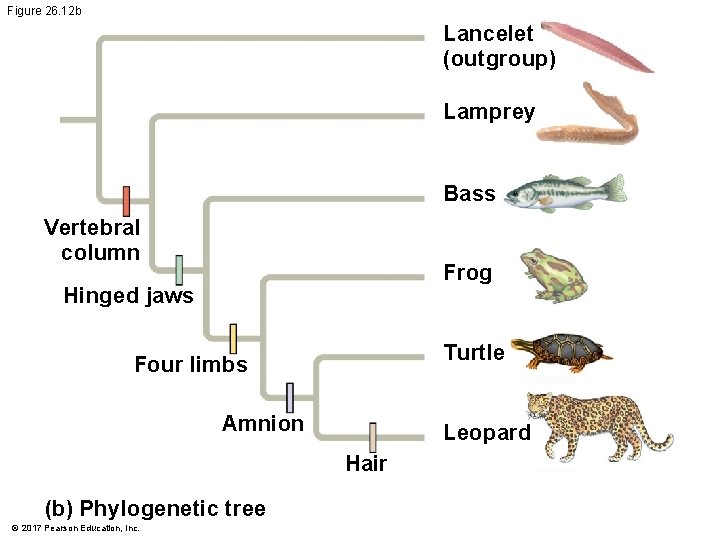
Inferring Phylogenies Using Derived Characters § When inferring evolutionary relationships, it is useful to know in which clade a shared derived character first appeared © 2017 Pearson Education, Inc.
Figure 26. 12 Lancelet (outgroup) Lamprey Bass Frog Turtle Leopard 0 1 1 1 Vertebral column (backbone) CHARACTERS TAXA Hinged jaws Four limbs 0 0 1 0 1 1 1 Amnion 0 0 1 1 Hair 0 0 0 1 Lancelet (outgroup) Lamprey Bass Vertebral column Frog Hinged jaws Turtle Four limbs Amnion Leopard Hair (a) Character table © 2017 Pearson Education, Inc. (b) Phylogenetic tree
Figure 26. 12 a Lancelet (outgroup) Lamprey Bass Frog Turtle Leopard 0 1 1 1 Hinged jaws 0 0 1 1 Four limbs 0 0 0 1 1 1 Amnion 0 0 1 1 Hair 0 0 0 1 CHARACTERS Vertebral column (backbone) (a) Character table © 2017 Pearson Education, Inc. TAXA
Figure 26. 12 b Lancelet (outgroup) Lamprey Bass Vertebral column Frog Hinged jaws Turtle Four limbs Amnion Leopard Hair (b) Phylogenetic tree © 2017 Pearson Education, Inc.
§ An outgroup is a species or group of species that is closely related to the ingroup, the various species being studied § The outgroup is a group that has diverged before the ingroup § Systematists compare each ingroup species with the outgroup to differentiate between shared derived and shared ancestral characters © 2017 Pearson Education, Inc.
§ Characters shared by the outgroup and ingroup are ancestral characters that predate the divergence of both groups from a common ancestor © 2017 Pearson Education, Inc.
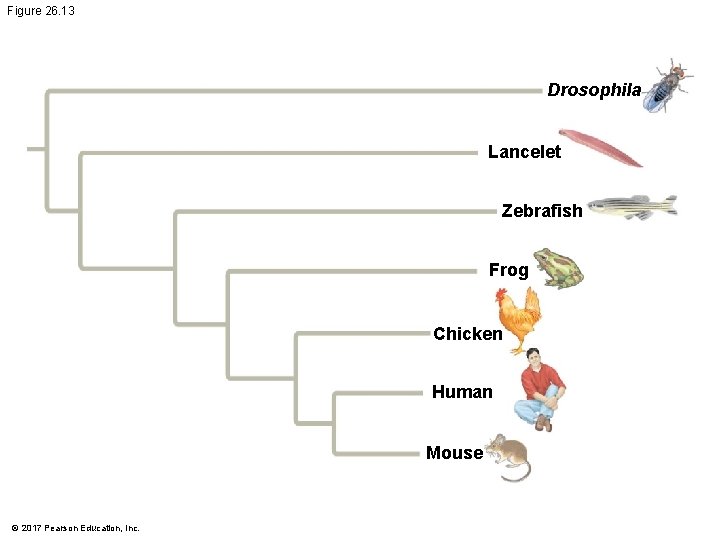
Phylogenetic Trees with Proportional Branch Lengths § In some trees, the length of a branch can reflect the number of genetic changes that have taken place in a particular DNA sequence in that lineage © 2017 Pearson Education, Inc.
Figure 26. 13 Drosophila Lancelet Zebrafish Frog Chicken Human Mouse © 2017 Pearson Education, Inc.
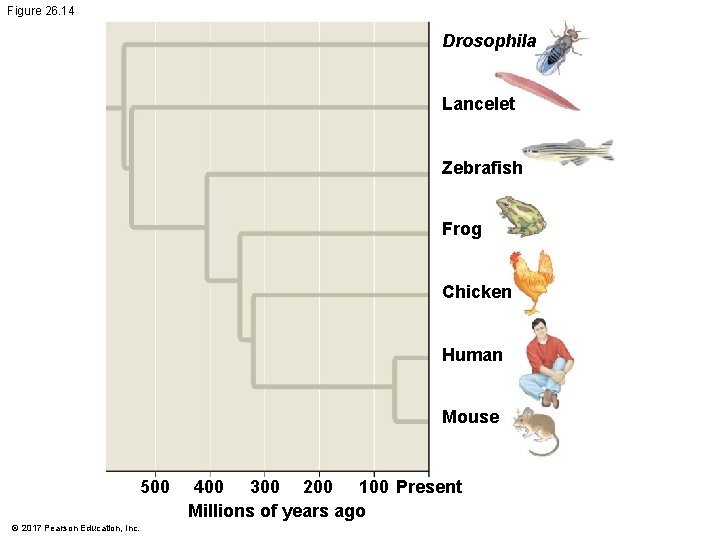
§ In other trees, branch length can be proportional to time, and branching points can be determined from the fossil record © 2017 Pearson Education, Inc.
Figure 26. 14 Drosophila Lancelet Zebrafish Frog Chicken Human Mouse 500 © 2017 Pearson Education, Inc. 400 300 200 100 Present Millions of years ago
Maximum Parsimony and Maximum Likelihood § Systematists can never be sure of finding the best tree in a large data set § They narrow possibilities by applying the principles of maximum parsimony and maximum likelihood © 2017 Pearson Education, Inc.
§ Maximum parsimony assumes that the tree that requires the fewest evolutionary events (appearances of shared derived characters) is the most likely § Maximum likelihood is based on probability rules about how DNA changes over time and assumes a tree can be found that reflects the most likely sequence of evolutionary events § Computer programs are used to search for trees that are parsimonious and likely © 2017 Pearson Education, Inc.
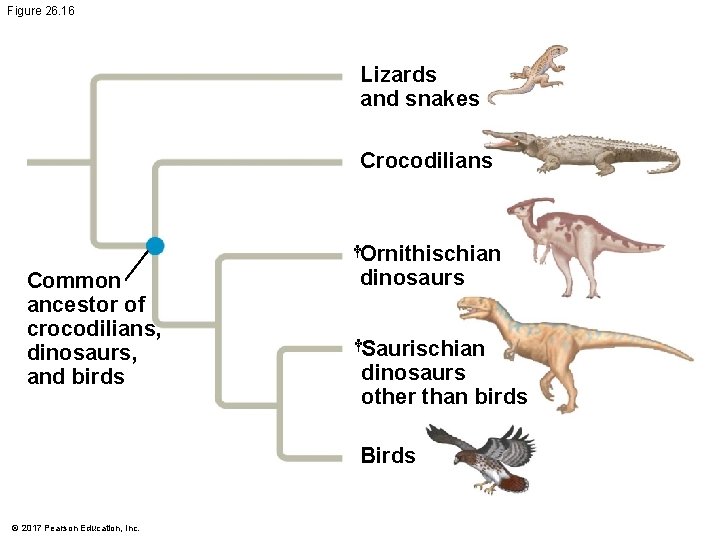
Phylogenetic Trees as Hypotheses § The best hypothesis for a phylogenetic tree fits the most data: morphological, molecular, and fossil § Phylogenetic bracketing allows us to predict features of an ancestor from features of its descendants § For example, phylogenetic bracketing allows us to infer characteristics of dinosaurs © 2017 Pearson Education, Inc.
Figure 26. 16 Lizards and snakes Crocodilians †Ornithischian Common ancestor of crocodilians, dinosaurs, and birds dinosaurs †Saurischian dinosaurs other than birds Birds © 2017 Pearson Education, Inc.
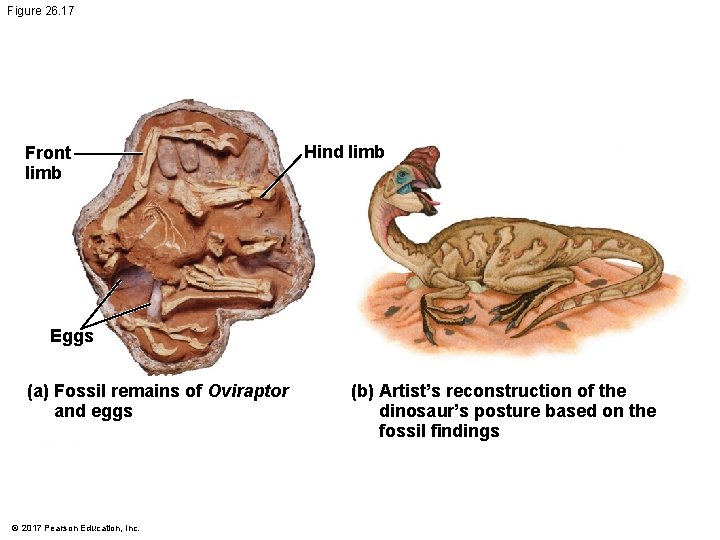
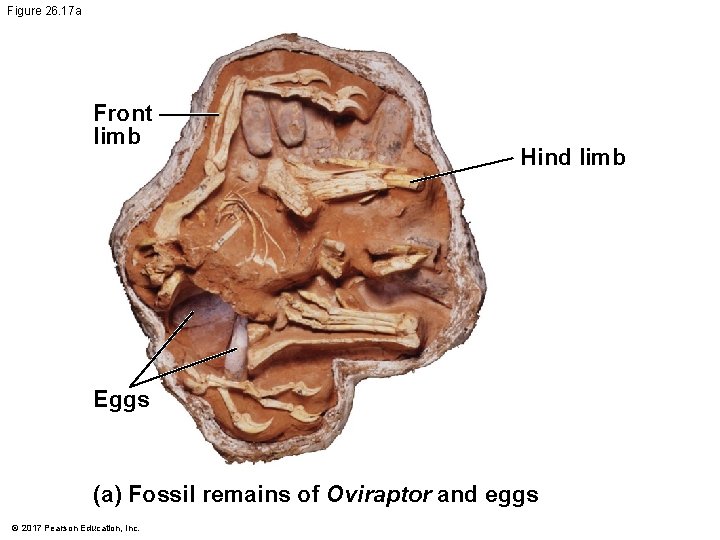
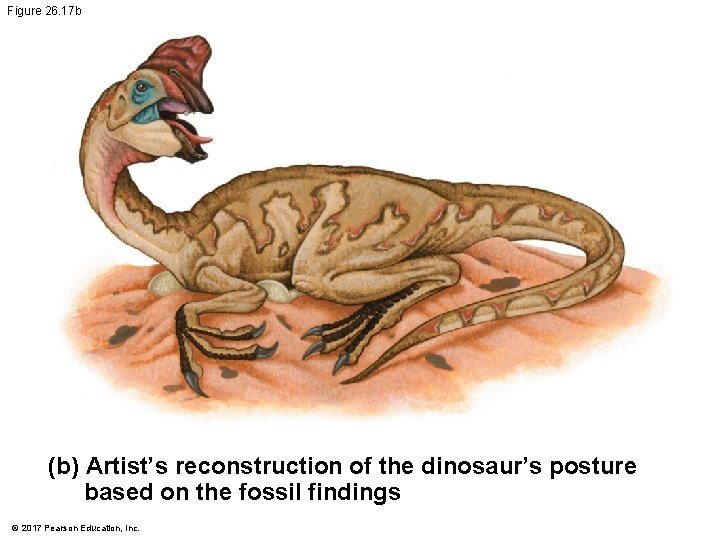
§ Birds and crocodiles share several features: fourchambered hearts, song, nest building, and brooding § These features likely evolved in a common ancestor and were shared by all of its descendants, including dinosaurs § The fossil record supports nest building and brooding in dinosaurs © 2017 Pearson Education, Inc.
Figure 26. 17 Front limb Hind limb Eggs (a) Fossil remains of Oviraptor and eggs © 2017 Pearson Education, Inc. (b) Artist’s reconstruction of the dinosaur’s posture based on the fossil findings
Figure 26. 17 a Front limb Hind limb Eggs (a) Fossil remains of Oviraptor and eggs © 2017 Pearson Education, Inc.
Figure 26. 17 b (b) Artist’s reconstruction of the dinosaur’s posture based on the fossil findings © 2017 Pearson Education, Inc.
Animation: The Geologic Record © 2017 Pearson Education, Inc.
Concept 26. 4: An organism’s evolutionary history is documented in its genome § Comparing nucleic acids or other molecules to infer relatedness is a valuable approach for tracing organisms’ evolutionary history § DNA that codes for r. RNA changes relatively slowly and is useful for investigating branching points that diverged hundreds of millions of years ago § mt. DNA evolves rapidly and can be used to explore recent evolutionary events © 2017 Pearson Education, Inc.
Gene Duplications and Gene Families § Gene duplication increases the number of genes in the genome, providing more opportunities for evolutionary changes § Repeated gene duplications result in gene families § Like homologous genes, duplicated genes can be traced to a common ancestor © 2017 Pearson Education, Inc.
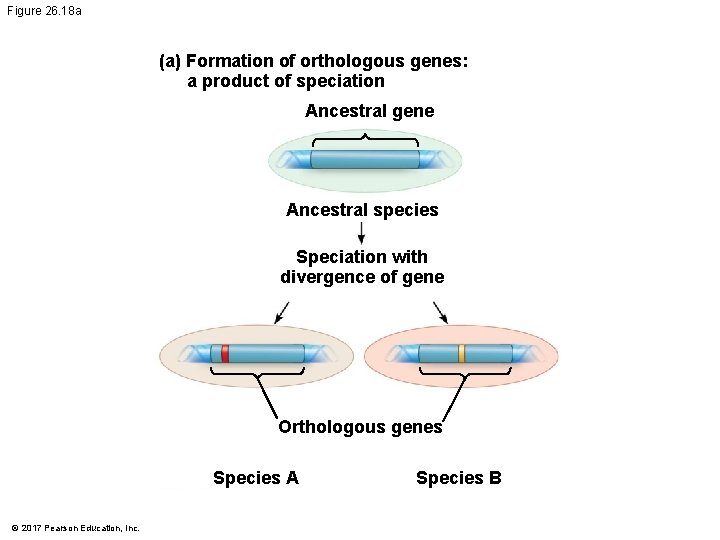
§ Orthologous genes are found in a single copy in the genome and are homologous between species § They can diverge only after speciation occurs © 2017 Pearson Education, Inc.
Figure 26. 18 a (a) Formation of orthologous genes: a product of speciation Ancestral gene Ancestral species Speciation with divergence of gene Orthologous genes Species A © 2017 Pearson Education, Inc. Species B
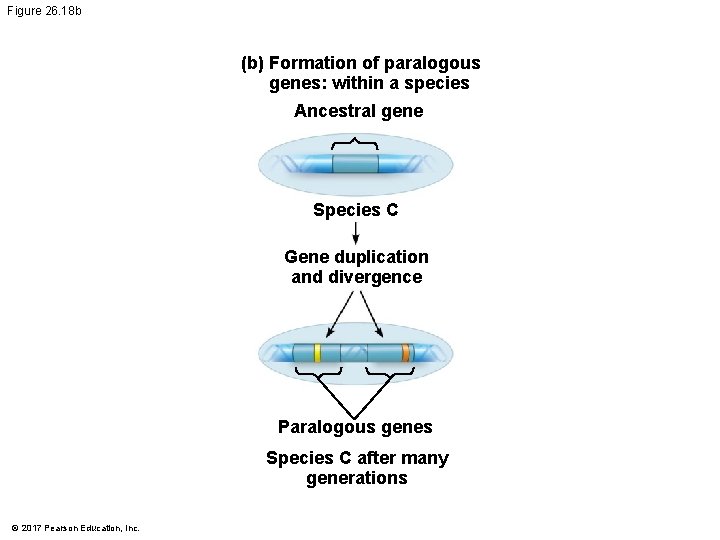
§ Paralogous genes result from gene duplication so are found in more than one copy in the genome § They can diverge within the species that carries them and often evolve new functions © 2017 Pearson Education, Inc.
Figure 26. 18 b (b) Formation of paralogous genes: within a species Ancestral gene Species C Gene duplication and divergence Paralogous genes Species C after many generations © 2017 Pearson Education, Inc.
Genome Evolution § Orthologous genes are widespread and extend across many widely varied species § For example, humans and mice diverged about 65 million years ago, and 99% of our genes are orthologous © 2017 Pearson Education, Inc.
§ Gene number and the complexity of an organism are not strongly linked § For example, humans have only four times as many genes as yeast, a single-celled eukaryote § Genes in complex organisms appear to be very versatile, and each gene can encode multiple proteins that perform many different functions © 2017 Pearson Education, Inc.
Concept 26. 5: Molecular clocks help track evolutionary time § To extend phylogenies beyond the fossil record, we must make an assumption about how molecular change occurs over time © 2017 Pearson Education, Inc.
Molecular Clocks § A molecular clock uses constant rates of evolution in some genes to estimate the absolute time of evolutionary change § In orthologous genes, nucleotide substitutions are assumed to be proportional to the time since they last shared a common ancestor § In paralogous genes, nucleotide substitutions are proportional to the time since the genes became duplicated © 2017 Pearson Education, Inc.
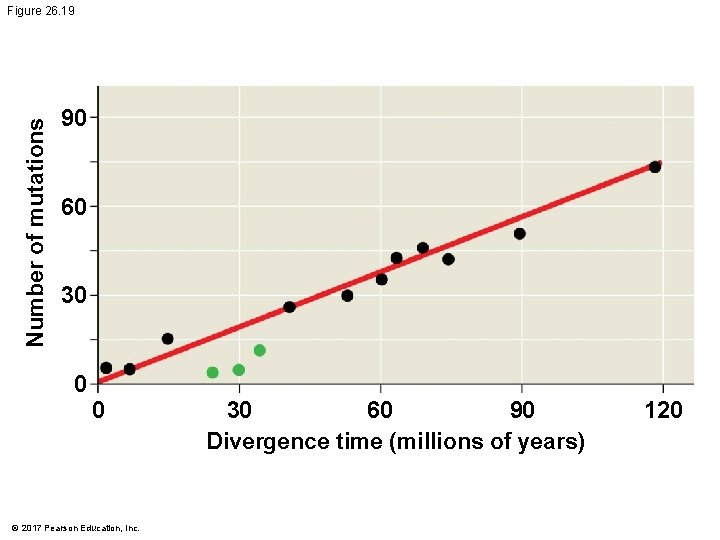
§ Molecular clocks are calibrated against branches whose dates are known from the fossil record § Individual genes vary in how clocklike they are © 2017 Pearson Education, Inc.
Number of mutations Figure 26. 19 90 60 30 0 0 © 2017 Pearson Education, Inc. 30 60 90 Divergence time (millions of years) 120
Differences in Clock Speed § If most of the evolutionary change in genes and proteins has no effect on fitness, then the rate of molecular change should be regular, like a clock § Differences in clock rate for different genes are a function of the importance of the gene and how critical the specific amino acid is to protein function © 2017 Pearson Education, Inc.
Potential Problems with Molecular Clocks § The molecular clock does not run as smoothly as expected if mutations were neutral § Irregularities result from natural selection in which some DNA changes are favored over others § Estimates of evolutionary divergences older than the fossil record have a high degree of uncertainty § The use of multiple genes or genes that evolved in different taxa may improve estimates © 2017 Pearson Education, Inc.
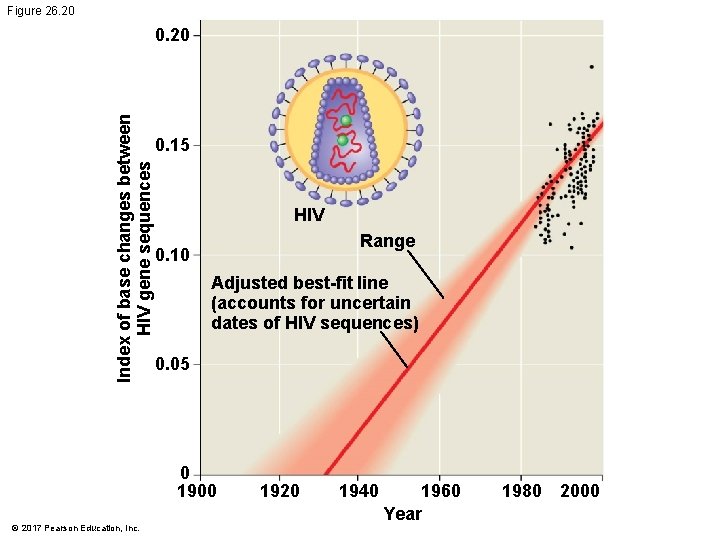
Applying a Molecular Clock: Dating the Origin of HIV § Phylogenetic analysis shows that HIV is descended from viruses that infect chimpanzees and other primates § HIV spread to humans more than once § Comparison of HIV samples shows that the virus evolved in a very clocklike way © 2017 Pearson Education, Inc.
§ Application of a molecular clock to one strain of HIV suggests that the strain spread to humans during the 1930 s § A more advanced molecular clock approach estimated the first spread to humans around 1910 © 2017 Pearson Education, Inc.
Figure 26. 20 Index of base changes between HIV gene sequences 0. 20 0. 15 HIV Range 0. 10 Adjusted best-fit line (accounts for uncertain dates of HIV sequences) 0. 05 0 1900 © 2017 Pearson Education, Inc. 1920 1940 1960 Year 1980 2000
Concept 26. 6: Our understanding of the tree of life continues to change based on new data § Recently, we have gained insight into the very deepest branches of the tree of life through molecular systematics © 2017 Pearson Education, Inc.
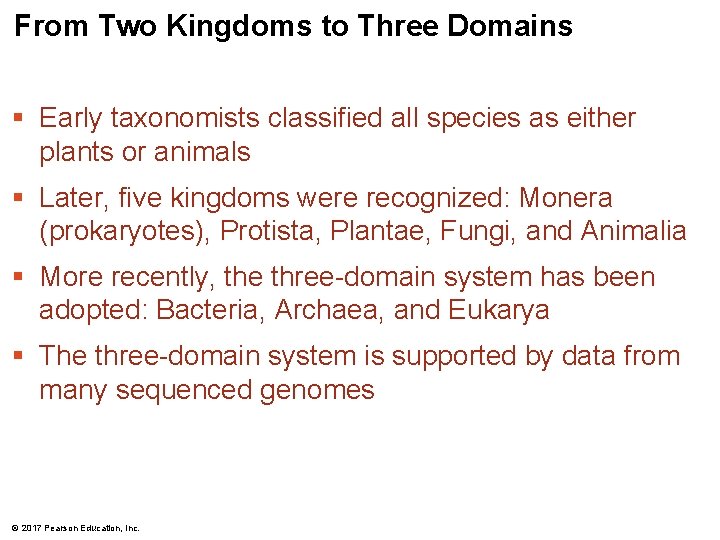
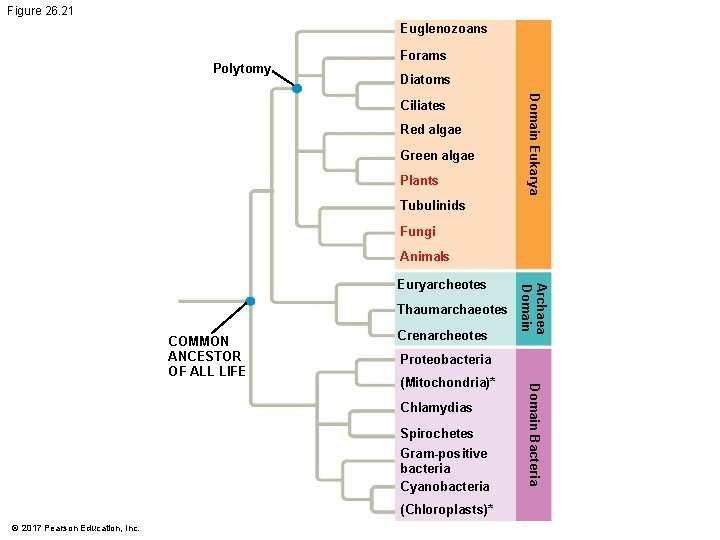
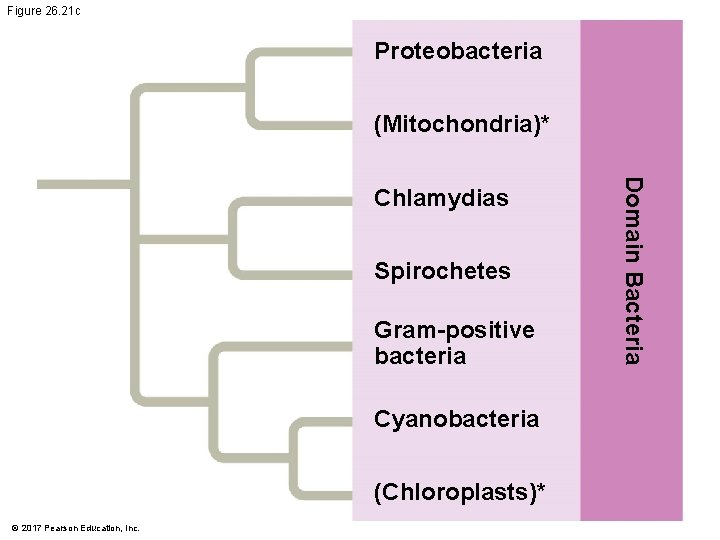
From Two Kingdoms to Three Domains § Early taxonomists classified all species as either plants or animals § Later, five kingdoms were recognized: Monera (prokaryotes), Protista, Plantae, Fungi, and Animalia § More recently, the three-domain system has been adopted: Bacteria, Archaea, and Eukarya § The three-domain system is supported by data from many sequenced genomes © 2017 Pearson Education, Inc.
Figure 26. 21 Euglenozoans Polytomy Forams Diatoms Red algae Green algae Plants Domain Eukarya Ciliates Tubulinids Fungi Animals Thaumarchaeotes COMMON ANCESTOR OF ALL LIFE Crenarcheotes Proteobacteria Spirochetes Gram-positive bacteria Cyanobacteria (Chloroplasts)* Domain Bacteria (Mitochondria)* Chlamydias © 2017 Pearson Education, Inc. Archaea Domain Euryarcheotes
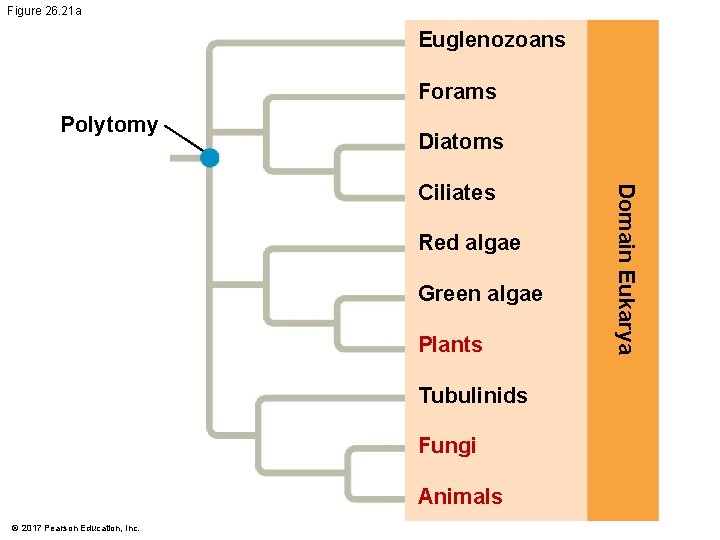
Figure 26. 21 a Euglenozoans Forams Polytomy Diatoms Red algae Green algae Plants Tubulinids Fungi Animals © 2017 Pearson Education, Inc. Domain Eukarya Ciliates
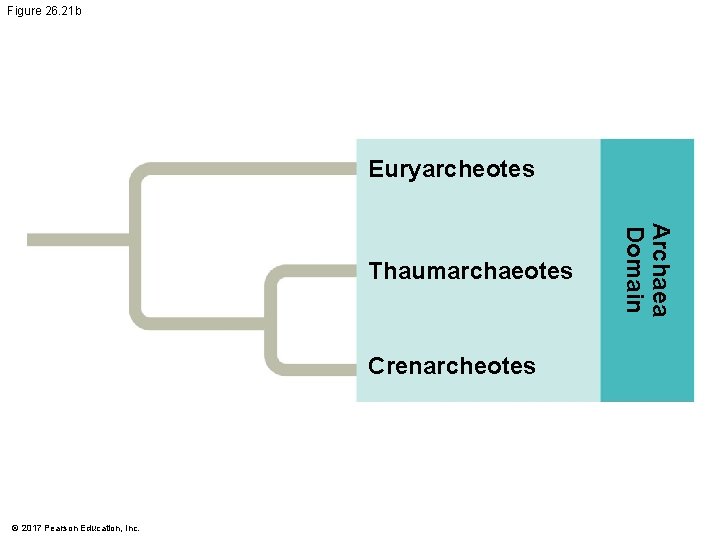
Figure 26. 21 b Euryarcheotes Crenarcheotes © 2017 Pearson Education, Inc. Archaea Domain Thaumarchaeotes
Figure 26. 21 c Proteobacteria (Mitochondria)* Spirochetes Gram-positive bacteria Cyanobacteria (Chloroplasts)* © 2017 Pearson Education, Inc. Domain Bacteria Chlamydias
The Important Role of Horizontal Gene Transfer § The tree of life suggests that eukaryotes and archaea are more closely related to each other than to bacteria § The tree of life is based largely on r. RNA genes; however, some other genes reveal different relationships © 2017 Pearson Education, Inc.
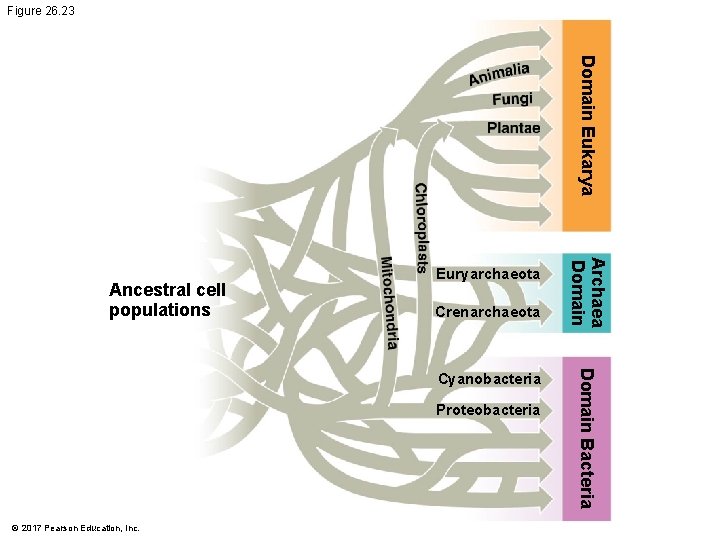
§ There have been substantial interchanges of genes between organisms in different domains § Horizontal gene transfer is the movement of genes from one genome to another § Horizontal gene transfer occurs by exchange of transposable elements and plasmids, viral infection, and possibly fusion of organisms © 2017 Pearson Education, Inc.
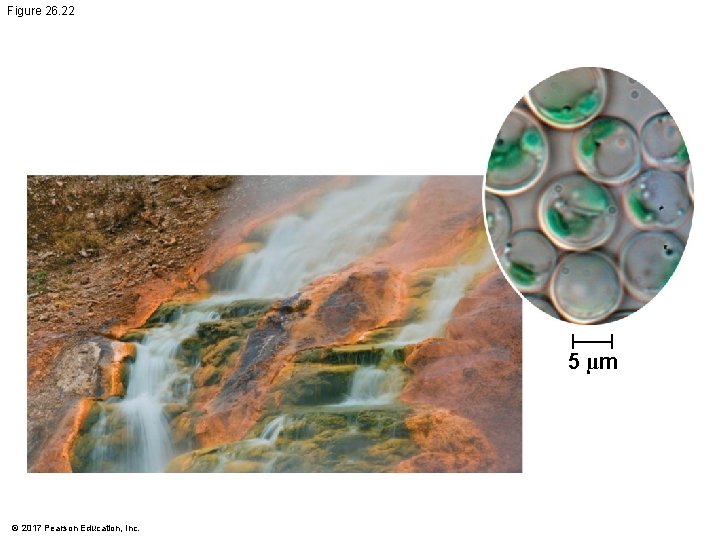
§ Disparities between gene trees can be explained by the occurrence of horizontal gene transfer § Horizontal gene transfer has played a key role in the evolution of both prokaryotes and eukaryotes § Eukaryotes can acquire nuclear genes from bacteria and archaea § For example, the alga Galdieria sulphuraria acquired about 5% of its genes from bacterial and archaeal species © 2017 Pearson Education, Inc.
Figure 26. 22 5 µm © 2017 Pearson Education, Inc.
§ Some biologists argue that horizontal gene transfer was so common that the early history of life should be represented as a tangled network of connected branches © 2017 Pearson Education, Inc.
Figure 26. 23 Domain Eukarya Crenarchaeota Proteobacteria © 2017 Pearson Education, Inc. Domain Bacteria Cyanobacteria Archaea Domain Ancestral cell populations Euryarchaeota
Figure 26. UN 06 © 2017 Pearson Education, Inc.
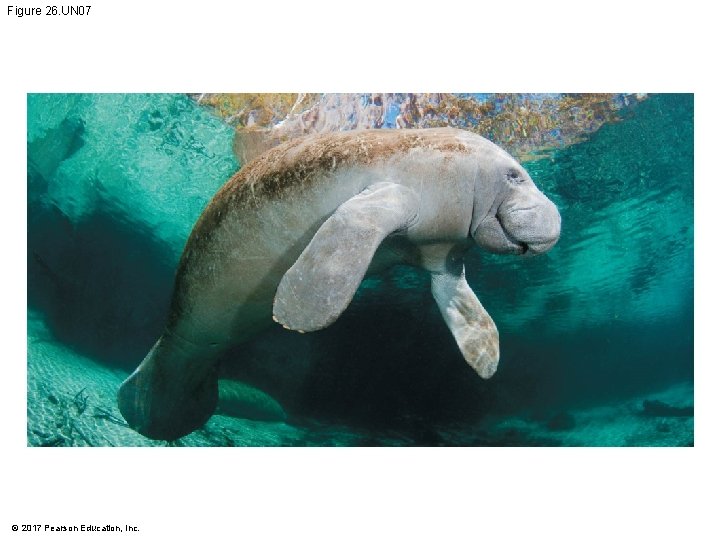
Figure 26. UN 07 © 2017 Pearson Education, Inc.