Chapter 25 Performance Analysis Factors that affect Performance
- Slides: 11

Chapter 25 Performance Analysis

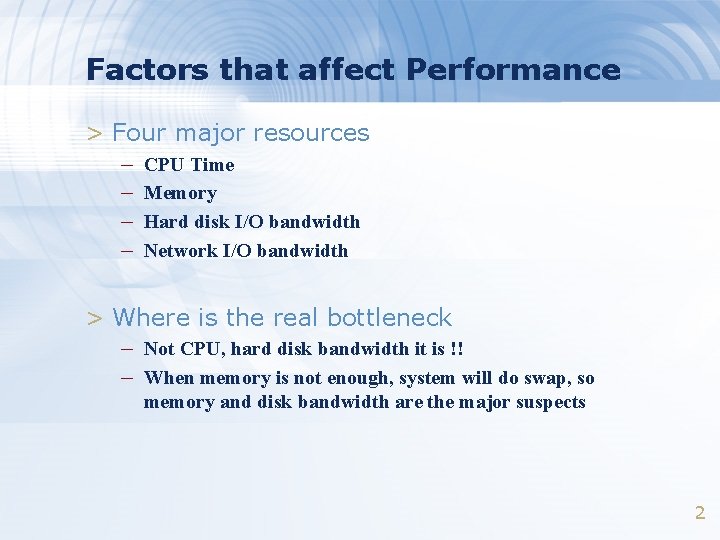
Factors that affect Performance > Four major resources – CPU Time – Memory – Hard disk I/O bandwidth – Network I/O bandwidth > Where is the real bottleneck – Not CPU, hard disk bandwidth it is !! – When memory is not enough, system will do swap, so memory and disk bandwidth are the major suspects 2

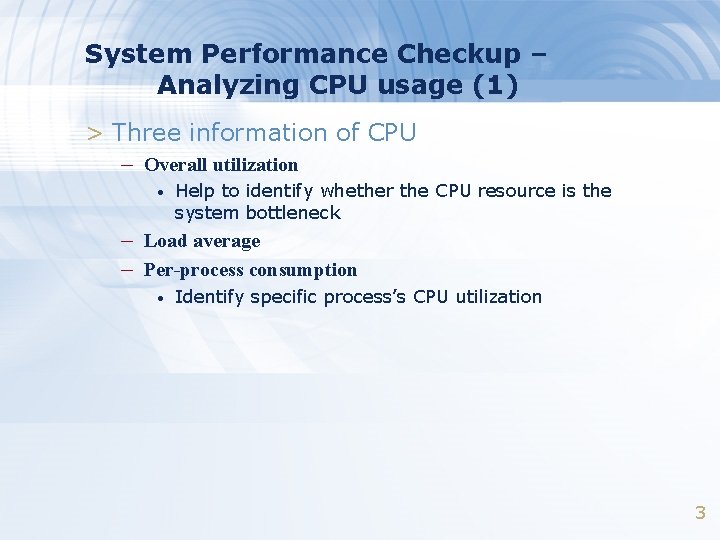
System Performance Checkup – Analyzing CPU usage (1) > Three information of CPU – Overall utilization • Help to identify whether the CPU resource is the system bottleneck – Load average – Per-process consumption • Identify specific process’s CPU utilization 3

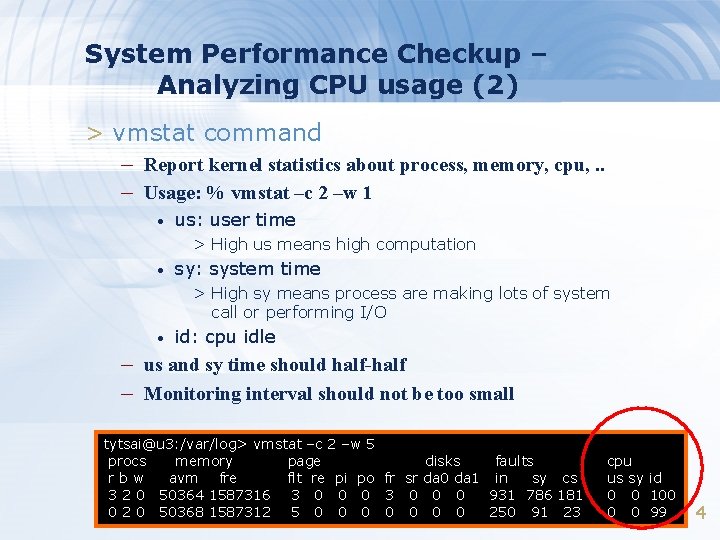
System Performance Checkup – Analyzing CPU usage (2) > vmstat command – Report kernel statistics about process, memory, cpu, . . – Usage: % vmstat –c 2 –w 1 • us: user time > High us means high computation • sy: system time > High sy means process are making lots of system call or performing I/O • id: cpu idle – us and sy time should half-half – Monitoring interval should not be too small tytsai@u 3: /var/log> vmstat –c 2 –w 5 procs memory page rbw avm fre flt re pi po fr sr 3 2 0 50364 1587316 3 0 0 0 3 0 0 2 0 50368 1587312 5 0 0 0 disks faults da 0 da 1 in sy cs 0 0 931 786 181 0 0 250 91 23 cpu us sy id 0 0 100 0 0 99 4

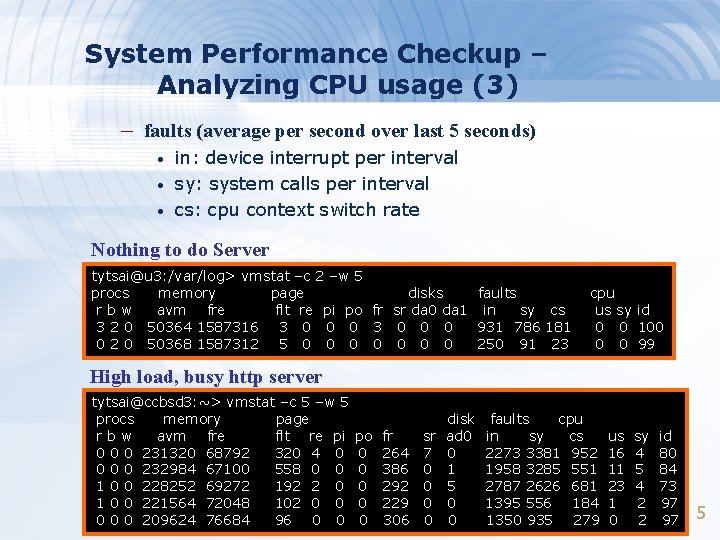
System Performance Checkup – Analyzing CPU usage (3) – faults (average per second over last 5 seconds) • • • in: device interrupt per interval sy: system calls per interval cs: cpu context switch rate Nothing to do Server tytsai@u 3: /var/log> vmstat –c 2 –w 5 procs memory page disks faults rbw avm fre flt re pi po fr sr da 0 da 1 in sy cs 3 2 0 50364 1587316 3 0 0 0 931 786 181 0 2 0 50368 1587312 5 0 0 0 0 250 91 23 cpu us sy id 0 0 100 0 0 99 High load, busy http server tytsai@ccbsd 3: ~> vmstat –c 5 –w 5 procs memory page rbw avm fre flt re pi 0 0 0 231320 68792 320 4 0 0 232984 67100 558 0 0 1 0 0 228252 69272 192 2 0 1 0 0 221564 72048 102 0 0 0 209624 76684 96 0 0 po 0 0 0 fr 264 386 292 229 306 sr 7 0 0 disk ad 0 0 1 5 0 0 faults cpu in sy cs 2273 3381 952 1958 3285 551 2787 2626 681 1395 556 184 1350 935 279 us 16 11 23 1 0 sy 4 5 4 2 2 id 80 84 73 97 97 5

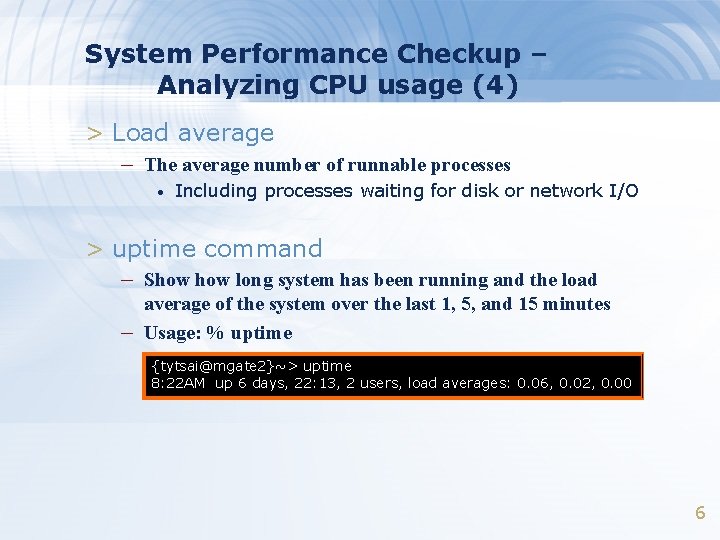
System Performance Checkup – Analyzing CPU usage (4) > Load average – The average number of runnable processes • Including processes waiting for disk or network I/O > uptime command – Show long system has been running and the load – average of the system over the last 1, 5, and 15 minutes Usage: % uptime {tytsai@mgate 2}~> uptime 8: 22 AM up 6 days, 22: 13, 2 users, load averages: 0. 06, 0. 02, 0. 00 6

System Performance Checkup – Analyzing CPU usage (5) > top command – Display and update information about the top cpu processes > ps command – Show process status See Chapter 4 pp. 18 ~ 23 7

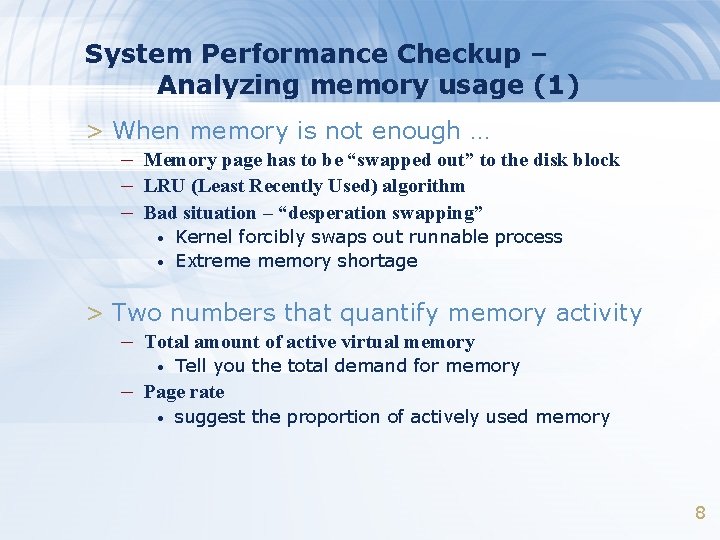
System Performance Checkup – Analyzing memory usage (1) > When memory is not enough … – Memory page has to be “swapped out” to the disk block – LRU (Least Recently Used) algorithm – Bad situation – “desperation swapping” • • Kernel forcibly swaps out runnable process Extreme memory shortage > Two numbers that quantify memory activity – Total amount of active virtual memory • Tell you the total demand for memory – Page rate • suggest the proportion of actively used memory 8

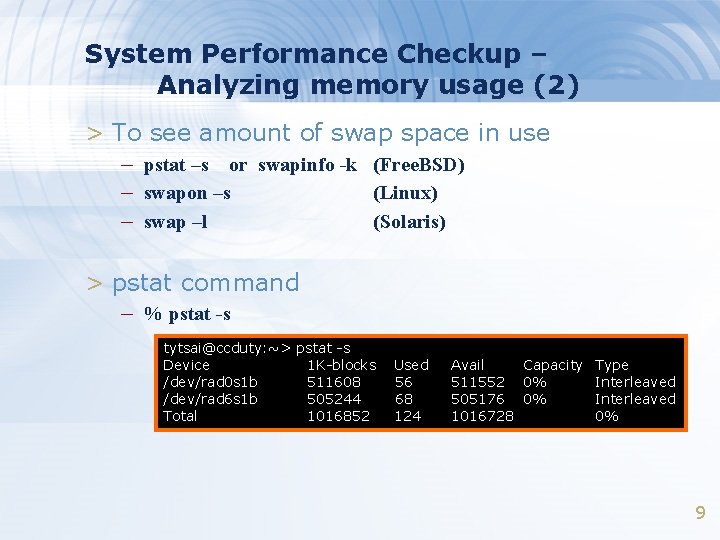
System Performance Checkup – Analyzing memory usage (2) > To see amount of swap space in use – pstat –s or swapinfo -k (Free. BSD) – swapon –s (Linux) – swap –l (Solaris) > pstat command – % pstat -s tytsai@ccduty: ~> pstat -s Device 1 K-blocks /dev/rad 0 s 1 b 511608 /dev/rad 6 s 1 b 505244 Total 1016852 Used 56 68 124 Avail Capacity Type 511552 0% Interleaved 505176 0% Interleaved 1016728 0% 9

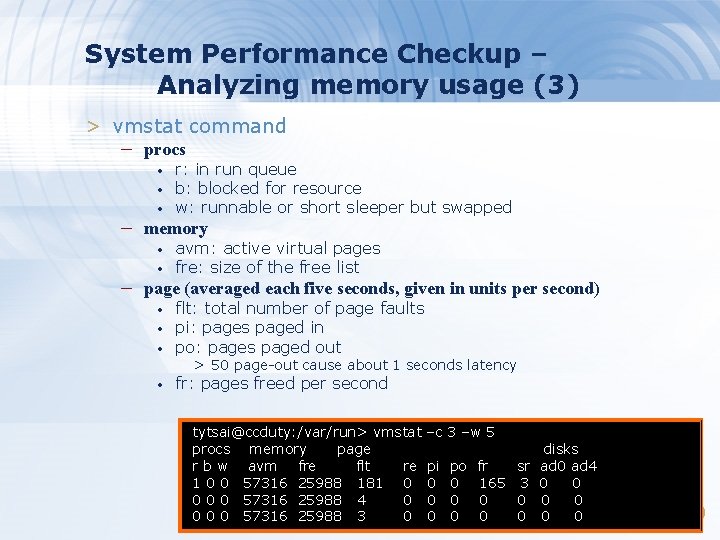
System Performance Checkup – Analyzing memory usage (3) > vmstat command – procs • • • r: in run queue b: blocked for resource w: runnable or short sleeper but swapped – memory • • avm: active virtual pages fre: size of the free list – page (averaged each five seconds, given in units per second) • flt: total number of page faults pi: pages paged in po: pages paged out • fr: pages freed per second • • > 50 page-out cause about 1 seconds latency tytsai@ccduty: /var/run> vmstat procs memory page r b w avm fre flt re 1 0 0 57316 25988 181 0 0 57316 25988 4 0 0 57316 25988 3 0 –c 3 –w 5 pi 0 0 0 po 0 0 0 fr sr 165 3 0 0 disks ad 0 ad 4 0 0 0 10

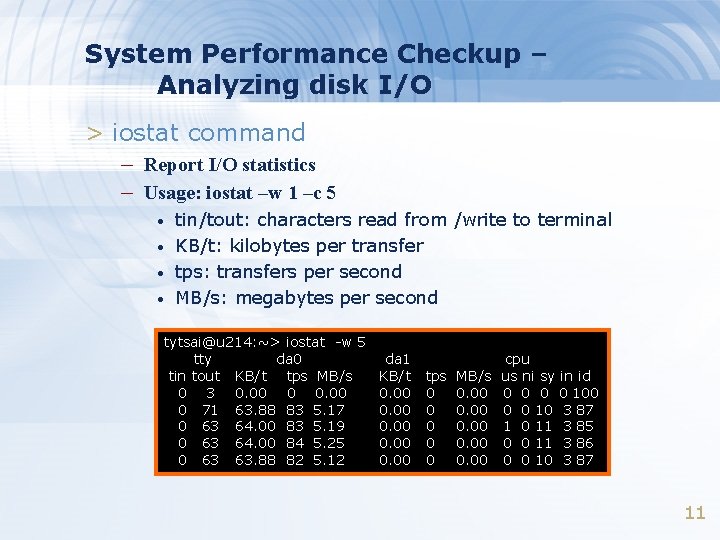
System Performance Checkup – Analyzing disk I/O > iostat command – Report I/O statistics – Usage: iostat –w 1 –c 5 • • tin/tout: characters read from /write to terminal KB/t: kilobytes per transfer tps: transfers per second MB/s: megabytes per second tytsai@u 214: ~> iostat -w 5 tty da 0 da 1 tin tout KB/t tps MB/s 0 3 0. 00 0 71 63. 88 83 5. 17 0. 00 0 63 64. 00 83 5. 19 0. 00 0 63 64. 00 84 5. 25 0. 00 0 63 63. 88 82 5. 12 0. 00 0 0. 00 cpu us ni sy in id 0 0 100 0 0 10 3 87 1 0 11 3 85 0 0 11 3 86 0 0 10 3 87 11