
Chapter 24 Capital Investment Analysis Objectives 1 Explain
Chapter 24 - Capital Investment Analysis Objectives 1. Explain the nature and importance of capital investment analysis. 2. Evaluate capital investment proposals, using the following methods: average rate of return, cash payback, net present value, and internal rate of return. 3. List and describe factors that complicate capital investment analysis.
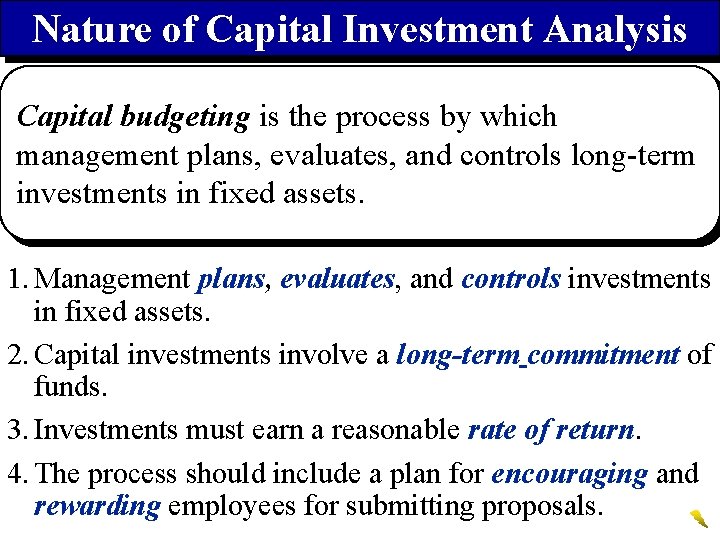
Nature of Capital Investment Analysis Capital budgeting is the process by which management plans, evaluates, and controls long-term investments in fixed assets. 1. Management plans, evaluates, and controls investments in fixed assets. 2. Capital investments involve a long-term commitment of funds. 3. Investments must earn a reasonable rate of return. 4. The process should include a plan for encouraging and rewarding employees for submitting proposals.

Methods of Evaluating Capital Investment Proposals Here’s a survey of business practices in a variety of industries. It reports the capital investment analysis methods used by large U. S. companies.
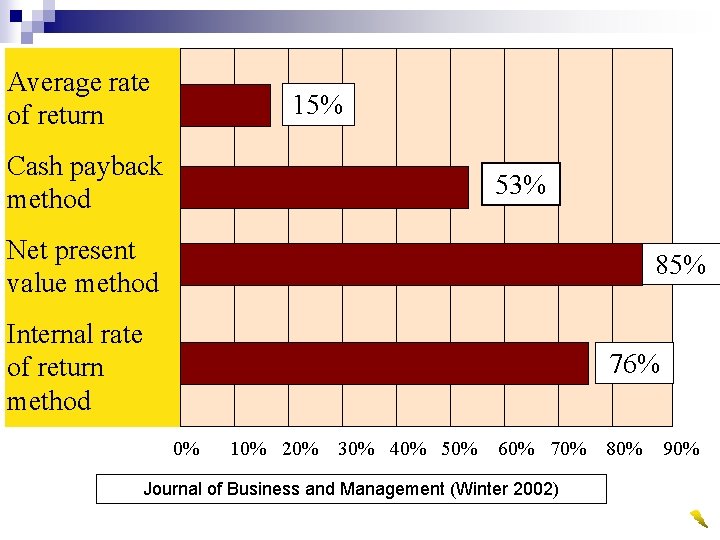
Average rate of return 15% Cash payback method 53% Net present value method 85% Internal rate of return method 76% 0% 10% 20% 30% 40% 50% 60% 70% Journal of Business and Management (Winter 2002) 80% 90%
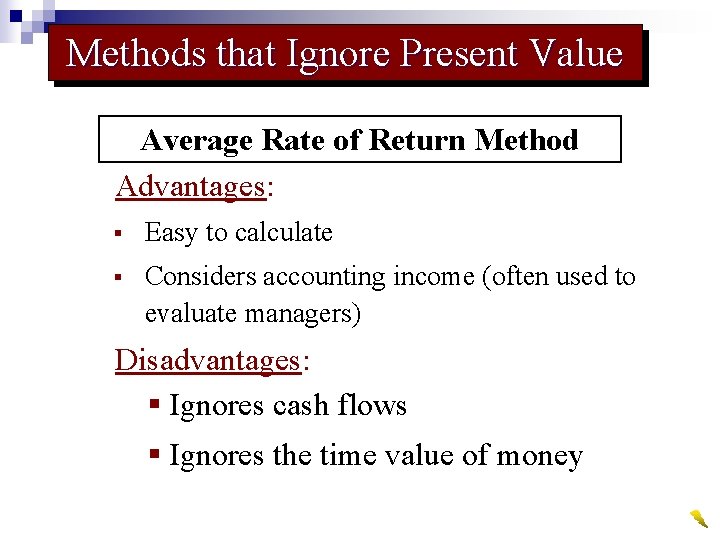
Methods that Ignore Present Value Average Rate of Return Method Advantages: § Easy to calculate § Considers accounting income (often used to evaluate managers) Disadvantages: § Ignores cash flows § Ignores the time value of money
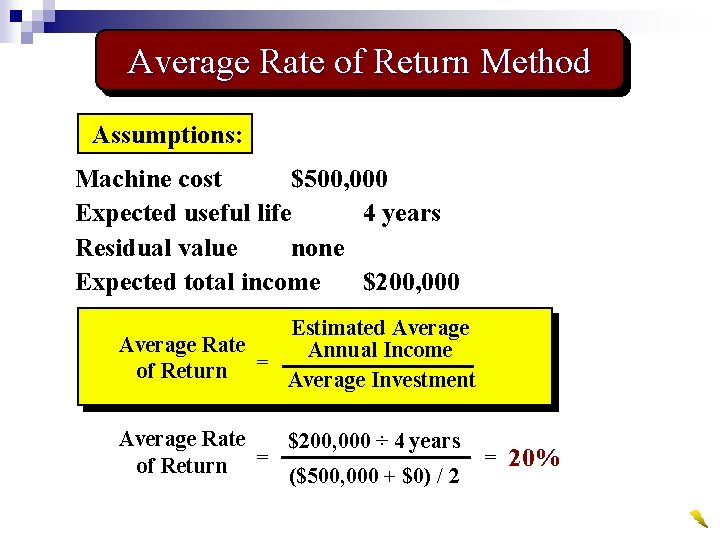
Average Rate of Return Method Assumptions: Machine cost $500, 000 Expected useful life 4 years Residual value none Expected total income $200, 000 Estimated Average Rate Annual Income = of Return Average Investment Average Rate $200, 000 ÷ 4 years of Return = ($500, 000 + $0) / 2 = 20%
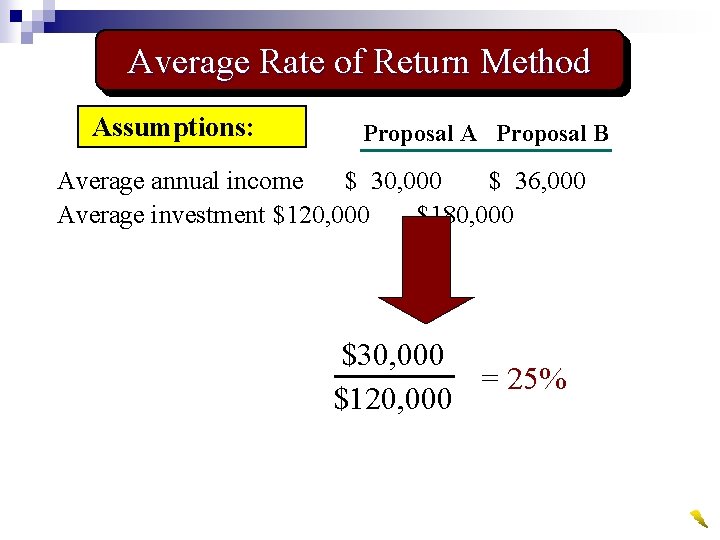
Average Rate of Return Method Assumptions: Proposal A Proposal B Average annual income $ 30, 000 $ 36, 000 Average investment $120, 000 $180, 000 $30, 000 = 25% $120, 000
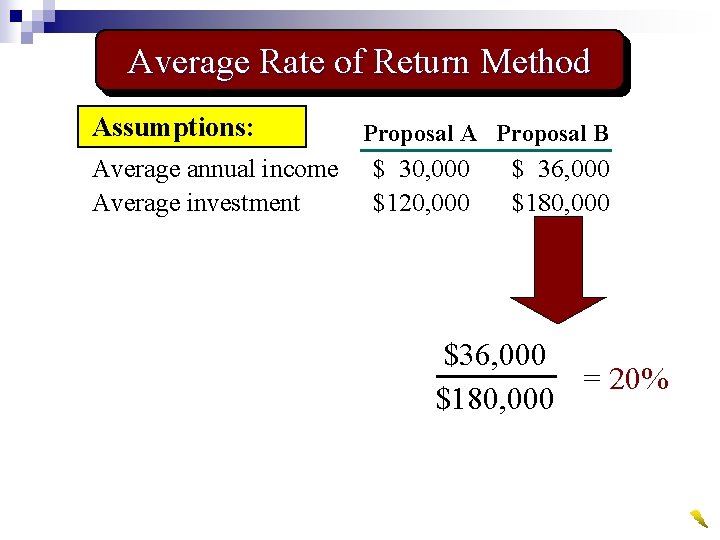
Average Rate of Return Method Assumptions: Average annual income Average investment Proposal A Proposal B $ 30, 000 $120, 000 $ 36, 000 $180, 000 $36, 000 = 20% $180, 000
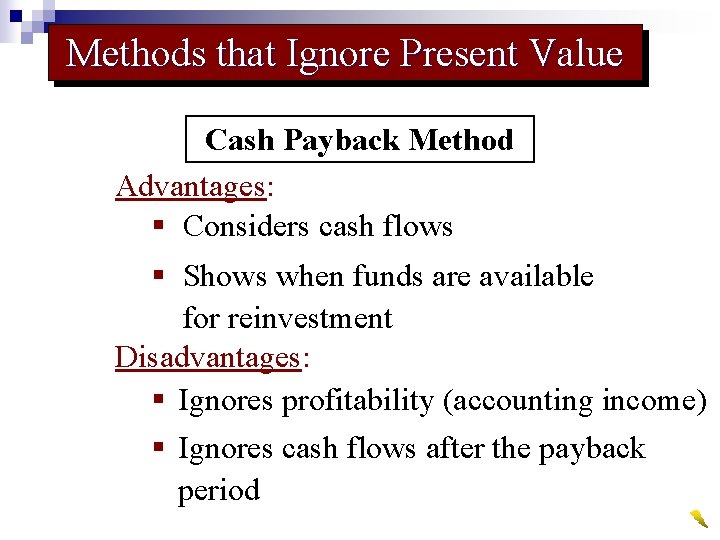
Methods that Ignore Present Value Cash Payback Method Advantages: § Considers cash flows § Shows when funds are available for reinvestment Disadvantages: § Ignores profitability (accounting income) § Ignores cash flows after the payback period
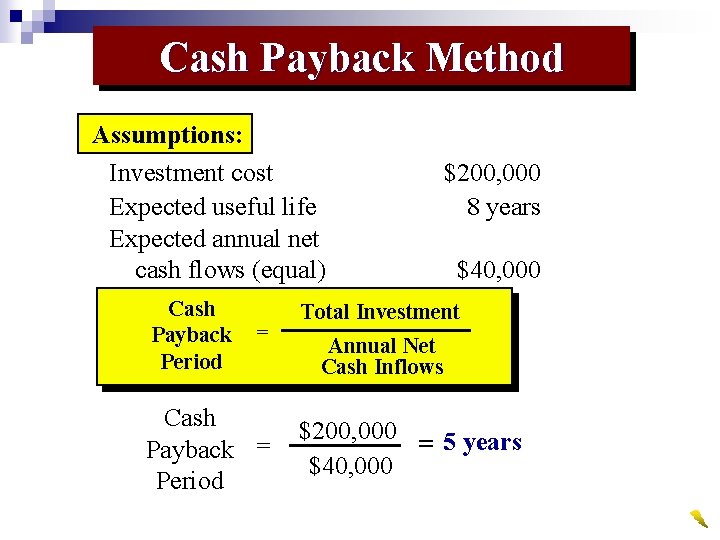
Cash Payback Method Assumptions: Investment cost Expected useful life Expected annual net cash flows (equal) Cash Payback Period = Cash Payback = Period $200, 000 8 years $40, 000 Total Investment Annual Net Cash Inflows $200, 000 = 5 years $40, 000
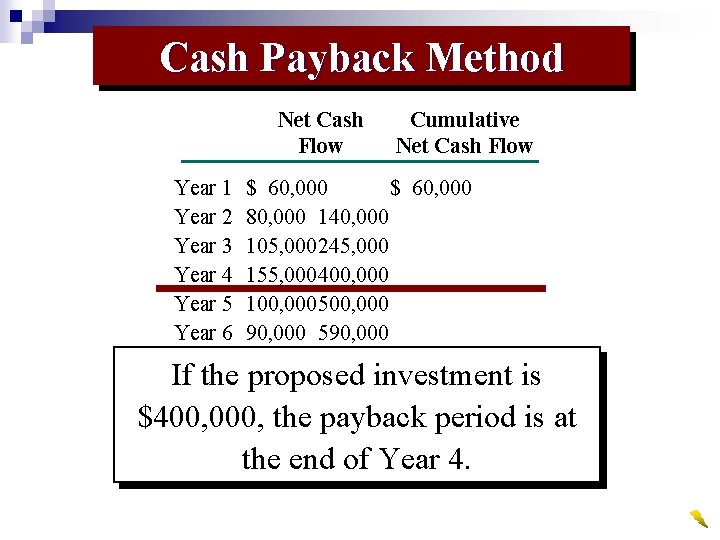
Cash Payback Method Net Cash Flow Year 1 Year 2 Year 3 Year 4 Year 5 Year 6 Cumulative Net Cash Flow $ 60, 000 80, 000 140, 000 105, 000245, 000 155, 000400, 000 100, 000500, 000 90, 000 590, 000 If the proposed investment is $400, 000, the payback period is at the end of Year 4.
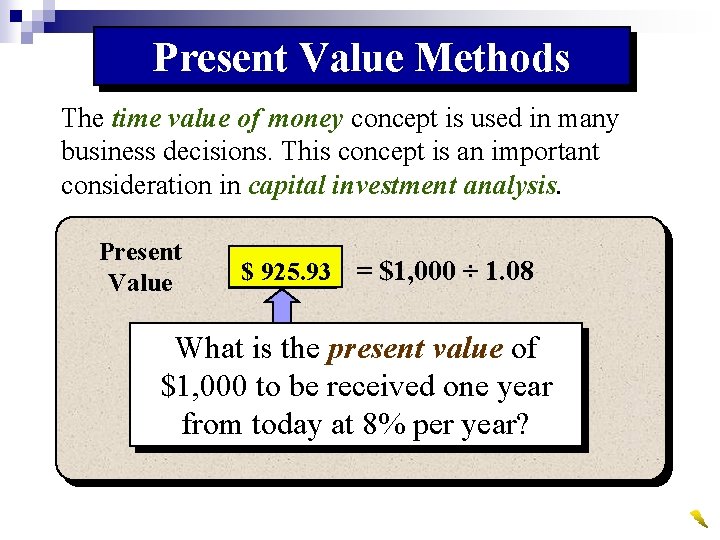
Present Value Methods The time value of money concept is used in many business decisions. This concept is an important consideration in capital investment analysis. Present Value ? ? = $1, 000 ÷ 1. 08 $$925. 93 What is the present value of $1, 000 to be received one year from today at 8% per year?
Present Value Methods How much would have to be invested on February 1, 2006 in order to receive $1, 000 on February 1, 2009 if the interest rate compounded annually is 12%?
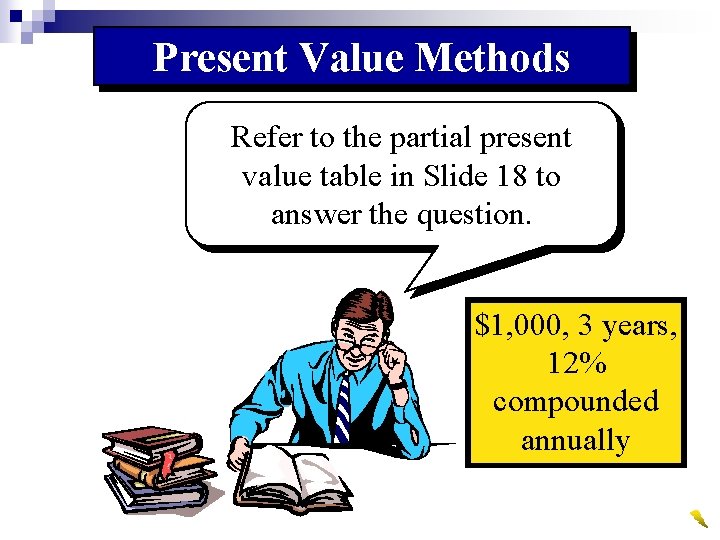
Present Value Methods Refer to the partial present value table in Slide 18 to answer the question. $1, 000, 3 years, 12% compounded annually
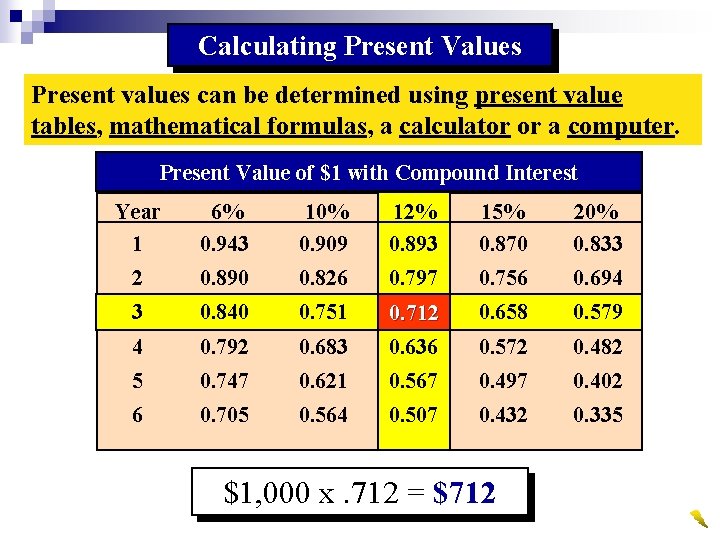
Calculating Present Values Present values can be determined using present value tables, mathematical formulas, a calculator or a computer. Present Value of $1 with Compound Interest Year 1 6% 0. 943 10% 0. 909 12% 0. 893 15% 0. 870 20% 0. 833 2 0. 890 0. 826 0. 797 0. 756 0. 694 3 0. 840 0. 751 0. 658 0. 579 4 0. 792 0. 683 0. 712 0. 636 0. 572 0. 482 5 0. 747 0. 621 0. 567 0. 497 0. 402 6 0. 705 0. 564 0. 507 0. 432 0. 335 $1, 000 x. 712 = $712
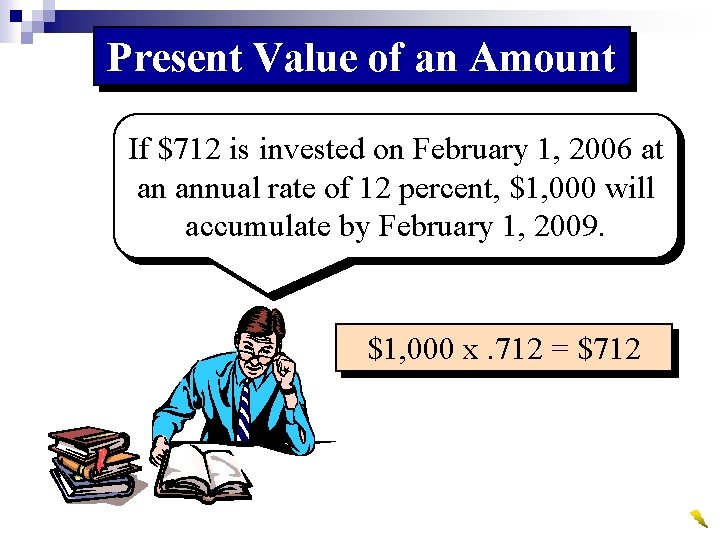
Present Value of an Amount If $712 is invested on February 1, 2006 at an annual rate of 12 percent, $1, 000 will accumulate by February 1, 2009. $1, 000 x. 712 = $712
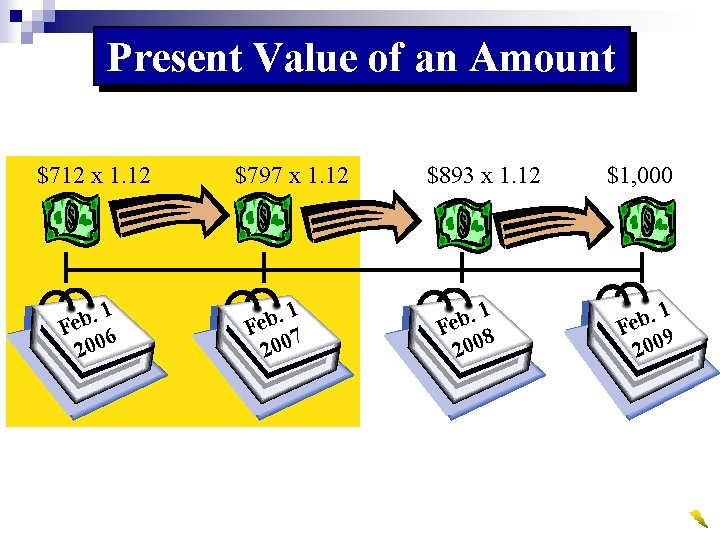
Present Value of an Amount $712 x 1. 12 . 1 b e F 6 200 $797 x 1. 12 . 1 b e F 7 200 $893 x 1. 12 . 1 b e F 8 200 $1, 000 . 1 b e F 9 200
Present Value of an Annuity An annuity is a series of equal net cash flows at fixed time intervals. The present value of an annuity is the sum of the present values of each cash flows. What would be the present value of a $100 annuity for five periods at 12?
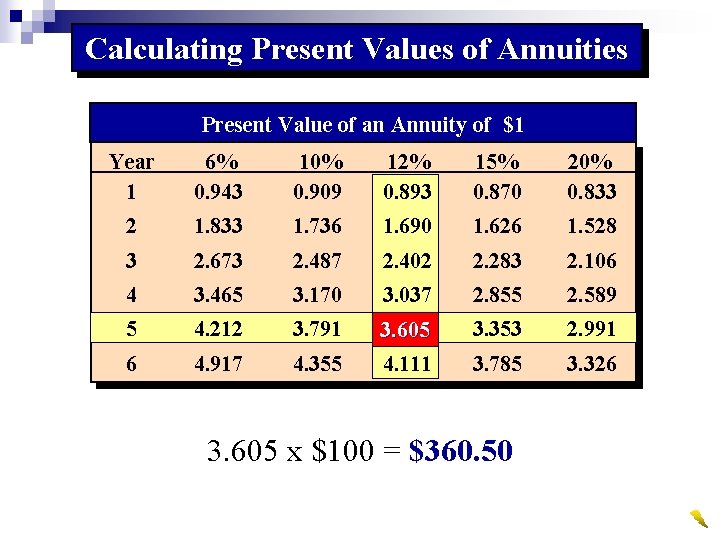
Calculating Present Values of Annuities Present Value of an Annuity of $1 Year 1 6% 0. 943 10% 0. 909 12% 0. 893 15% 0. 870 20% 0. 833 2 1. 833 1. 736 1. 690 1. 626 1. 528 3 2. 673 2. 487 2. 402 2. 283 2. 106 4 3. 465 3. 170 3. 037 2. 855 2. 589 5 4. 212 3. 791 3. 353 2. 991 6 4. 917 4. 355 3. 605 4. 111 3. 785 3. 326 3. 605 x $100 = $360. 50

Net Present Value Method The net present value method analyzes capital investment proposals by comparing the initial cash investment with the present value of the net cash flows.
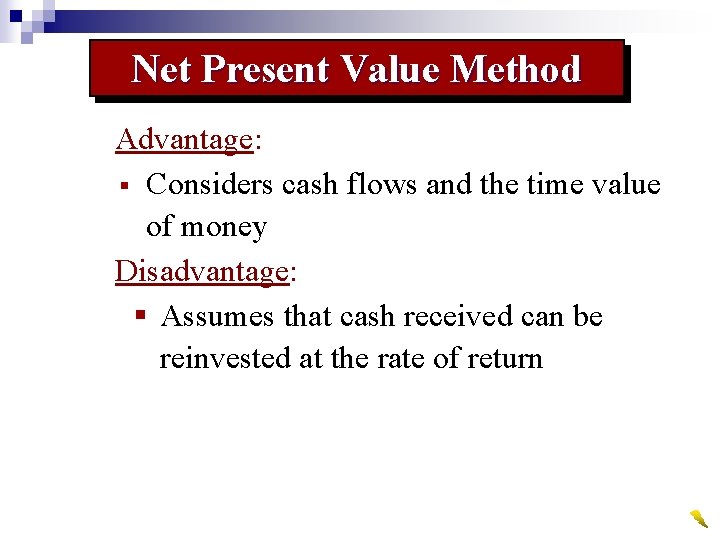
Net Present Value Method Advantage: § Considers cash flows and the time value of money Disadvantage: § Assumes that cash received can be reinvested at the rate of return
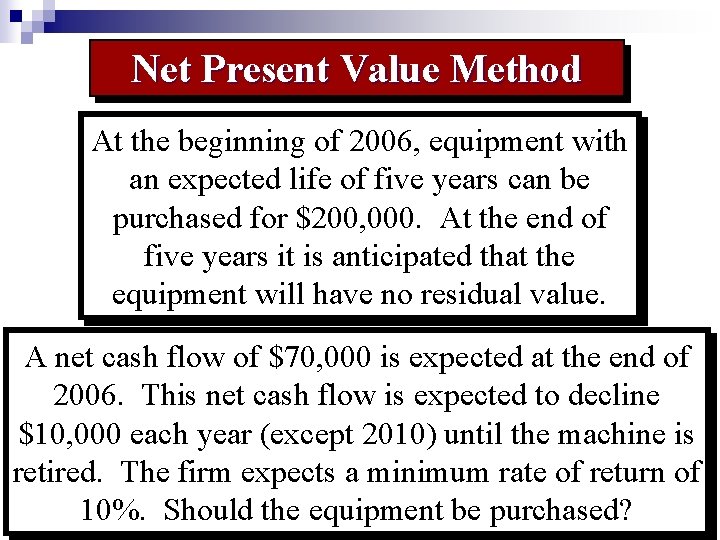
Net Present Value Method At the beginning of 2006, equipment with an expected life of five years can be Cash Flow Present Value purchased for $200, 000. At the end of five years it is anticipated that the equipment will have no residual value. A net cash flow of $70, 000 is expected at the end of 2006. This net cash flow is expected to decline $10, 000 each year (except 2010) until the machine is retired. The firm expects a minimum rate of return of 10%. Should the equipment be purchased?

Net Present Value Method First, we must determine which table to use… the present value of $1 or the present value of an annuity of $1.

Net Present Value Method Because there are multiple years of net cash flows, shouldn’t we use the present value of an annuity of $1?
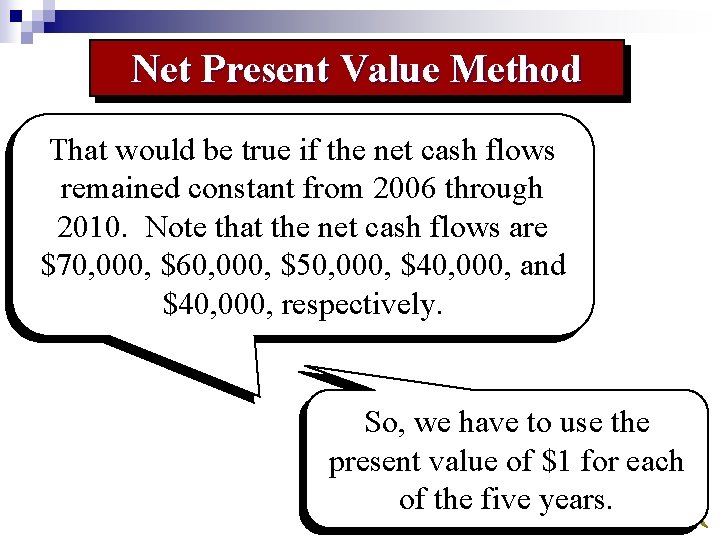
Net Present Value Method That would be true if the net cash flows remained constant from 2006 through 2010. Note that the net cash flows are $70, 000, $60, 000, $50, 000, $40, 000, and $40, 000, respectively. So, we have to use the present value of $1 for each of the five years.
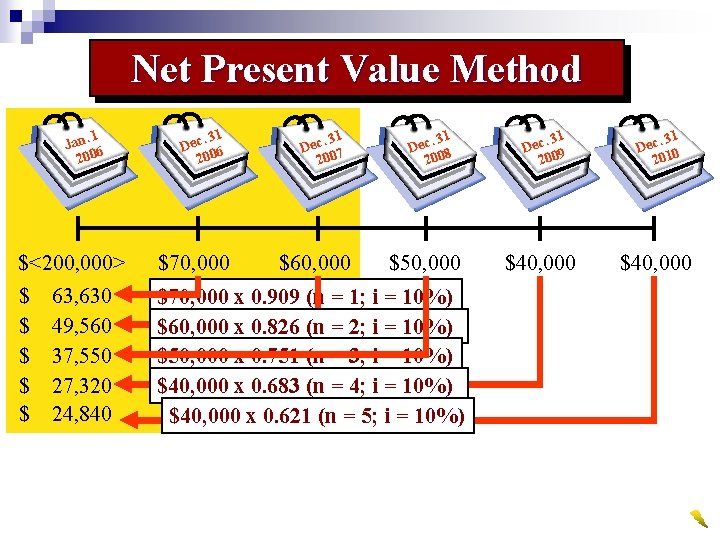
Net Present Value Method. 1 Jan 6 200 . 31 Dec 7 200 $<200, 000> $70, 000 $ $ $70, 000 x 0. 909 (n = 1; i = 10%) $60, 000 x 0. 826 (n = 2; i = 10%) $50, 000 x 0. 751 (n = 3; i = 10%) $40, 000 x 0. 683 (n = 4; i = 10%) $40, 000 x 0. 621 (n = 5; i = 10%) 63, 630 49, 560 37, 550 27, 320 24, 840 $60, 000 . 31 Dec 8 200 $50, 000 . 31 Dec 9 200 $40, 000 . 31 Dec 0 201 $40, 000
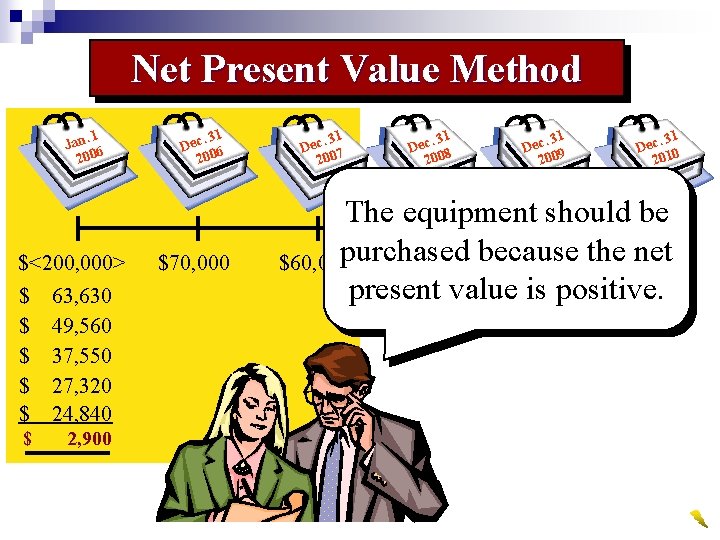
Net Present Value Method. 1 Jan 6 200 $<200, 000> $ $ $ 63, 630 49, 560 37, 550 27, 320 24, 840 $ 2, 900 . 31 Dec 6 200 $70, 000 . 31 Dec 7 200 . 31 Dec 8 200 . 31 Dec 9 200 . 31 Dec 0 201 The equipment should be net $60, 000 purchased $50, 000 because $40, 000 the$40, 000 present value is positive.

Net Present Value Method When capital investment funds are limited and the alternative proposals involve different amounts of investment, it is useful to prepare a ranking of the proposals using a present value index. (a. k. a. profitability index)
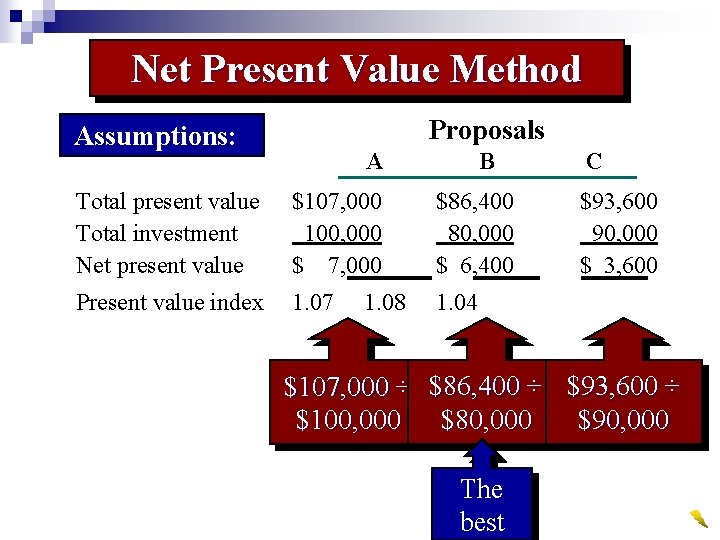
Net Present Value Method Proposals Assumptions: A B Total present value Total investment Net present value $107, 000 100, 000 $ 7, 000 $86, 400 80, 000 $ 6, 400 Present value index 1. 07 1. 04 1. 08 C $93, 600 90, 000 $ 3, 600 $107, 000 ÷ $86, 400 ÷ $93, 600 ÷ $90, 000 $100, 000 $80, 000 The best
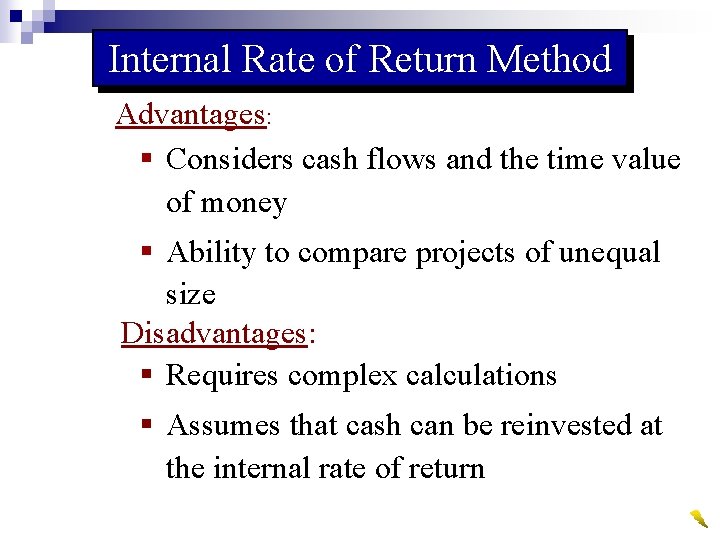
Internal Rate of Return Method Advantages: § Considers cash flows and the time value of money § Ability to compare projects of unequal size Disadvantages: § Requires complex calculations § Assumes that cash can be reinvested at the internal rate of return
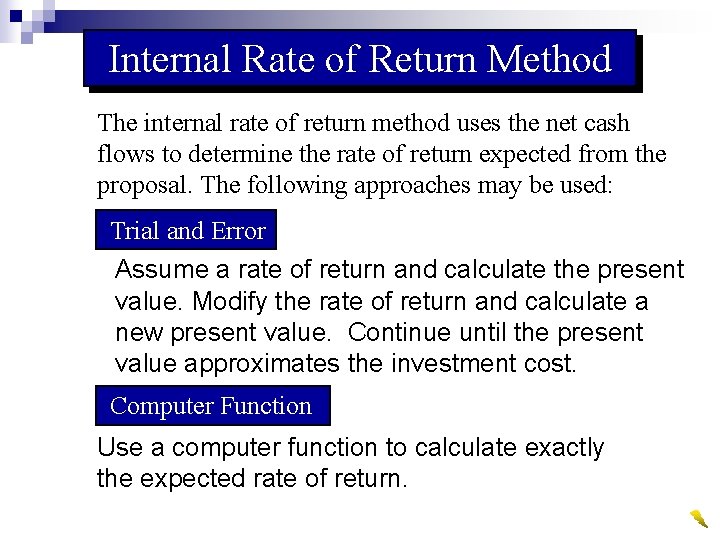
Internal Rate of Return Method The internal rate of return method uses the net cash flows to determine the rate of return expected from the proposal. The following approaches may be used: Trial and Error Assume a rate of return and calculate the present value. Modify the rate of return and calculate a new present value. Continue until the present value approximates the investment cost. Computer Function Use a computer function to calculate exactly the expected rate of return.
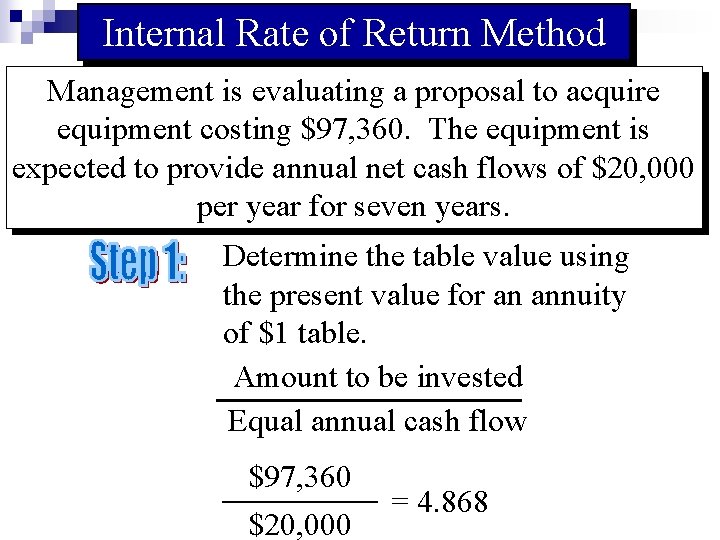
Internal Rate of Return Method Management is evaluating a proposal to acquire equipment costing $97, 360. The equipment is expected to provide annual net cash flows of $20, 000 per year for seven years. Determine the table value using the present value for an annuity of $1 table. Amount to be invested Equal annual cash flow $97, 360 $20, 000 = 4. 868
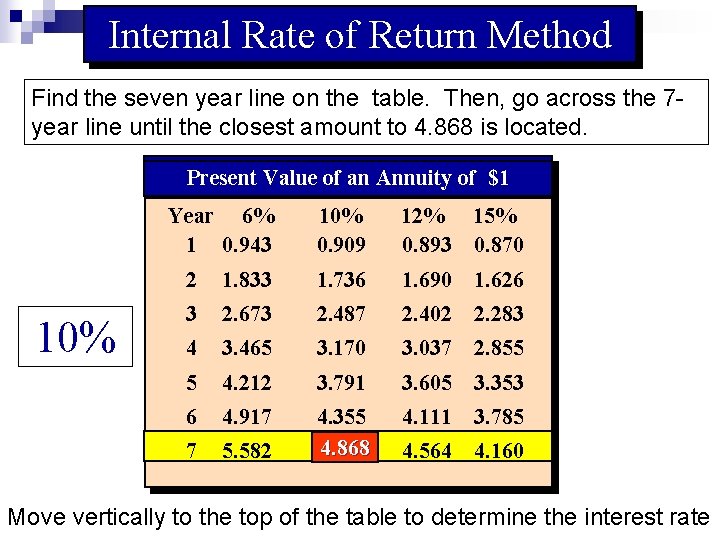
Internal Rate of Return Method Find the seven year line on the table. Then, go across the 7 year line until the closest amount to 4. 868 is located. Present Value of an Annuity of $1 Year 6% 1 0. 943 10% 0. 909 12% 15% 0. 893 0. 870 2 1. 833 1. 736 1. 690 1. 626 3 2. 673 2. 487 2. 402 2. 283 4 3. 465 3. 170 3. 037 2. 855 5 4. 212 3. 791 3. 605 3. 353 6 4. 917 4. 111 3. 785 7 5. 582 4. 355 4. 868 4. 564 4. 160 Move vertically to the top of the table to determine the interest rate
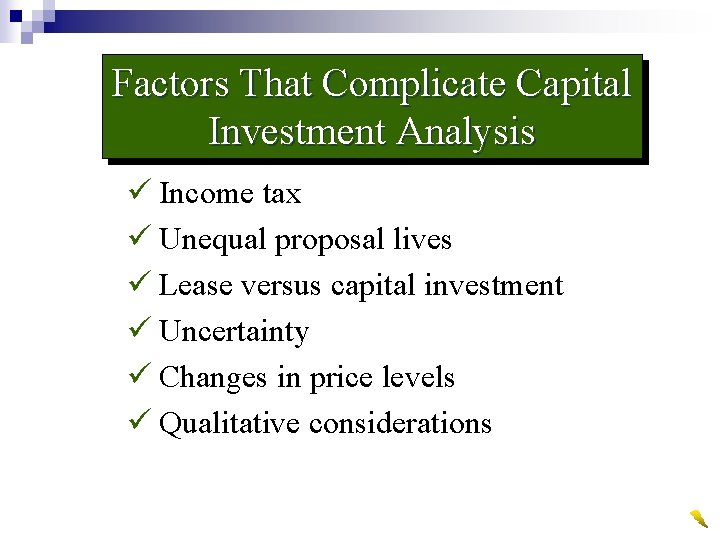
Factors That Complicate Capital Investment Analysis ü Income tax ü Unequal proposal lives ü Lease versus capital investment ü Uncertainty ü Changes in price levels ü Qualitative considerations
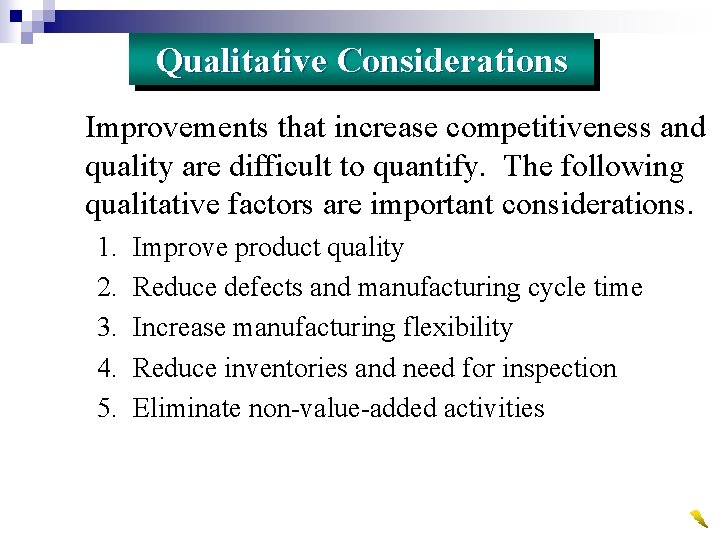
Qualitative Considerations Improvements that increase competitiveness and quality are difficult to quantify. The following qualitative factors are important considerations. 1. 2. 3. 4. 5. Improve product quality Reduce defects and manufacturing cycle time Increase manufacturing flexibility Reduce inventories and need for inspection Eliminate non-value-added activities
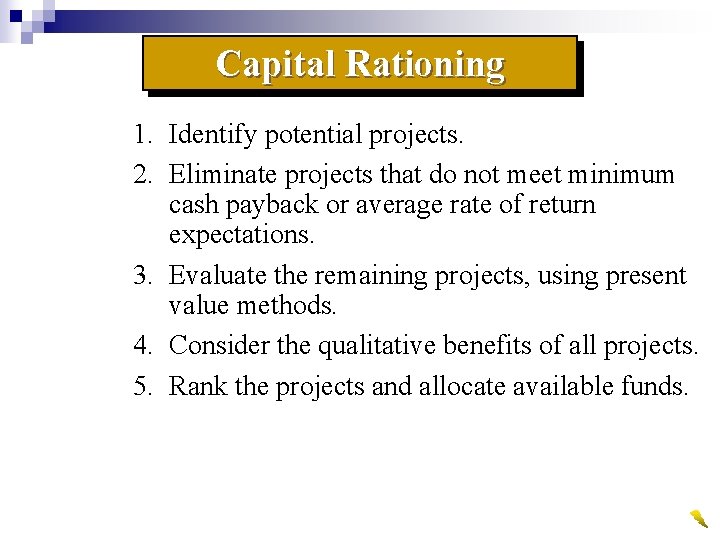
Capital Rationing 1. Identify potential projects. 2. Eliminate projects that do not meet minimum cash payback or average rate of return expectations. 3. Evaluate the remaining projects, using present value methods. 4. Consider the qualitative benefits of all projects. 5. Rank the projects and allocate available funds.
- Slides: 36