
Chapter 24 Aggregate Demand Economic Fluctuations Figure 24

- Slides: 24
Chapter 24 Aggregate Demand Economic Fluctuations
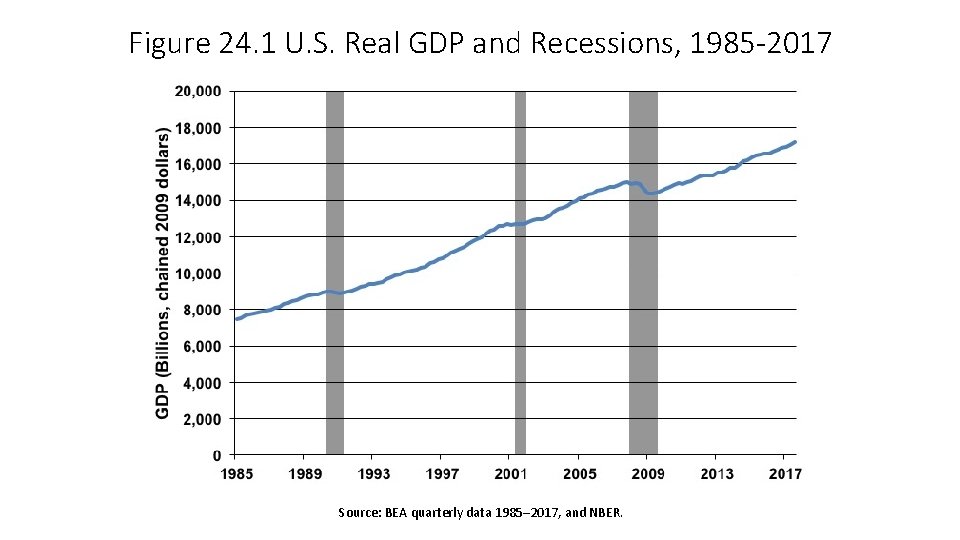
Figure 24. 1 U. S. Real GDP and Recessions, 1985 -2017 Source: BEA quarterly data 1985– 2017, and NBER.
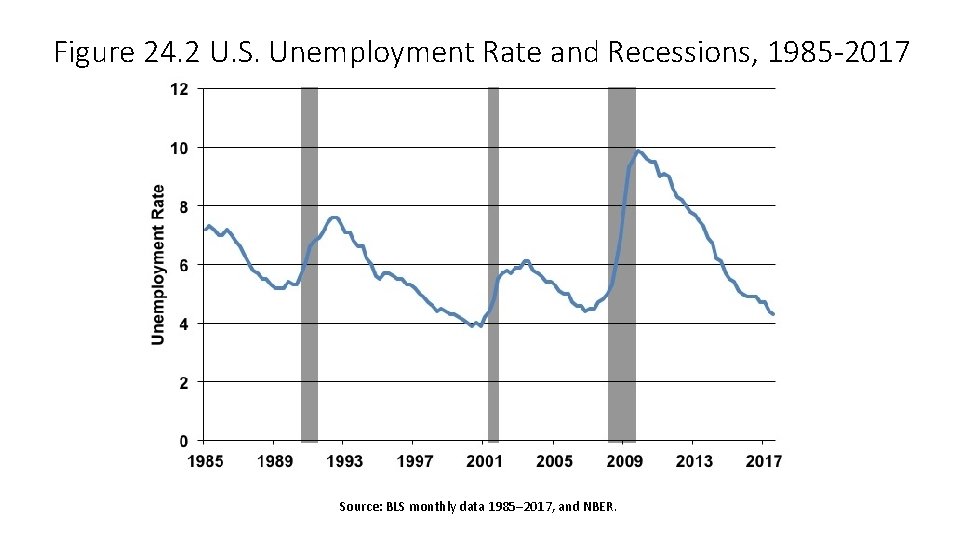
Figure 24. 2 U. S. Unemployment Rate and Recessions, 1985 -2017 Source: BLS monthly data 1985– 2017, and NBER.
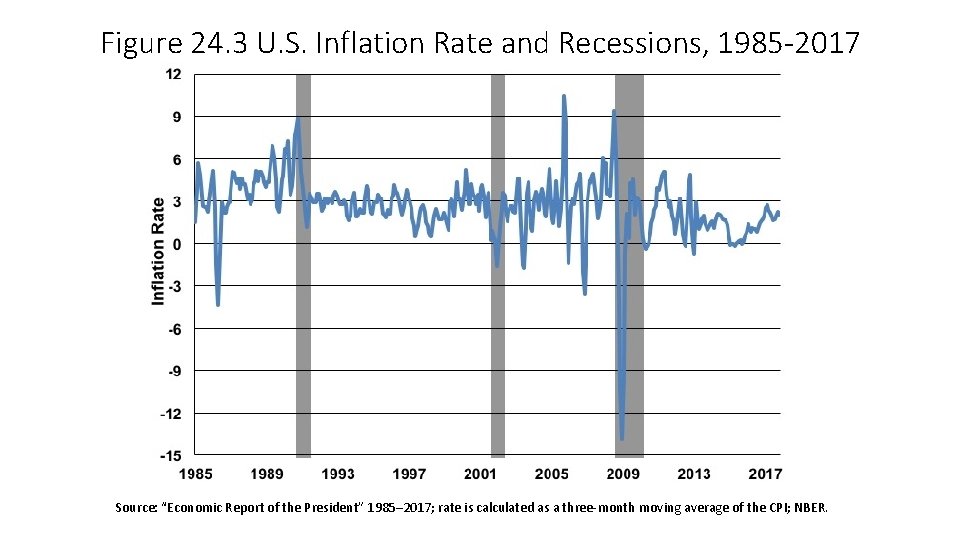
Figure 24. 3 U. S. Inflation Rate and Recessions, 1985 -2017 Source: “Economic Report of the President” 1985– 2017; rate is calculated as a three-month moving average of the CPI; NBER.
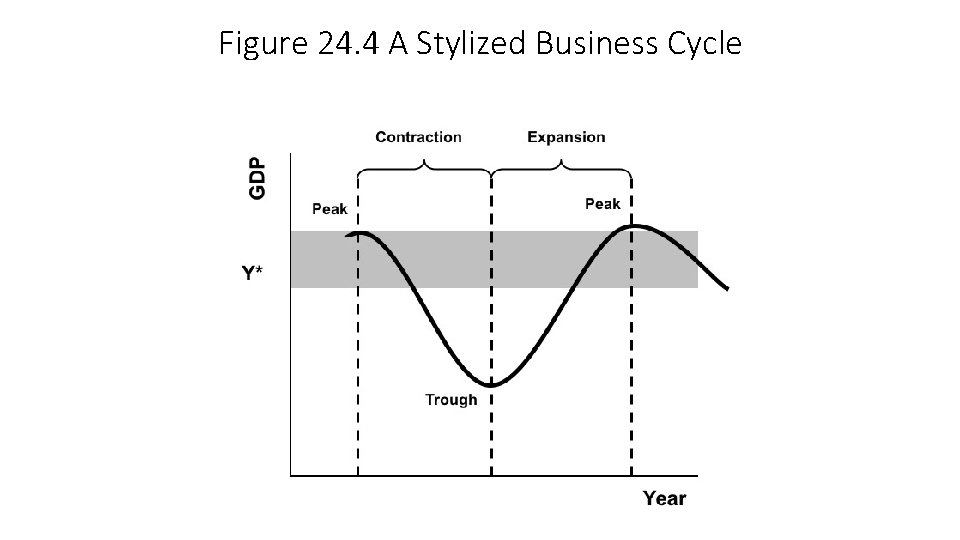
Figure 24. 4 A Stylized Business Cycle
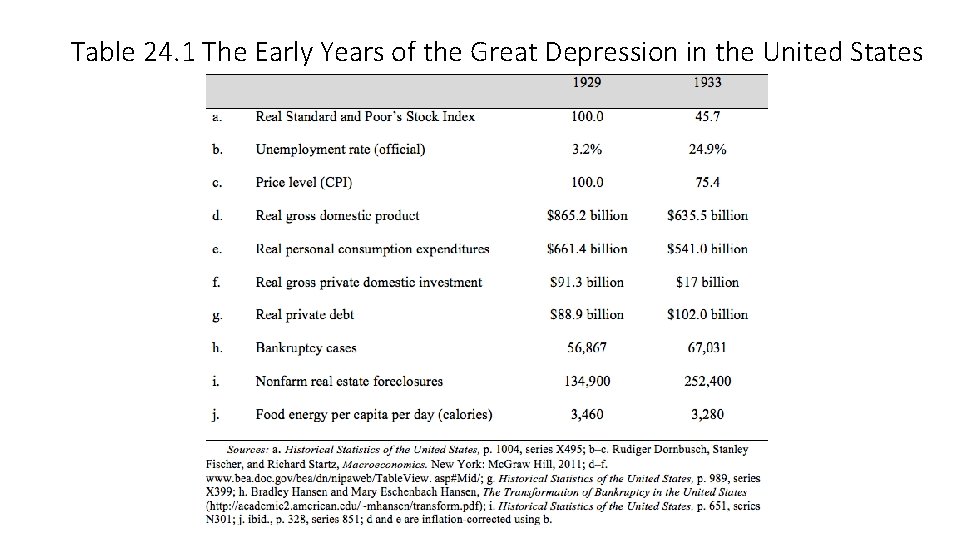
Table 24. 1 The Early Years of the Great Depression in the United States
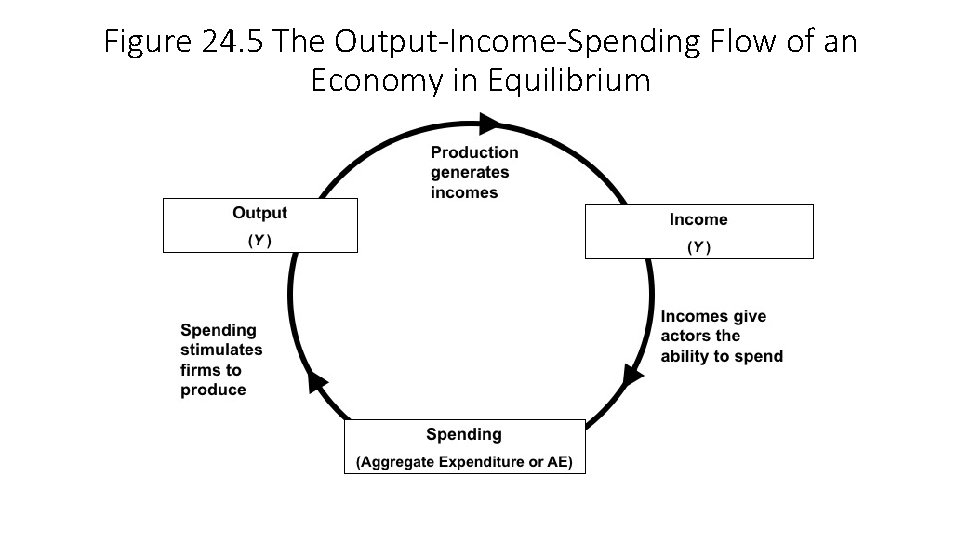
Figure 24. 5 The Output-Income-Spending Flow of an Economy in Equilibrium
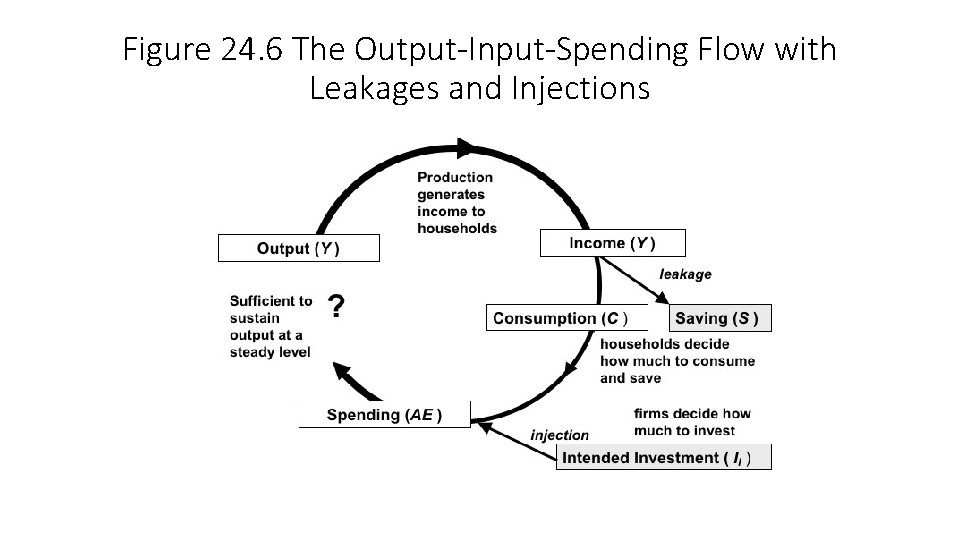
Figure 24. 6 The Output-Input-Spending Flow with Leakages and Injections
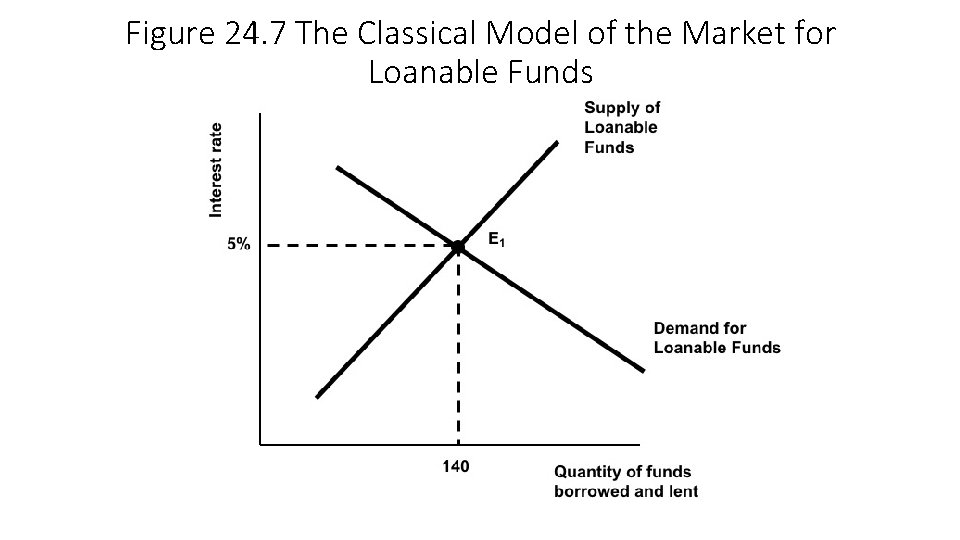
Figure 24. 7 The Classical Model of the Market for Loanable Funds
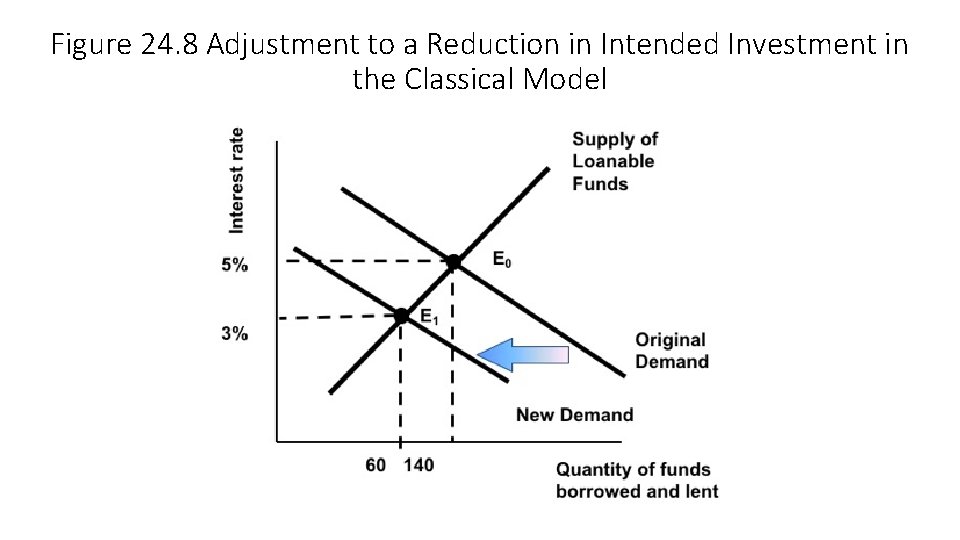
Figure 24. 8 Adjustment to a Reduction in Intended Investment in the Classical Model
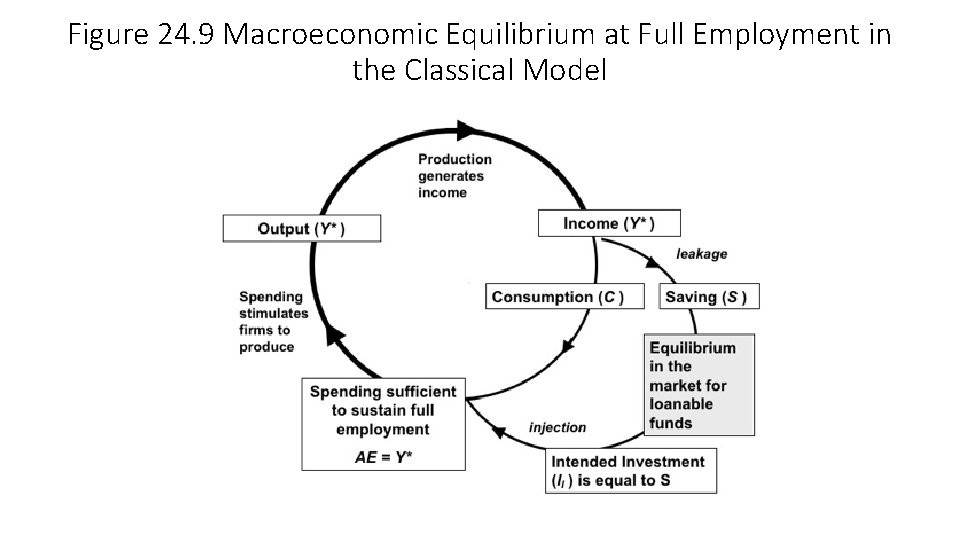
Figure 24. 9 Macroeconomic Equilibrium at Full Employment in the Classical Model
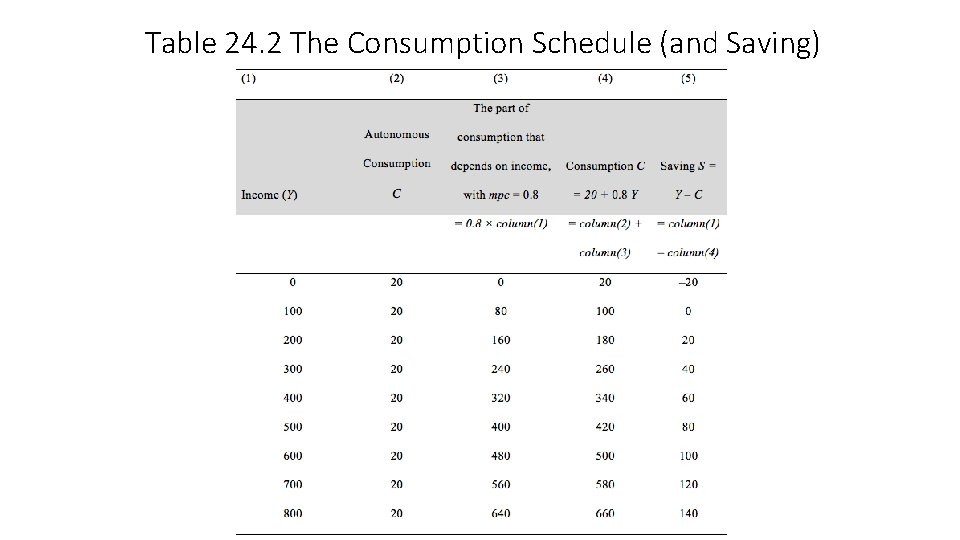
Table 24. 2 The Consumption Schedule (and Saving)
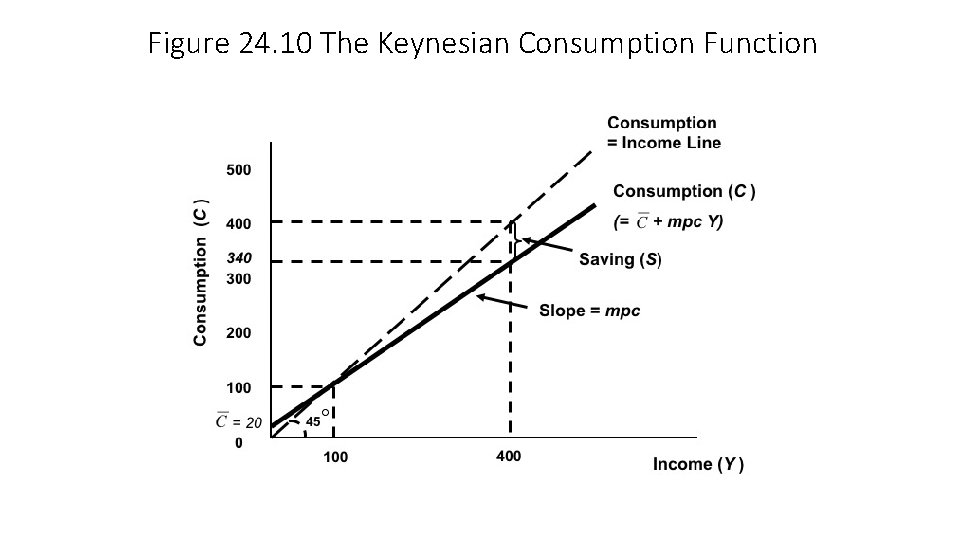
Figure 24. 10 The Keynesian Consumption Function
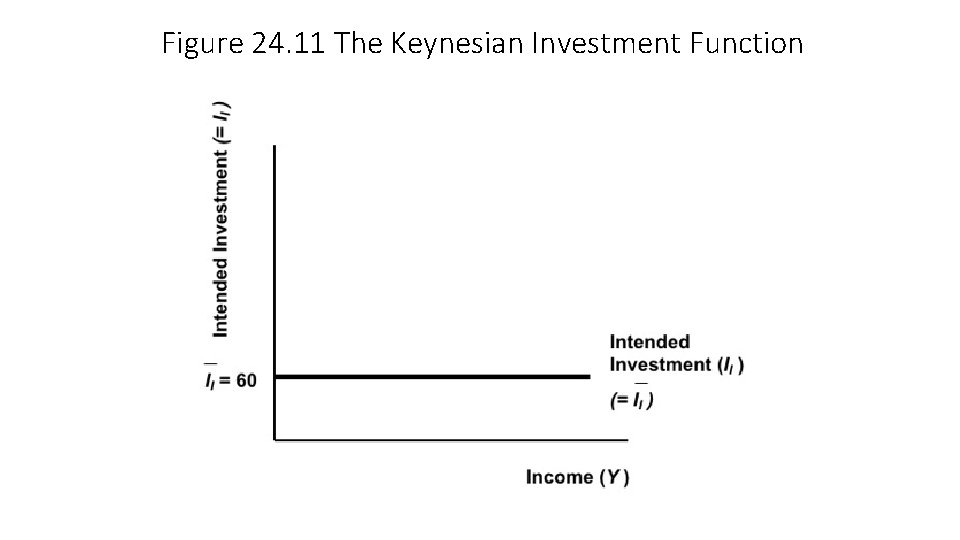
Figure 24. 11 The Keynesian Investment Function
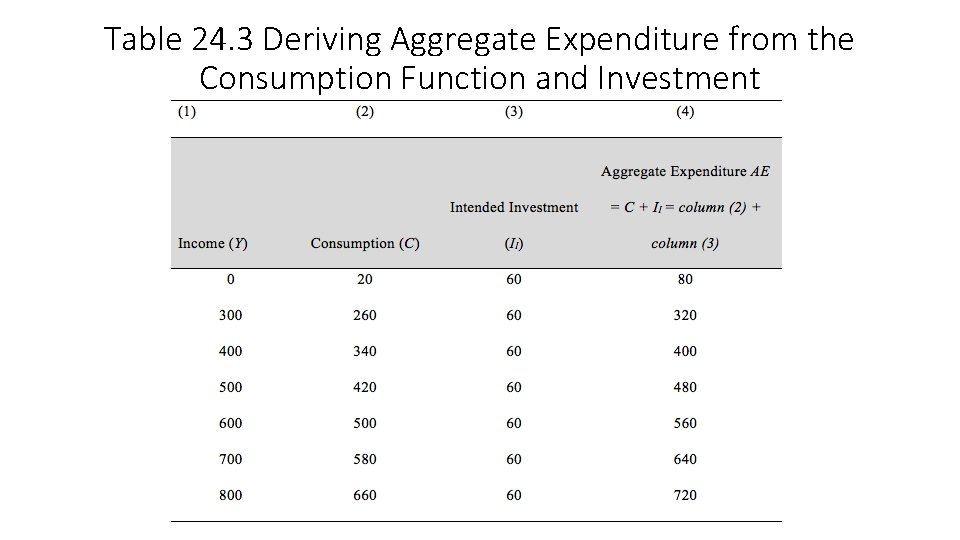
Table 24. 3 Deriving Aggregate Expenditure from the Consumption Function and Investment
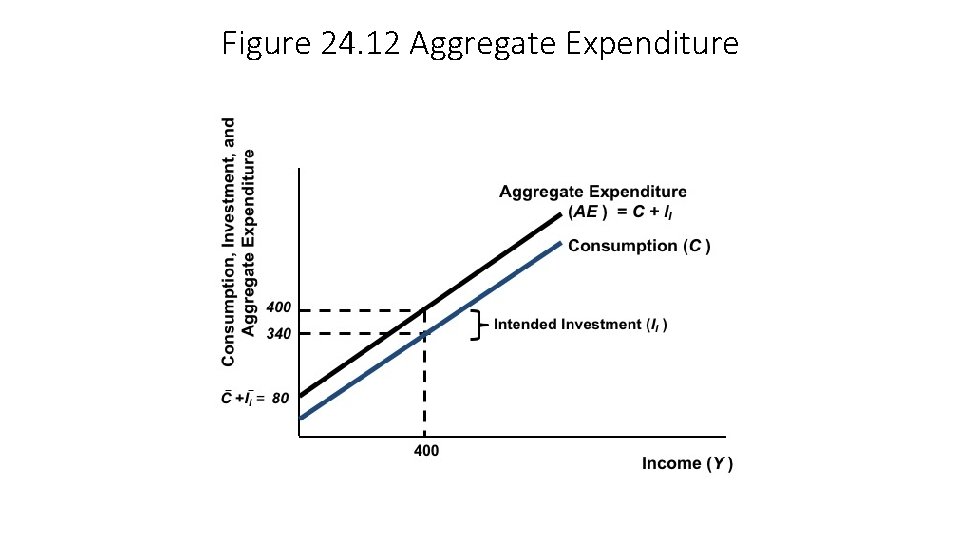
Figure 24. 12 Aggregate Expenditure
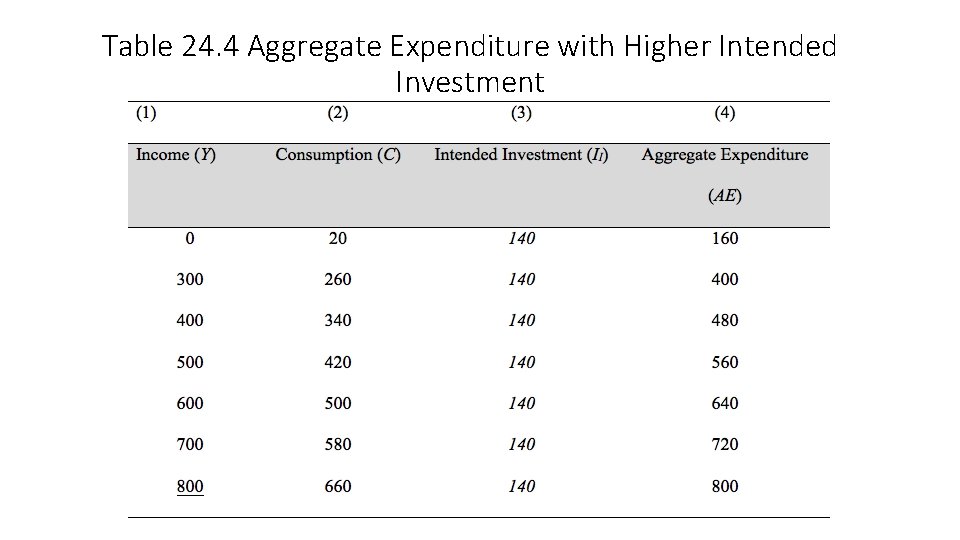
Table 24. 4 Aggregate Expenditure with Higher Intended Investment
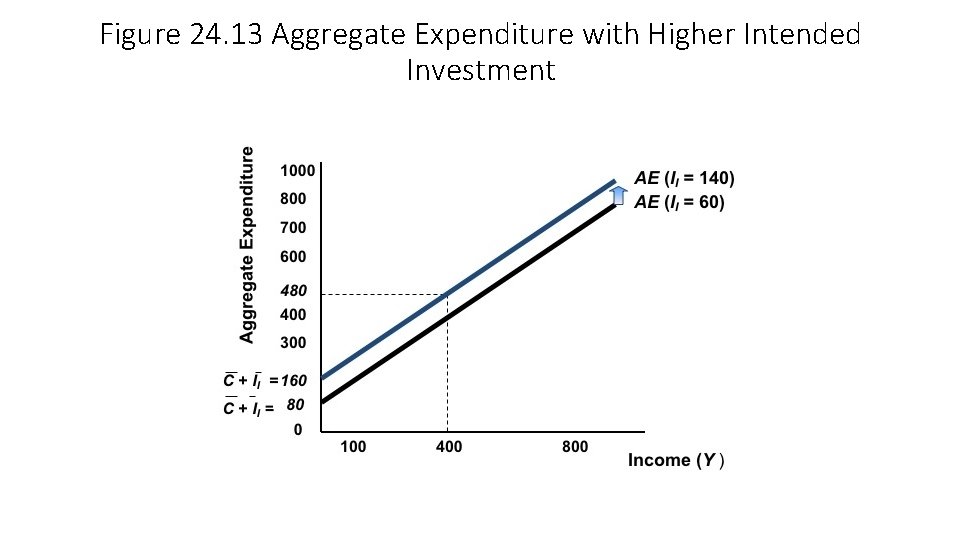
Figure 24. 13 Aggregate Expenditure with Higher Intended Investment
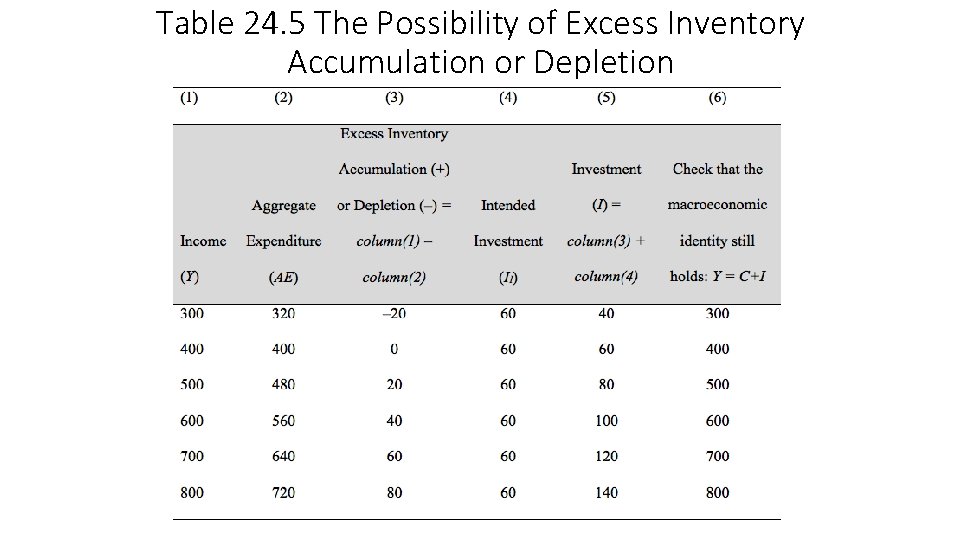
Table 24. 5 The Possibility of Excess Inventory Accumulation or Depletion
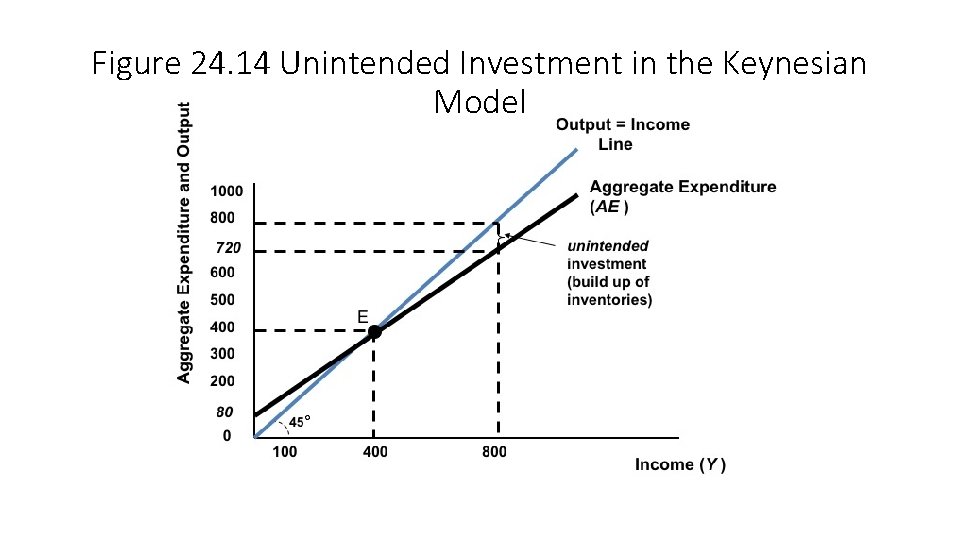
Figure 24. 14 Unintended Investment in the Keynesian Model
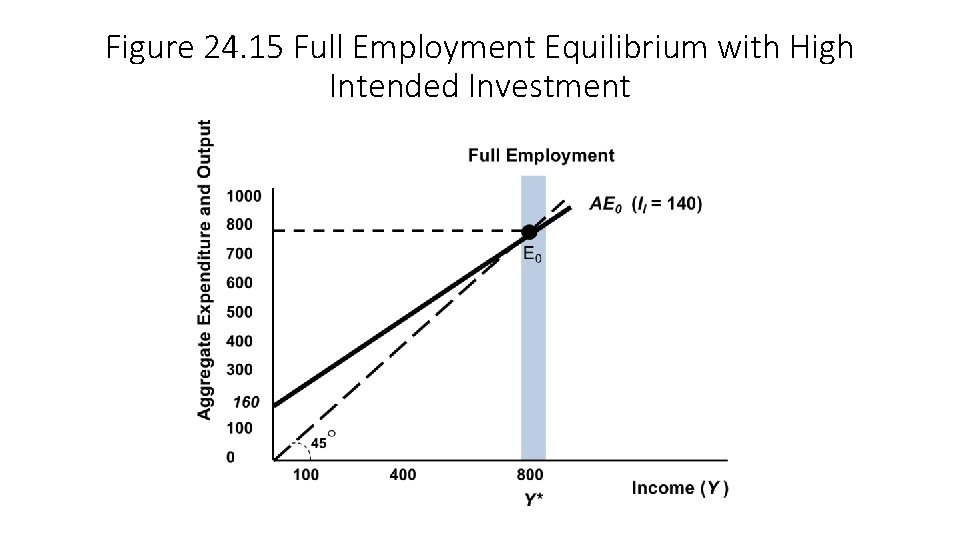
Figure 24. 15 Full Employment Equilibrium with High Intended Investment
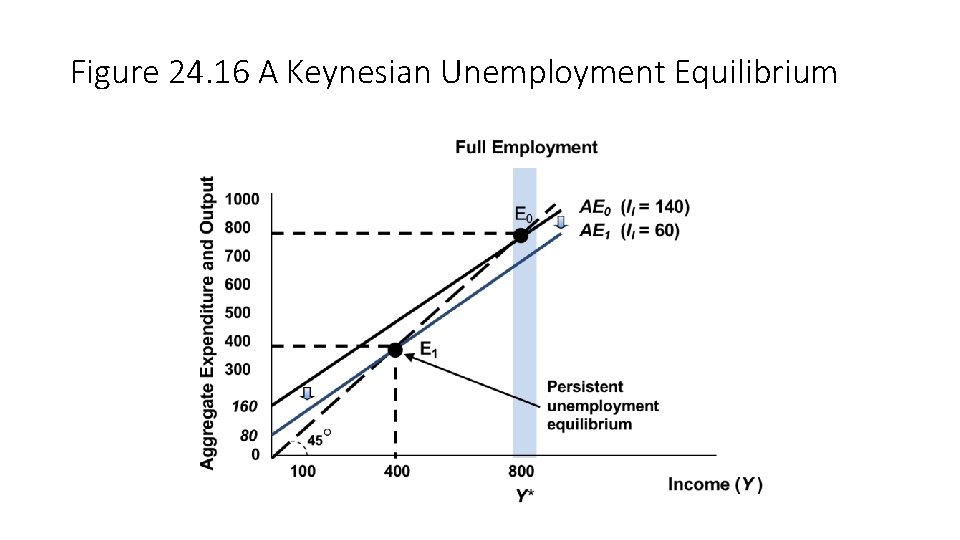
Figure 24. 16 A Keynesian Unemployment Equilibrium
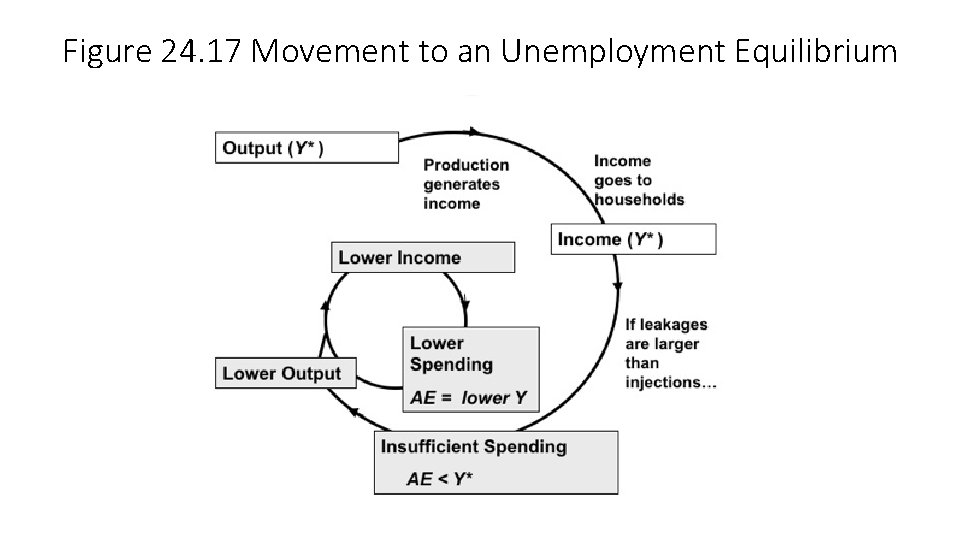
Figure 24. 17 Movement to an Unemployment Equilibrium
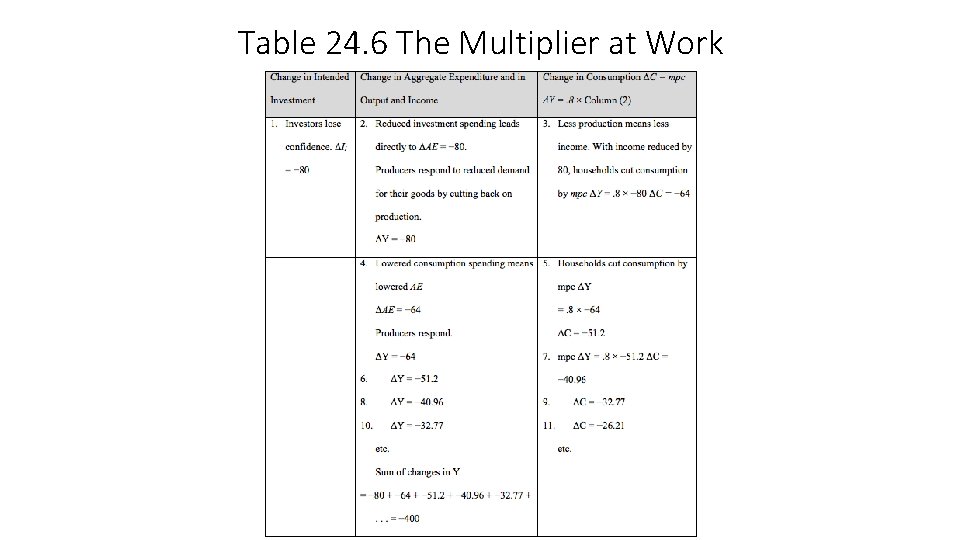
Table 24. 6 The Multiplier at Work