
CHAPTER 22 MEASURING RISKS AND RETURNS OF PORTFOLIO




- Slides: 14
CHAPTER 22 MEASURING RISKS AND RETURNS OF PORTFOLIO MANAGERS FIN 330 Principles of Investing
STUDENT LEARNING OBJECTIVES A. Learning from Historical Trends 1. Measuring Holding Period Returns: Geometric vs. Arithmetic 2. Fund Objectives and Risk Attributes B. Three measures of investment performance based on modern portfolio theory C. Past performance as a predictor of future performance D. Applying modern portfolio theory to investment decisions
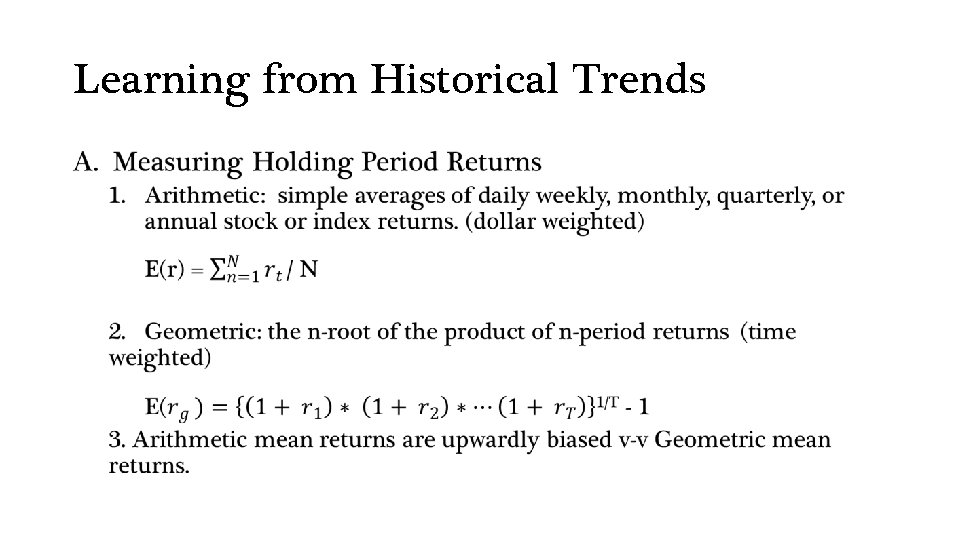
Learning from Historical Trends A.
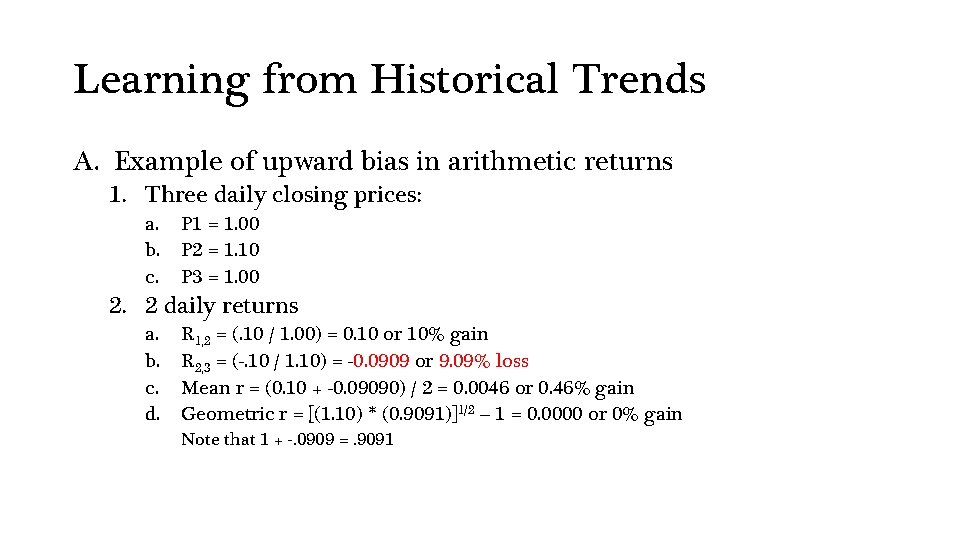
Learning from Historical Trends A. Example of upward bias in arithmetic returns 1. Three daily closing prices: a. b. c. P 1 = 1. 00 P 2 = 1. 10 P 3 = 1. 00 2. 2 daily returns a. b. c. d. R 1, 2 = (. 10 / 1. 00) = 0. 10 or 10% gain R 2, 3 = (-. 10 / 1. 10) = -0. 0909 or 9. 09% loss Mean r = (0. 10 + -0. 09090) / 2 = 0. 0046 or 0. 46% gain Geometric r = [(1. 10) * (0. 9091)]1/2 – 1 = 0. 0000 or 0% gain Note that 1 + -. 0909 =. 9091
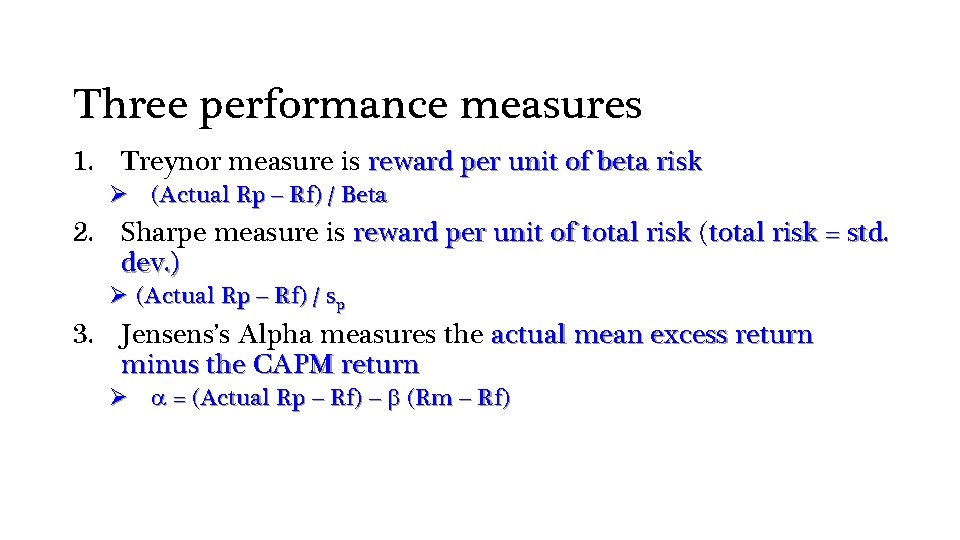
Three performance measures 1. Treynor measure is reward per unit of beta risk Ø (Actual Rp – Rf) / Beta 2. Sharpe measure is reward per unit of total risk ( reward per unit of total risk = std. dev. ) Ø (Actual Rp – Rf) / sp 3. Jensens’s Alpha measures the actual mean excess return minus the CAPM return Ø a = (Actual Rp – Rf) – b (Rm – Rf)
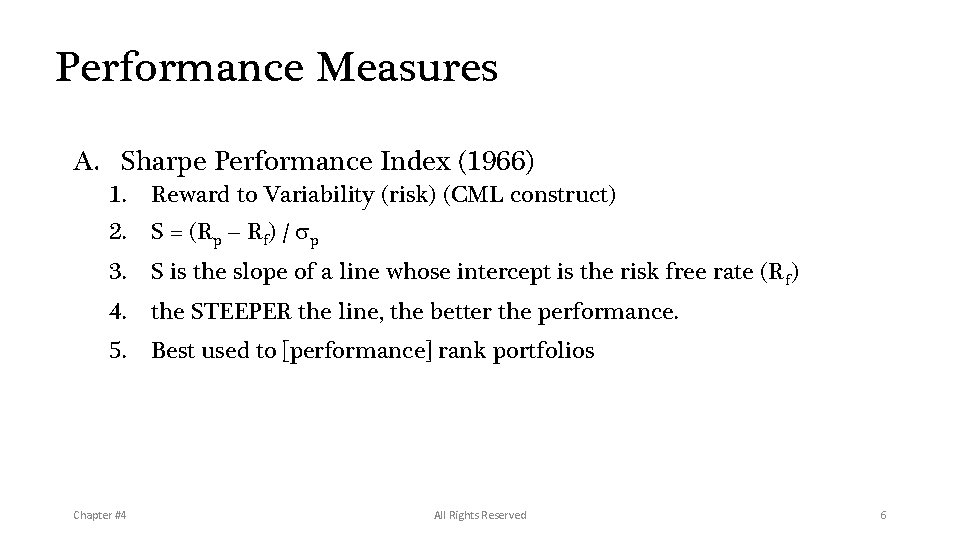
Performance Measures A. Sharpe Performance Index (1966) 1. Reward to Variability (risk) (CML construct) 2. S = (Rp – Rf) / sp 3. S is the slope of a line whose intercept is the risk free rate (R f) 4. the STEEPER the line, the better the performance. 5. Best used to [performance] rank portfolios Chapter #4 All Rights Reserved 6
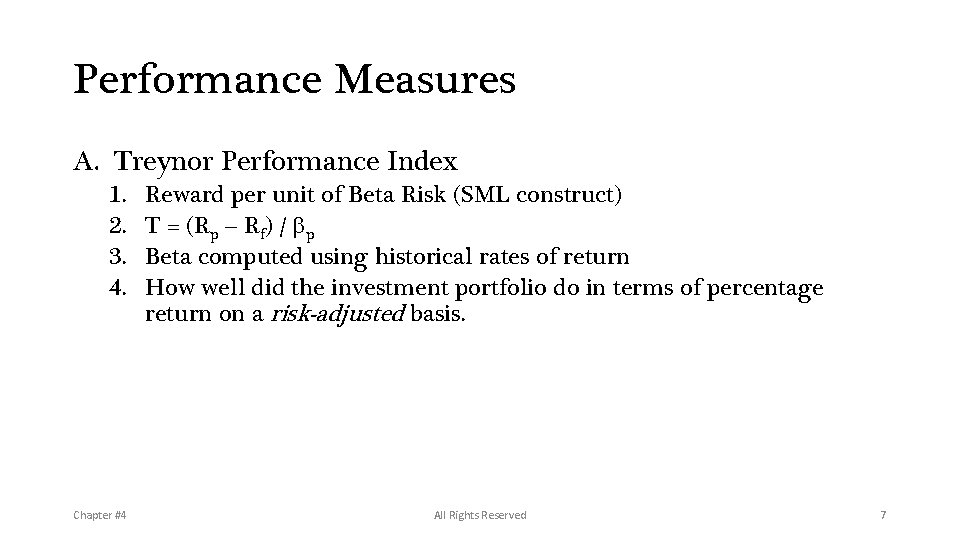
Performance Measures A. Treynor Performance Index 1. 2. 3. 4. Chapter #4 Reward per unit of Beta Risk (SML construct) T = (Rp – Rf) / bp Beta computed using historical rates of return How well did the investment portfolio do in terms of percentage return on a risk-adjusted basis. All Rights Reserved 7
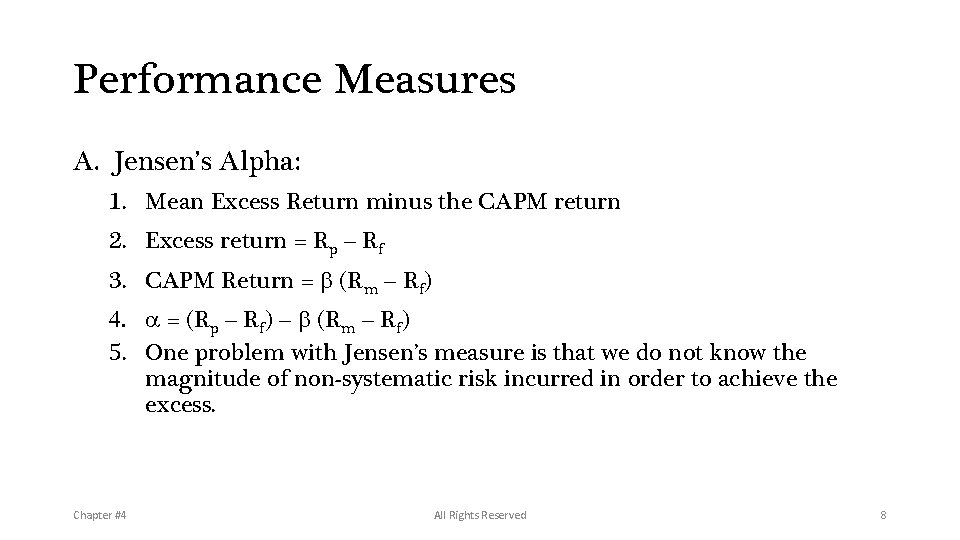
Performance Measures A. Jensen’s Alpha: 1. Mean Excess Return minus the CAPM return 2. Excess return = Rp – Rf 3. CAPM Return = b (Rm – Rf) 4. a = (Rp – Rf) – b (Rm – Rf) 5. One problem with Jensen’s measure is that we do not know the magnitude of non-systematic risk incurred in order to achieve the excess. Chapter #4 All Rights Reserved 8
Supplemental Material: EMT A. Gauging impact of efficient markets theory on investor behavior 1. How do investors implement efficient market theories? a. b. c. Chapter #4 True Believers Doubtful Percentage players All Rights Reserved 9
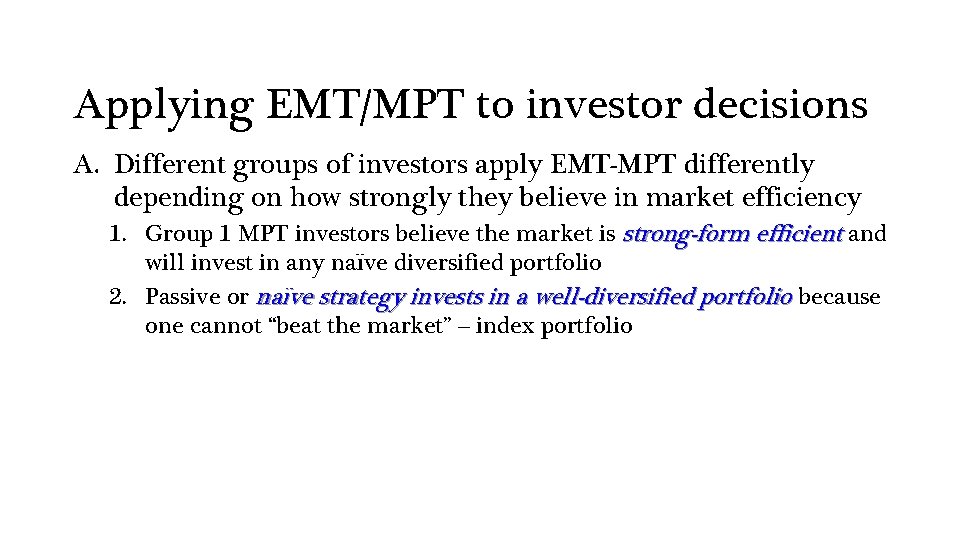
Applying EMT/MPT to investor decisions A. Different groups of investors apply EMT-MPT differently depending on how strongly they believe in market efficiency 1. Group 1 MPT investors believe the market is strong-form efficient and will invest in any naïve diversified portfolio 2. Passive or naïve strategy invests in a well-diversified portfolio because one cannot “beat the market” – index portfolio
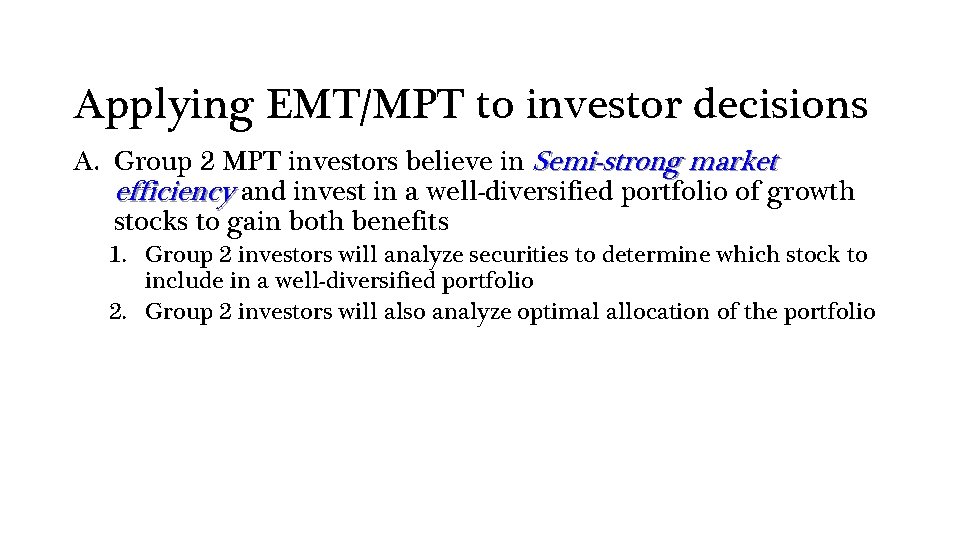
Applying EMT/MPT to investor decisions A. Group 2 MPT investors believe in Semi-strong market efficiency and invest in a well-diversified portfolio of growth stocks to gain both benefits 1. Group 2 investors will analyze securities to determine which stock to include in a well-diversified portfolio 2. Group 2 investors will also analyze optimal allocation of the portfolio
Applying EMT/MPT to investor decisions A. Third group is somewhere between group 1 and group 2 B. They believe the market offers undervalued and overvalued stocks, but that finding them is nearly impossible, so they may act as group 1 investors C. Other investors scorn EMT/MPT D. Technical Analysts may fall in this group Copyright © 1998 by Harcourt Brace & Company
Implications for investors A. Diversify by investing in several securities or in mutual funds B. Measure performance using reward per risk to determine fund performance C. Measure performance over a long period of time, perhaps five years or more D. Understand the tradeoffs between picking high growth stocks over a well-diversified portfolio Chapter #4 All Rights Reserved 13
Homework A. Discussion Questions: 1, 3, 4, 5, 6, 7 B. Problems: 1, 2 (parts a & c)