Chapter 2 The Solow Model Charles I Jones


 If all inputs double, output will also double •")


 regularly conducts growth accounting exercises according")

- Slides: 51
Chapter 2 The Solow Model Charles I. Jones
Robert Solow and his Growth Model 1956 “A contribution to theory of economic growth” (1970) Quarterly Journal of Economics 1987 Nobel Prize in economics awarded Solow growth model Is able to explain the stylized facts outlined in Chapter 1 Based on simple assumptions with far-reaching consequences • Countries produce a homogeneous output • Technology is exogenous, i. e. unaffected by the firms’ or countries’ actions
What is a Model? Models are maps • A map is a simplified representation of reality, and so is a model • Our brain creates a model of the outside reality every single second Typical economic model: an outline • A toy economy populated by robots • Robots maximize their utility by e. g. trying to consume as much as possible • Consumption is limited by available resources (money) and technology that allows the economy to produce consumption goods • Simple models often have enormous explanatory power: Supply and Demand
Basic Solow Model Setup • Inputs like labor and machines produce output like automobiles • Output can be intangible (think of haircuts or theatre performance) Inputs and Outputs • Labor: L, can be measured as a number of workers or working hours • Capital: K, measured in physical units (number of tractors) or monetary value (the market price of a factory building) • Output: Y, either the number of units or monetary equivalent Production Function • We assume inputs are translated into outputs according to the Cobb-Douglas production function: • is a number between zero and one
Constant Returns to Scale (CRS) If all inputs double, output will also double • Scale here means “increase” • Output increases in exact same way as inputs • Indeed, suppose we double the amount of both capital and labor: Initial level of output: Level of output if we use 2 K and 2 L:
Profit Maximization Problem Wages and Rental Payments • Workers receive wages w so the total payment to labor is equal to w. L • Capital is rented at rate r so the total payment to capital is equal to r. K • If one owns capital such as a factory building, r is imputed in macroeconomics statistics as if the owner were paying to himself for renting his own building Profit Maximization Problem • Firms are maximizing their profits, i. e. the difference between the price of their output and payments to inputs • Assuming the price of one unit of output is 1, the firms’ problem is: • In other words, firms are looking for a combination of capital and labor such that the difference between their revenues (i. e. the price of their output) and payments to inputs (i. e. workers’ wages and capital rental fees) is maximized
First-Order Conditions Marginal product of Labor is equal to the wage: Marginal product of Capital is equal to the rental price: The value of output is equal to sum of payments to the inputs: • • No economic profits are earned (why is this not a problem? ) This result obtains for the constant returns to scale production functions Share of output paid to labor and capital is constant • This is stylized fact #5. Indeed, and
Solow Model in Per Worker Terms Introduce new variables in per worker terms: • Output per worker: • Capital per worker: Rewrite the production function in per worker terms: Why do we need to do this? • It makes more sense thinking about economic growth and its stylized facts in terms of per capita variables, i. e. GDP per capita • Our production function now depends only on one (capital per worker) rather than two variables (capital and labor separately)
1. With more capital per worker k, firms produce more output per worker y 2. Diminishing returns: each additional unit of capital we give to a worker increases the output of that worker by less and less
Capital Accumulation How capital accumulates • Assumption 1: firms save a fraction s of their output. They use this saved share s. Y to finance their investments, i. e. to finance purchases of additional capital stock • Assumption 2: capital depreciates at rate , which means the following: • Suppose in the year of 2013 the value of my capital stock is equal to • In the next year, 2014, the value of my capital stock will decrease by , that is Capital accumulation equation: • Capital tends to increase because of investments (assumption 1) and decrease because of depreciation (assumption 2) • Combining the two assumptions, one obtains for the year of 2014: • We now rearrange the terms a little bit: • Alternatively,
Population and Labor Force Growth We assume population grows exponentially as follows: Labor force and population • Assumption: labor force participation rate is constant so that the labor force growth rate is identical with the population growth rate Labor force and population are both growing at rate n
Capital Accumulation Equation in Per Capita Terms Take logs and differentiate: From now on k and y are capital and income per capita Collect the terms and rearrange:
Interpreting Capital Accumulation Equation in Per Capita Terms The change in capital per worker each period is determined by three terms: 1. Investment per worker s. Y increases capital per worker k 2. Depreciation per worker decreases k 3. Even if there were no investment or depreciation, capital per worker would still decrease each period by the amount nk because each period there appear n. L new workers in the economy
Solving the Basic Solow Model Anatomy of a model • Several equations describe relationships between a collection of endogenous and exogenous variables • Endogenous variables are the ones whose values are determined within the model itself • Production function tells us how much output will be produced given this much capital and labor: output is an endogenous variable here • Capital accumulation equation allows us to determine how much capital per worker will be produced each period: capital per worker is an endogenous variable here • Exogenous variables, or parameters, are numbers whose values are fixed outside of the model. Exogenous variables enter equations, but they cannot be modified from within the model • Population growth rate n is exogenous to the Solow model, it is just given • Depreciation rate is also exogenous to the model
Solving the Basic Solow Model What does solving a model mean? • Solving a model means to obtain values of all endogenous variables as functions of the exogenous variables only • Each time you change the value of the exogenous variable (e. g. depreciation rate), the solution values of the endogenous variables will change as well: this exercise is called comparative statics
Equations for Solow Model Solow model consists of two equations in two endogenous variables y and k production function capital accumulation Questions to ask of a model: 1. Given a certain population growth rate, depreciation rate, and investment rate, what would be the value of output and capital stock each period? We assume here that an economy starts evolving from a certain level 2. Will output and capital stock evolve to get fixed at a certain, immutable level we call steady state? 3. What will be the differences in the two levels of steady state capital stocks in the two economies that differ only by the rate of investment? 4. Many more questions can be asked answered on the basis of just these two equations!
The Solow Diagram The difference between sy curve and the straight line is always equal to the growth rate of per capital Introduction to Economic Growth, 3 rd Edition Copyright © 2013, W. W. Norton & Company
Capital Deepening and Widening Capital deepening occurs when the amount of capital per worker increases: Capital widening occurs when the amount of capital per worker stays the same: Under capital widening, the capital stock K grows, but the per worker capital k does not change. Capital deepening Capital widening
Convergence to Steady State Suppose an economy starts at the level of per capital stock equal to • Investment sy is greater than per capital stock decrease • As a result, capital stock per capita grows since When k grows to the point k* where , i. e. where investment is equally equal to the amount by which k decreases, the rate of change in k is zero, and capital per capita stays forever at k*, which we call the steady state.
Decreasing k If an economy starts off from the level such that investment is not enough to make up for decreases in k due to depreciation and population growth, capital stock per worker will decrease since , and it will stop decreasing at the steady state k* again.
Solow Diagram with Production Function
Comparative Statics What is comparative statics? • Recall that a model consists of equations that link endogenous and exogenous variables together • We solve the model by calculating the values of all endogenous variables as functions of only exogenous variables • When we change the values of exogenous variables (at will), the solution values of the endogenous variables change as well • Looking at how endogenous variables solution values change if we change exogenous variables is exactly the comparative statics exercise What questions can be answered by comparative statics? • What happens to output and capital stock per capita if investment rate increases? • What happens to consumption if the population grows faster? • Will there be capital deepening if investments grow faster than the population? • Etc…
Comparative Statics: an Increase in the Investment Rate 1. 2. An increase from s to s’ shifts the sy curve upwards At previous steady state k*, investment s’y is now exceeding capital decrease, so k starts growing 3. 4. k grows until it reaches new steady state k** Since y depends positively on k, the economy is now richer
Comparative Statics: an Increase in the Population Growth Rate 1. 2. 3. 4. Suppose due to immigration the population growth rate n increases to n’ This rotates the straight line to the left At the previous steady state k* investment is not enough to make up for decrease of k due to depreciation and population growth k decreases to k**, a new steady state corresponding to a poorer economy
Steady State: Explicit Solution Rewrite capital accumulation equation by including production function: By definition of the steady state, capital stock per worker does not change in the steady state, that is, Substituting in the capital accumulation equation results in the following: All endogenous variables, k* and y*, are now written in terms of the parameters s, n, and
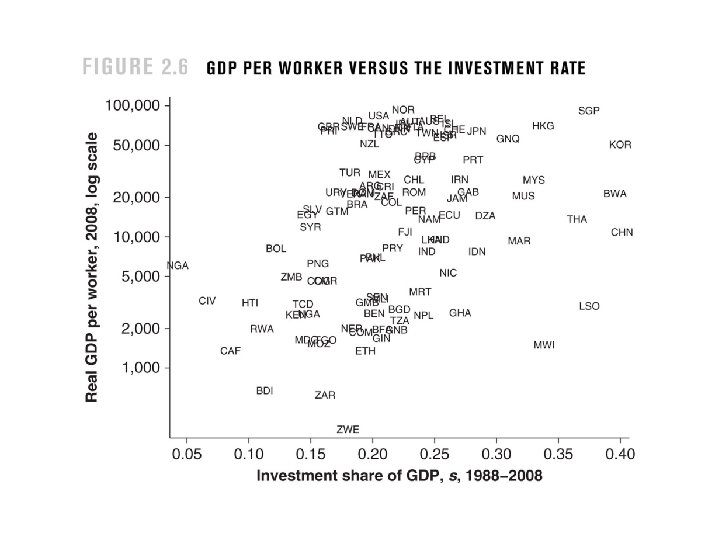
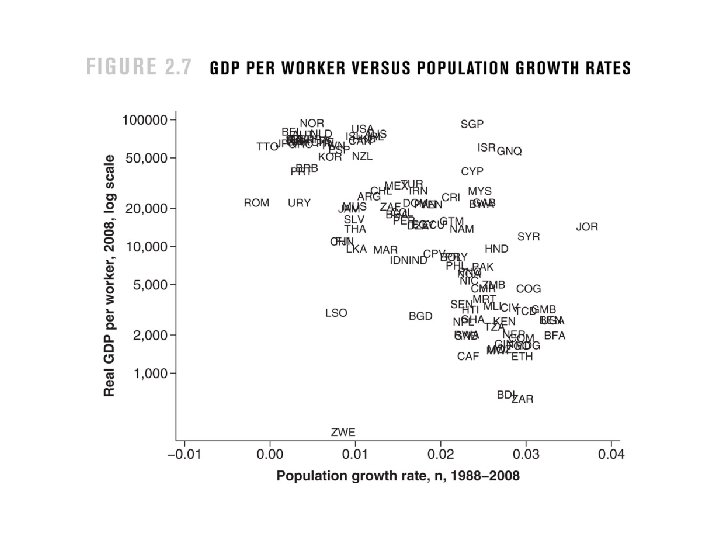
Why Are We So Rich and They So Poor? Recall the steady state solution of the Solow model: The richer countries will have: • Higher savings/investment rates s • Lower population growth rates n • Lower capital depreciation rates
Countries that invest a higher fraction of their GDP tend to be richer
Countries with higher population growth rates tend to be poorer
Growth: What Growth? Since in the steady state by definition of the steady state, capital per worker (and hence output per worker y) do not grow in the steady state!
Zero Growth in Basic Solow Model When growth is possible • Growth is possible in the basic Solow model if capital per worker is not equal to its steady state level • However, sooner or later growth will become zero by definition of the steady state since at the steady state, both capita and output per worker do not change • Growth then is only possible along a transition path to the steady state Rearrange capital accumulation equation to obtain: Since , the right-hand-side will be decreasing with k, eventually getting infinitely close to zero, implying
Transition Dynamics in Basic Solow Model Economies with k further away from k* will change faster. Average product of capital The higher the capital per worker k, the lower the average product of capital y/k because of diminishing returns to capital accumulation ( ).
Technology and the Solow Model Add technological progress to allow growth • In the basic Solow model, replace labor L with AL, where A is the level of technological development • Allow for A to grow with time so that one unit of labor (a worker, or a working hour) produces ever increasing amounts of output with the course of time • The production function incorporating technological progress will then look like this: Exogeneity of technology • Technology is exogenous in that we do not explain where it comes from and why its level increases with time • We postulate that technology is growing at a constant rate g:
Balanced Growth Path Production function in per capita terms with technology Rewrite in terms of the growth rates (take logs and differentiate): Balanced growth path • A situation in which capital, output, consumption and population are growing at constant rates is called balanced growth path • Denoting to be the growth rate of variable x (e. g. technology A), the balanced growth path implies the following:
Balanced Growth Path Suppose capital K is growing at a constant rate. Let us rewrite the capital accumulation equation: Since along the balanced growth path that the ratio is constant as well. That, in turn, implies that the ratio is constant, it implies is constant, too. Which implies that both y and k must be growing at the same rate, meaning. From the production function equation,
Interpreting the Balanced Growth Path Under balanced growth path conditions, capital per worker is growing, so output per worker is growing, too. We now have per capita growth! In the basic Solow model, the steady state is characterized by a balanced growth path without any growth. Indeed,
Steady State with Technological Progress Introduce a new state variable: Call this “capital per effective worker” Steady state with technology: In the steady state, stays fixed. That means, however, that must be growing in order to counter the increasing A in the denominator. Since capital per worker k grows, output per worker y grows as well.
Growth Rates with Technological Progress Differentiating both sides of the last equation, we obtain: Notice here that the growth rate of capital must be exactly offsetting the negative influence exerted by growth in population and technology.
Solow Diagram with Technological Progress The combined growth equation for Solow model with technological progress assumes the following form: Interpreting the Solow diagram with technology is analogous to interpreting the basic Solow diagram. Unless investment is equal to capital decrease , capital per effective worker will change.
Solving for the Steady State By definition of the steady state, it occurs when capital per effective worker stays constant, i. e. when. That implies from the capital accumulation and production function equations that: These expressions are very similar to the ones derived for the basic Solow model, we just added the rate of technology growth g. Output per worker at steady state derives as follows: • Output per worker y is growing since technology A is growing • In case of no technological progress (A=1, g=0) we are back to the basic Solow model
An Increase in Investment Rate Suppose the government did something to increase the investment rate from s to s’. Recall the steady state level of output per worker: Clearly, output per worker will increase. However, the growth rate of steady state y will not be affected since it only depends on the rate of technology g. Indeed, Differentiating both sides of the above equation reveals:
An Increase in Investment Rate At the initial level of capitaltechnology (capital per efficient worker) ratio investment exceeds the level needed to keep it constant, so it starts growing. Growth rate increases temporarily as the economy progresses to a new steady state. Output starts growing faster than the technology rate. However, at the new steady state all growth rates are exactly as before, but the level of output per worker is larger than before.
An Increase in Investment Rate
An Increase in Investment Rate
Growth and Level Effects of a Policy Change Policy changes may increase growth rates temporarily, but only during the transition to a new steady state. In the long-run, there can be no growth effect since the growth rates of all variables are determined by the exogenously given level of technology growth g. Output per worker, however, will be greater in the long-run as a result of such policy changes. We call it level effect.
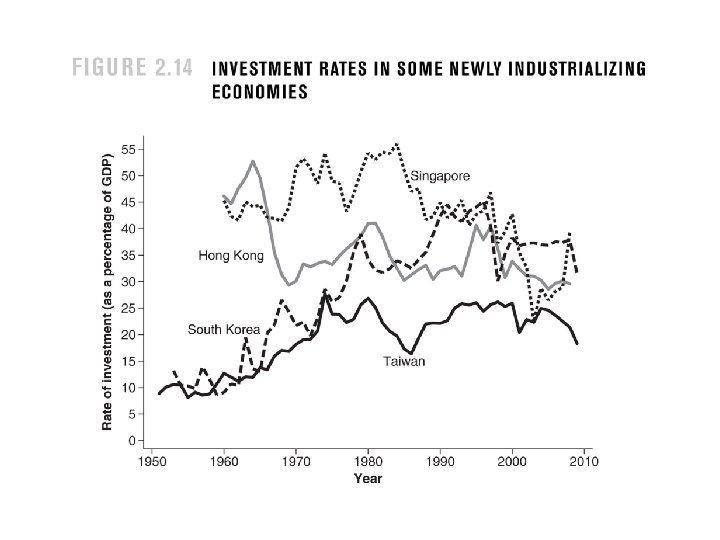
How Solow Model Explains Differences in Economic Well-Being 1. Countries that invest more will have a higher level of steadystate level of output per capita (since higher s increases ) 2. Lower population growth rates allow to accumulate more capital per worker by spending less on consumption, so per capita income will be higher 3. Technological progress is the only force driving growth in the Solow model. Without it, capital stock grows, but not capital stock per capita. 4. Starting off low makes it easy to grow faster • South Korea • Japan
Growth Accounting Solow offered a slightly different way of introducing technology in the production function, namely: Take logs, then differentiate: Key formula of growth accounting says that: Output growth is equal to weighted average of capital and labor growth, and the total factor productivity (multifactor productivity) growth.
Growth Accounting Statistics Bureau of Labor Statistics (BLS) regularly conducts growth accounting exercises according to the formula just derived. • • Increase in productivity after 1995 • Solow paradox and the New Economy IT sector’s contribution increased substantially • Output per hour grew at 2. 6% during 1948 -2010 • Multifactor productivity contributed 1. 4 percentage points of that amount (roughly 54% of total growth) • Productivity slowdown occurred in the 1970 s • Sharp rise in energy prices (OPEC cartel) • Lack of R&D investment in the 1960 s
Growth Miracles: Productivity or Factor Accumulation? • Along a balanced growth path, so countries should lie along the 45 -degree line • Korea, Japan, Singapore above the 45 -degree line, implying growth by factor accumulation • Singapore: TFP growth is negative, but growth rate of y is positive: why?