CHAPTER 2 The basics of SUPPLY AND DEMAND

CHAPTER 2 The basics of SUPPLY AND DEMAND

Learning unit outcomes MARKETS � Movement along and Movement of supply and demand � Describe: Equilibrium prices Quantity demanded and supplied Demand supply determined � Meaning and calculation of elasticity � Consequences of government intervention

SUPPLY SIDE OF THE MARKET From the suppliers viewpoint = What they supply

SUPPLY EQUATION SUPPLY SIDE OF THE MARKET Definition: � Quantity of a good that producers are willing to sell at a given price Qs = Qs(P)

TABLE DEPICTING SUPPLY
 P 2 The supply curve slopes upward,")
SUPPLY CURVE S Price (R per unit) P 2 The supply curve slopes upward, demonstrating that at higher prices firms will increase output P 1 Q 2 Quantity 6 The Supply Curve, Graphically Depicted

PROPERTIES OF THE CURVE Market Supply curve slopes upwards from left to right. �Q of fish supplied increase as P increase. � Supplies have a greater incentive to supply at a higher price. Curve refers to a specific time period. � Shape of the curve depend on the time period. � Suppliers adapt their supply according to the time.

FACTORS THAT INFLUENCE THE SHAPE Technological change � New technology = Cheaper to manufacture. � Company in a position to offer goods at a lower price. Price factors of production � Decrease in input prices = Cheaper to produce goods.

INCREASE IN SUPPLY

DECREASE IN SUPPLY

SHIFT OR MOVEMENT ALONG In essence the same principle as for the demand curve! Technological change and changes in the price of factors of production = Shift right or left. Price of product change = Movement Quantity change = Movement

DEMAND From the consumers viewpoint = What they want

DEMAND Market = Demand Supply Definition: How much of a good consumers are willing to buy at a given price. Law of demand: The higher the price of a product the lower the quantity demanded provided all other things remain constant. Qd = Qd (P)

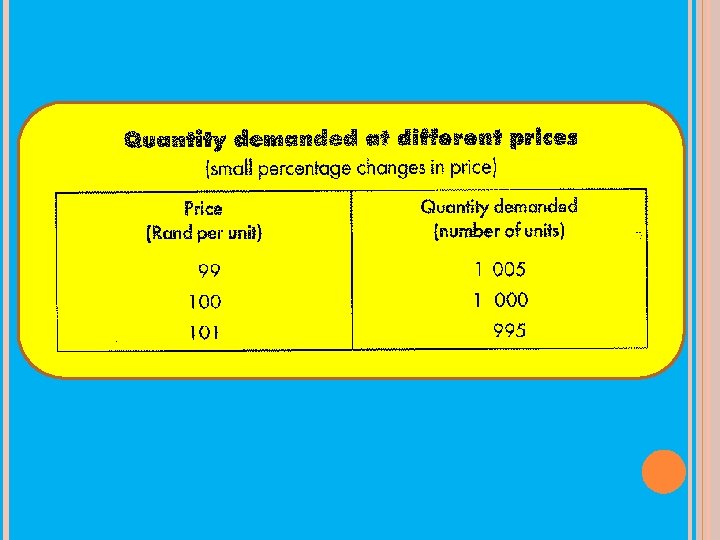
TABLE DEPICTING DEMAND
 P 2 P 1 D Q 1")
THE DEMAND CURVE Price (R per unit) P 2 P 1 D Q 1 Q 2 Quantity 15 The demand curve slopes downward, demonstrating that consumers are willing to buy more at a lower price as the product becomes relatively cheaper.

THE MARKET DEMAND CURVE

PROPERTIES OF THE DEMAND CURVE Market demand curve is down sloping. � Demand increase as price decrease � True for most demand curves of products Curve refers to a specific time period. � Length of the period can influence the shape and position of the curve.

FACTORS THAT SHIFT THE DEMAND CURVE = Non-price factors Taste of consumers � Increased preference = Shift to the right � Consumer wants to buy more for the same price � Decreased preference = Shift to the left � Consumer wants to buy less for the same price Income level of consumers � Increased income per capita = Shift to the right � Decreased income per capita = Shift to the left Price level of other goods Size of population � Larger population = Bigger demand vice versa Redistribution of income Expectations

DEMAND INCREASE

DEMAND DECREASE

SHIFT OR MOVEMENT ALONG Non-price factors = Shift of demand curve � Movement left or right � Non-price factors: Determinants of demand other than price � Shift right = Demand increase � Shift left = Demand decrease Change in price = Movement along demand curve Change in quantity = Movement along demand curve

Change in price of goods affects demand Substitute goods: � Increase in price of one = Increase in quantity demanded of the other. � E. g. . Butter and margarine Complementary goods: � Increase in price of one = Decrease in quantity demanded of the other. � E. g. . Vehicles and petrol � E. g. . Computers and software
 23 Surplus The curves intersect at equilibrium,")
MARKET MECHANISM S Price (R per unit) 23 Surplus The curves intersect at equilibrium, or marketclearing, price. Quantity demanded equals quantity supplied at P 0 Shortage Q 0 D Quantity

EQUILIBRIUM PRICE

CHANGE IN DEMAND

CHANGE IN SUPPLY

SIMULTANEOUS CHANGE

SIMULTANEOUS CHANGE

PRICE ELASTICITY OF DEMAND Demand curves differ in terms of sensitivity of the quantity demanded to price. Depending on the goods � Small price change � Large price change Large change in curve Small change in curve To indicate sensitivity = Price elasticity of demand The price elasticity of demand (demand elasticity) is defined as the percentage change in quantity demanded caused by a one per cent change in price.

PRICE ELASTICITY OF DEMAND Price EP = - 4 Elastic Ep = -1 2 Inelastic 4 8 Ep = 0 Q

DEMAND ELASTICITY Price elasticity � Change from one point to a next on the curve � Change across markets Price elasticity expressed in terms of relative changes (a percentage change) in price and quantity demanded. Not absolute change because: � Absolute price expressed in money units � Absolute quantity expressed in physical units Please Note! � Common practice to reflect as a positive number.

CALCULATION: Small price change Point Elasticity ed = Percentage change in quantity demanded Percentage change in the price = ΔQd ÷ Δ P Qd P
 to R 100 (Q=1000) = ΔQd ÷")
EXAMPLE Price increase from R 99 (Q=1005) to R 100 (Q=1000) = ΔQd ÷ Δ P Qd P = (5/1005) ÷ (1/99) = 0. 49 Price decrease from R 100 (Q=1000) to R 99 (Q=1005) = (5/1000) ÷ (1/100) = 0. 5 Thus, small price change in both examples.

CALCULATIONS: Large. PRICE price changes FOR LARGE CHANGES Arc Elasticity � Use average values of P and Qd ed = ΔQd(P 1+P 2) Δ P (Qd 1+Qd 2)
 and Short run. TOTAL (SR) REVENUE (OR EXPENDITURE)")
PRICE AND Long. ELASTICITY run (LR) and Short run. TOTAL (SR) REVENUE (OR EXPENDITURE) Elasticities Hw much does supply and/or demand change in response to change in price. � How much time is allowed to pass before we measure the changes. Short run = 1 year or less Long run = Enough time for consumers to adjust fully to the change. SR supply and demand curve ≠ LR supply and demand curve Graphs page 41

PRICE ELASTICITY OF DEMAND Elastic demand: � If price reduced, percentage increase in quantity demanded will be greater than the percentage decrease in the price. � Price decrease Increase in revenue of firm � Price increase Decrease in revenue of firm Inelastic demand: � If price reduced, percentage increase in the =quantity demanded will be less than the percentage decrease in price. � Price decrease Decrease in revenue of firm � Price increase Increase in revenue of firm

INCOME ELASTICITY OF DEMAND Income of consumers has an influence on quantity of a product demanded Measure sensitivity of the quantity demanded to changes in income. Positive income elasticity = Normal goods � Increase in income and increase in quantity demanded. � Normal goods: Luxury goods and necessities Negative income elasticity = Inferior goods � Increase in income will lead to a decrease in quantity demanded. (such as paraffin and candles)

INCOME ELASTICITY OF DEMAND Income elasticity > 1 = Luxury product � Percentage change in quantity demanded greater than percentage change in income. � Furniture and electrical appliances Income elasticity < 1 = Necessity � Percentage change in quantity demanded is less than the percentage change in income. � Brown bread, maize meal, rice and fresh milk. Suppliers want to know what happen to quantity demanded if consumers income increase or decrease.

INCOME ELASTICITY OF DEMAND Unrelated products eg. Computer and shoes � Cross elasticity = 0 Substitutes eg. Tea and coffee � Cross elasticity = Positive. � A change in the price of coffee leads to a change in the same direction of quantity demanded of tea. � If price of coffee rises, consumers will demand tea. Compliments eg. Cars and petrol � Cross elasticity = Negative. � A change in the price of cars leads to a change in the opposite direction of quantity demanded of petrol. � If the price of cars fall, more cars demanded and petrol.

PRICE ELASTICITY OF SUPPLY Changes in the shape of the supply curve differ in respect of the sensitivity of the quantity supplied to price. Price elasticity of Supply (supply elasticity): Defined as the percentage change in the quantity supplied which results from a 1 per cent change in price.

Effects of Government SIMILARIntervention TO DEMAND Control ELASTICITY Markets rarely free from government intervention. Subsidies and taxes to regulate markets

Effects of Government Intervention Control Figure illustrate effect of price control Equilibrium Po and Qo No gov regulation Gov decision Po is too high Set ceiling price Pmax Result Producers will produce less, drop to Q 1 Consumers demand more Q 2 at the lower price Demand > Supply = Excess Demand Q 2 -Q 1
- Slides: 43