Chapter 2 Motion in One Dimension How to


 0 n x = xf – xi n Where x =")


 would")


Create this graph on your GLX using your motion sensor. Position (m) (2) Describe")
Create this graph on your GLX using your motion sensor. Position (m) (2) Describe")
Create this graph on your GLX using your motion sensor. Position (m) (2) Describe")
Create this graph on your GLX using your motion sensor. Position (m) (2) Describe")


 Rise Run Time (s)")


 Consider this trip… Time (s)")
 INSTANTANEOUS VELOCITY How fast is the car going at this instant in")
 INSTANTANEOUS VELOCITY The slope of a curve at a given point, is")
 INSTANTANEOUS VELOCITY The slope of this line represents instantaneous velocity at the")
 graph describes a 1 D motion of a train. What")
 graph displays motions of two trains A")


 n e o i t a r e")
 + 0 - + velocity 0 velocity Time")
 The Slope of Velocity vs. Time Graphs Rise = v Run =")


 Using a graph 5 mi/hr 1 hour Time (hrs)")
 Find the “area under the curve” (AUC). 5 mi/hr 1 hour Time")


, (b), and (c) of the figure below represent")


 vf = vo + at and 2) x = ½")
 vf = vo")


- Slides: 76
Chapter 2: Motion in One Dimension
How to solve any physics problem: 1. 2. 3. 4. 5. Diagram or draw a picture Units and variables labeled Formulas written and ready to use Algebra shown with numbers and units Solution boxed with correct units and sig. figs.
There are three ways to describe motion. 1. Displacement 2. Velocity 3. Acceleration
Displacement and Velocity
First off, to describe motion, we must specify position.
But to specify position, we need to relate it to another known location You are here You want to be here
For motion in one dimension, it is convenient to use the x-axis. From this concept, we can create a number line.
Displacement 0 n n Displacement of an object - the change of position of the object NOTE: displacement is not always equal to the distance traveled.
Displacement ( x) 0 n x = xf – xi n Where x = displacement xf = final position xi = initial position
Example What is the displacement if a car moves from an initial position of 10 m to a final position of 80 m? x =80 m – 10 m = 70 m
Example What is the displacement if a car moves from an initial position of 80 m to a final position of 20 m? x =20 m – 80 m = -60 m Note: the negative sign indicates the direction of displacement.
Distance and Displacement Every morning you drive 4 miles from home to NPHS and then come back home at night using the same route. What is the best statement describing your daily trip? (Assume you do not move far while at NPHS) 1. 2. 3. 4. Your displacement is 0, distance traveled is 8 mi Your displacement is 8 mi, distance traveled is 0 Your displacement is 0, distance traveled is 0 Your displacement is 8 mi, distance traveled is 8 mi
VELOCITY – change in displacement over time. n Average velocity :
Units for velocity • The SI unit for velocity is m/s; however, a velocity can be given in other units such as: • Km/sec or km/hr or mi/hr • When calculating the velocity, be sure all your units match. If they don’t, you need to convert.
Example: It takes 6. 0 hours to drive to San Francisco from Newbury Park if driving at 65 mi/hr. How far is the trip? Newbury Park t = 6. 0 hrs v = 65 mi/hrs x = ? San Fransisco
Example: The United States is 4, 300 km wide. How long (in hours) would it take to drive across the country if someone were to drive at a steady 22 m/s the whole way? x = 4, 300 km v = 22 m/s t=?
Speed vs. Velocity n Speed is a SCALAR meaning it is only a number, direction doesn’t matter. n n Speed = (total distance)/(time) Velocity is a VECTOR meaning it has a number (magnitude) and direction. Direction matters. n n Velocity = (displacement)/(time) http: //www. youtube. com/watch? v=GKQdk S 0 q. G 3 g
Acceleration – rate of change in velocity over time.
Units of Acceleration
Example: A car is initially coasting up hill at 8. 5 m/s. 4. 75 seconds later, the car is now rolling backwards at 2. 6 m/s down the same hill. What is the car’s acceleration during this time period? - Vf Vo = 8. 5 m/s t = 4. 75 sec Vf = - 2. 6 m/s + Vo
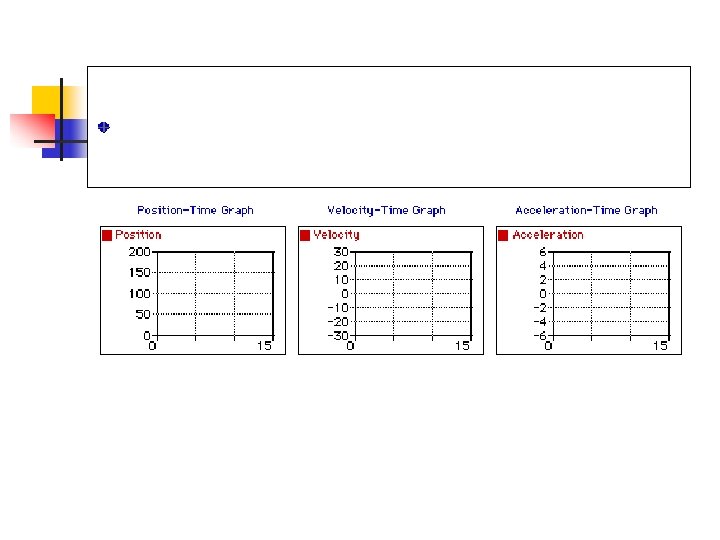
Another way to describe motion is to graph displacement and velocity as a function of time it
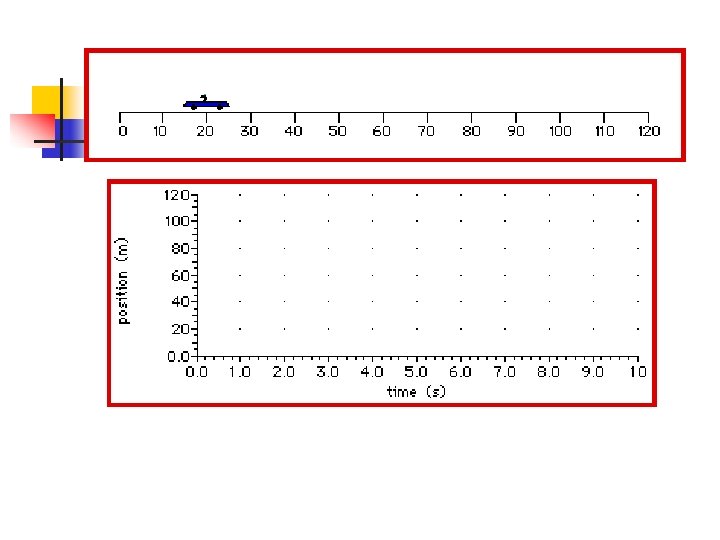
GLX Time! Plug motion sensor into one of the ports at the top (line the groove up) A position vs time graph should automatically open The “Play” button lets you start and stop data taking. There is no need to erase your graph. Just hit “Play” again to take more data and overwrite your old graph.
(1)Create this graph on your GLX using your motion sensor. Position (m) (2) Describe your motion in your notes. In this case, displacement stays constant with time…there is no movement. Time (s)
(1)Create this graph on your GLX using your motion sensor. Position (m) (2) Describe your motion in your notes. Here the object has a low constant velocity in the beginning, and then it changes to a higher constant velocity. Time (sec)
(1)Create this graph on your GLX using your motion sensor. Position (m) (2) Describe your motion in your notes. This time the object travels away from the starting point at constant velocity, stops for some amount of time and then travels back to its starting point at constant velocity. Time (s)
(1)Create this graph on your GLX using your motion sensor. Position (m) (2) Describe your motion in your notes. Velocity is not constant. Velocity (slope) is increasing at a constant rate. Time (s) Good luck on this one!
SPEED vs. VELOCITY n n n Both describe how fast the position is changing with respect to time. Speed is a SCALAR quantity. It indicates an amount (magnitude), but not direction. Velocity is a VECTOR quantity. It indicates both an amount (magnitude) and a direction.
SLOPE REVIEW
SLOPE REVIEW
SLOPE REVIEW
SLOPE REVIEW
SLOPE REVIEW
Position (m) Rise Run Time (s)
VELOCITY n n Velocity is represented by the SLOPE of the curve on a displacement vs. time graph. In this class, a positive (+) slope indicates a forward direction and a negative (-) slope indicates a backwards direction (return).
Use the position graph to answer the following: a. What is the object’s velocity from 10 – 15 seconds? 0 m/s (object is at rest) b. What is the object’s velocity from 15 – 25 seconds? = -4 m/s c. What is the object’s velocity from 0 – 40 seconds? = -1 m/s
Position (m) Consider this trip… Time (s)
Position (m) INSTANTANEOUS VELOCITY How fast is the car going at this instant in time? Time (s)
Position (m) INSTANTANEOUS VELOCITY The slope of a curve at a given point, is equal to the slope of a tangent line at that point. Time (s)
Position (m) INSTANTANEOUS VELOCITY The slope of this line represents instantaneous velocity at the indicated point. Time (s)
Describing Motion The x(t) graph describes a 1 D motion of a train. What must be true about this motion? 1. Speeds up all the time 2. Slows down all the time 3. Speeds up part of the time 4. Slows down part of the time 5. Speeds up & then slows down 6. Slows down & then speeds up Hint: What is the meaning of the slope of the x(t) graph?
Position vs. Time Graphs x The x(t) graph displays motions of two trains A and B on parallel tracks. Which statement is true? 1. At t 1 both trains have the same velocity A B t t 1 2. At t 1 both trains have the same speed 3. At t 1 both trains have the same acceleration 4. Both trains have the same velocity sometime before t 1 5. The trains never have the same velocity
End Position Graphs
Motion can be described with a velocity vs. time graph.
Velocity vs. Time 1 Velocity (m/s) n e o i t a r e l c c a constant velocity Time (s) s n co t n ta
Velocity vs. Time 2 Velocity (m/s) + 0 - + velocity 0 velocity Time (s) - velocity
Velocity (m/s) The Slope of Velocity vs. Time Graphs Rise = v Run = t Time (s)
Use the velocity graph to answer the following: a. What is the object’s velocity from 4 – 7 seconds? 3 m/s b. What is the object’s acceleration from 4 – 7 seconds? 0 m/s 2 (constant velocity) c. What is the object’s acceleration from 2 – 4 seconds? = 1 m/s 2
Consider a trip… A train travels at 5 miles per hour for 1 hour. What is its displacement after 1 hour? Displacement can also be determined by finding the area under the curve of a velocity vs. time graph.
Velocity (m/s) Using a graph 5 mi/hr 1 hour Time (hrs)
Velocity (m/s) Find the “area under the curve” (AUC). 5 mi/hr 1 hour Time (s) Area = l x w = 1 hour x 5 mi/hr = 5 miles.
Graphical analysis summary Displacement vs. Time graph: Slope = velocity Velocity vs. Time graph: Slope = acceleration AUC = displacement
Draw a “v vs. t” graph for: n A blue car moving at a constant speed of 10 m/s passes a red car that is at rest. This occurs at a stoplight the moment that the light turns green. n The red car accelerates from rest at 4 m/s/s for three seconds and then maintains a constant speed for 9 s. The blue car maintains a constant speed of 10 m/s for the entire 12 seconds.
The answer
QUICK QUIZ 2. 3 Parts (a), (b), and (c) of the figure below represent three graphs of the velocities of different objects moving in straight-line paths as functions of time. The possible accelerations of each object as functions of time are shown in parts (d), (e), and (f). Match each velocity-time graph with the acceleration-time graph that best describes the motion.
One way to look at the motion of an object is by using a motion map.
Imagine a toy car traveling along a piece of paper and dropping a dot of ink at a given time interval (say 1 drop every second). It could produce a trail that looks like this: Same time interval Between dots Time starts at zero distance Position and direction of object at a given instant in time
If the car produced the following motion map, how long did it take the car to travel the length of the paper? Same time interval Between dots Time starts at zero Position and direction of object at a given instant in time 1 sec 2 sec 3 sec 4 sec 5 sec 6 sec 7 sec 8 sec distance 8 seconds total
Describe the motion of the car? Stopped, constant velocity, accelerating or decelerating? Same time interval Between dots Time starts at zero Position and direction of object at a given instant in time distance How do you know?
Graphing Examples
a. Draw the motion map for the following: • Object accelerates for 3 seconds. • Then travels at a constant velocity for 2 seconds • Then decelerates for 3 seconds • Stops for 2 seconds • Then returns to the start in 4 seconds at a constant velocity. b. Sketch the velocity graph for the above motion.
Velocity with Constant Acceleration velocity v vo time t time
velocity vf Rise = vf - v o vo Run = t = (t – 0) = t t time (p. 35)
velocity vf Find the AUC… vi time t Break the area into two parts… Area = (l x w) + (½b x h) x = vit + ½ t(vf-vi)
velocity vf Find the AUC… vi time t AUC = x = vot + ½ t(vf-vo) x = vot + ½ vft – ½ vot x = ½ vot + ½ vft x = ½ (vo+vf)t distribution simplification p. (35)
We now know… 1) vf = vo + at and 2) x = ½ (vo + vf)t By substitution of equation #1 into #2 x = ½ [vo + (at +vo)]t x = ½ (2 vo + at)t x = vot + ½ at 2 substitution combining terms (p. 36)
Solve Eq #1 for t & substitute into Eq #2… 1) vf = vo + at 2) x = ½ (vo + vf)t (p. 36)
5 Parameters of Motion 1. a = acceleration 2. x = displacement m 3. vf = final velocity 4. vi = initial velocity 5. t = time sec
To solve a constant acceleration problem, you must know, or be able to find, three of the five parameters. Then use the following equations to solve for the other two: vf = vo + a t x = ½(vo + vf) t x = vo t + ½a( t)2 vf 2 = vo 2 + 2 a x
Example: A jet plane lands with a velocity of 100 m/sec and can slow down (-acceleration) at a maximum rate of – 5. 0 m/s 2. Find (a) the time required for the plane to come to rest, and (b) the minimum size of the runway. Example… a) vi = +100 m/s vf= 0 m/s a = -5. 0 m/s 2 b) Solve for x vf = vi + at 0 m/s = 100 m/s + (-5 m/s 2)t t = 20 s vf 2 = vi 2 + 2 a x 0 m/s = (100 m/s)2 + 2(- 5 m/s 2) x x = 1000 m
Example: A train is traveling down a straight track at 20 m/sec when the engineer applies the brakes, resulting in an acceleration of – 1 m/sec 2 as long as the train is in motion. How far does the train travel in the first 6 seconds after the breaks are applied? vi = 20 m/s 2 a = -1 m/sec 2 t = 6 sec x = ? x = vit + ½ at x = (20 m/s)(6 s) + ½ (-1 m/s 2)(6 s)2 x = 120 m – 18 m = 102 m x = 100 m (sig. figs!)
Example: A racing car starting from rest accelerates at a rate of 5. 00 m/s 2. What is the velocity of the car after it has traveled 100. ft? vi = 0 m/s a = 5. 0 m/sec 2 x = 100 ft= 30. 5 m vf = ? vf 2 = vi 2 + 2 a x vf 2 = 0 + 2(5 m/s 2)(30. 5 m) vf = 17. 5 m/s