Chapter 2 Mapping our World Cartography Cartography is


: Radio-navigation system of at least 24 satellites that")

- Slides: 36
Chapter 2 -Mapping our World
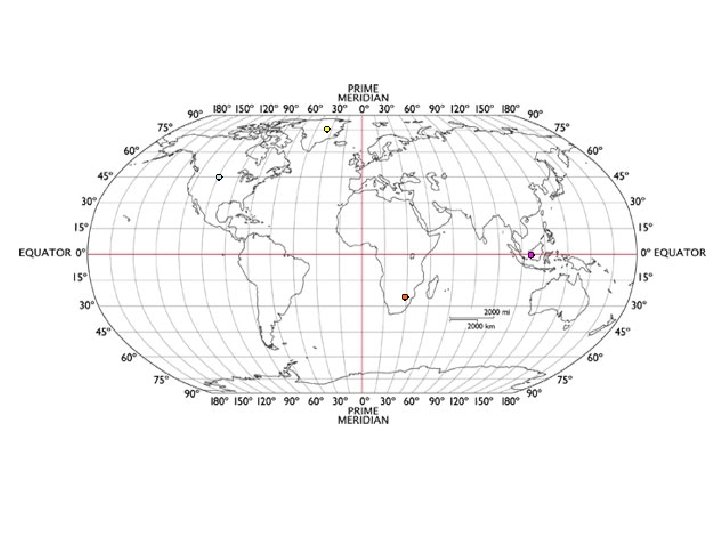
Cartography • Cartography is the science of mapmaking • Mapmakers are also called cartographers • Cartographers use an imaginary grid of parallel lines and vertical lines to locate points on Earth exactly!
The Equator circles the Earth halfway between the north and south poles and divides the Earth into 2 equal sections called the Northern Hemisphere and the Southern Hemisphere. The Prime Meridian runs through Greenwich, England extends through the north and south poles. It divides the Earth into 2 equal sections called the Western Hemisphere and the Eastern Hemisphere.
Latitude is the distance in degrees north or south of the equator • The equator is labeled as 0 latitude • The north and south poles are labeled as 90 latitude – Above the equator is labeled north – Below the equator is labeled south
Latitude
Longitude is the distance in degrees east or west of the prime meridian • The prime meridian is labeled as 0 longitude • Lines of longitude converge at the poles – The line at the opposite side of the prime meridian is the 180 line – To the right of the prime meridian is labeled East – To the left of the prime meridian is labeled West
Longitude
Latitude comes first when writing coordinates!
Time Zones • Earth is divided into 24 time zones – Earth takes about 24 hours to rotate once on its axis – The 24 time zones each represent 1 hour – Each time zone is 15 wide (basically corresponding to a line of longitude) – Some time zone boundaries have been moved to avoid confusion
Time Zones
The U. S. has 7 time zones
International Date Line • The International Date Line, or 180 meridian, serves as the transition line for calendar days – If you travel west across the line, you would go up one calendar day – If you travel east across the line, you would go down one calendar day
International Date Line
Projections • Cartographers use projections to make maps – Made by transferring points and lines on a globe’s surface onto a sheet of paper Conic projection Gnomonic Projection Mercator Projection Interrupted Projection
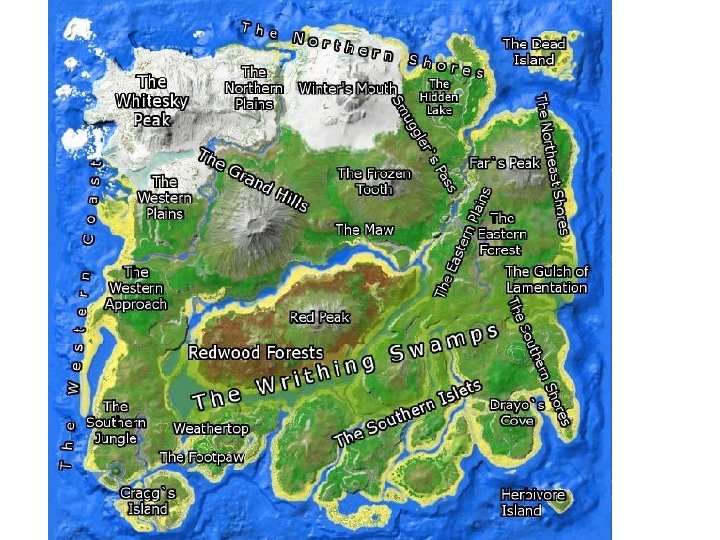
• Topographic maps are detailed maps showing the hills and valleys of an area – Shows: • • • Changes in Elevation Mountains Rivers Bridges Major Landmarks – Uses lines, symbols and colors to represent changes in elevation & features on Earth’s surface Topographic Maps
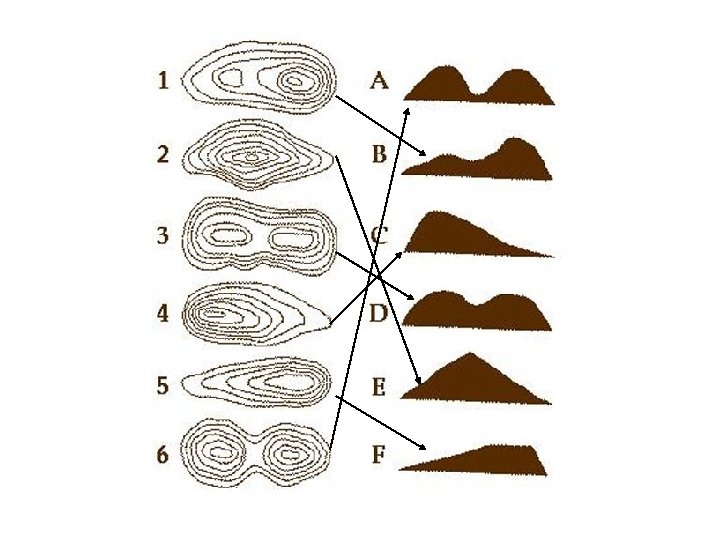
Contour Lines • Contour lines represent elevation on a topographic map – Connect points of equal elevation • Elevation: Distance of a location above or below sea level • Never cross (1 spot cannot have more than 1 elevation)
Contour Intervals • Contour intervals are the difference in elevation between two side-by-side contour lines – Dependent on the terrain • Contour lines close together indicate a steep slope • Contour lines far apart indicate a gradual slope
• Depression contour lines are used to represent elevations that are lower than the surrounding landscape. – Depression contour lines have hachures • Hachures: Short lines at right angle to the contour line
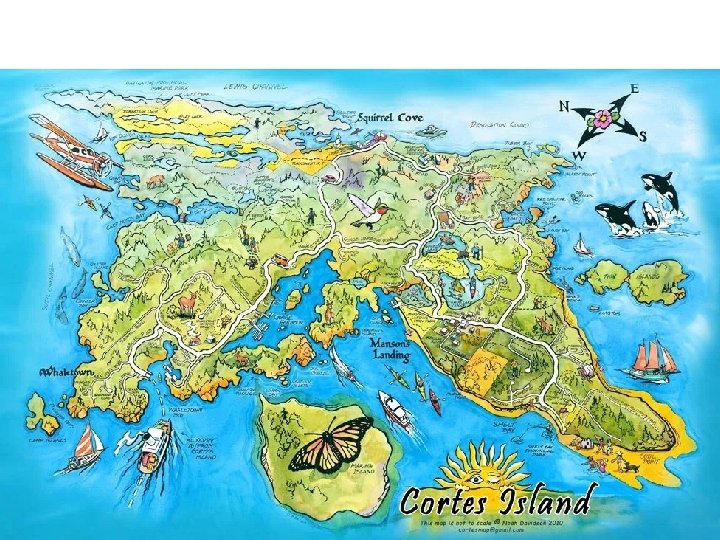
MAP LEGENDS • A map legend explains what the symbols on a map represent
MAP SCALE • The ratio between distances on a map and actual distances on the surface of Earth
• Verbal Scale: Expresses distance as a statement • Fractional Scale: Expresses distance as a ratio • Graphic Scale: A line that represents a certain distance
Verbal Scale: Expresses distance as a statement Graphic Scale: A line that represents a certain distance Fractional Scale: Expresses distance as a ratio
• Remote sensing is the process of collecting data about Earth from far above the Earth’s surface • Satellites detect different wavelengths of energy reflected or emitted from Earth’s surface – Energy has both magnetic and electric properties REMOTE SENSING
• Landsat: Receives reflected wavelengths of energy emitted by Earth’s surface – Used to identify features on Earth’s surface and to study the movements of Earth’s plates, rivers, earthquakes and pollution
• Topex/Poseidon Satellite: Use radar to map features on the ocean floor
• GPS (Global Positioning System): Radio-navigation system of at least 24 satellites that allow users to determine their exact position on Earth. – Calculates your latitude/longitude/speed/etc.
• Sea Beam: Used to map the ocean floor – Located on an ocean ship – Uses sonar (sound waves)