CHAPTER 2 KEY ISSUE 2 Why is the


 – total number of live births expected")
 Highest in Africa and South/Southwest Asia")
 High in Africa, but also in many more developed countries")
 Many developing countries have high NIR, while developed countries are")


 �Average number of children a woman will")
 Like CBR, highest in SS Africa & SE/SW Asia")
 Total deaths (before first year) per 1,")
 Highest in SS Africa & all of South Asia; indicator")


- Slides: 33
CHAPTER 2 KEY ISSUE 2 Why is the Global Population Increasing?
About 82 million people are added to the population of the world annually.
Like population itself, POPULATION GROWTH is not uniformly distributed.
Measuring Population Growth Crude Birth Rate (CBR) – total number of live births expected for every 1, 000 people (year) Crude Death Rate (CDR) – total number of expected deaths for every 1, 000 people (year) = Natural Increase Rate (NIR) – percentage by which a population grows in a year. CBR - CDR = NIR
Global Birth Rates (CBR) Highest in Africa and South/Southwest Asia
GLOBAL DEATH RATE (CDR) High in Africa, but also in many more developed countries
GLOBAL NATURAL INCREASE (NIR) Many developing countries have high NIR, while developed countries are very low
NIR does NOT account for immigration/emigration, only births v. deaths
…But that’s for next chapter! Many developed countries would either stay flat or actually shrink in population, if not for IMMIGRATION
Other Important Metrics TOTAL FERTILITY RATE (TFR) �Average number of children a woman will have throughout her childbearing years (15– 49) �World TFR is 2. 5 �TFR often exceeds 5 in sub-Saharan Africa, while at 2/less in nearly all European countries.
GLOBAL FERTILITY (TFR) Like CBR, highest in SS Africa & SE/SW Asia
Other Important Metrics Infant Death Rate (IDR) Total deaths (before first year) per 1, 000 live births • AKA Infant Mortality (IMR)
GLOBAL INFANT MORTALITY (IDR) Highest in SS Africa & all of South Asia; indicator of level of development
Summary of Patterns Developing Countries Higher rates of… Natural increase Crude birth Total fertility Infant mortality Developed Countries Lower rates of… Natural increase Crude birth Total fertility Infant mortality
DOUBLING TIME � The time it would take for a population to double at current natural growth rates. Used to project future population 2015 NIR (1. 2%): 54 years. 1963 NIR of (2. 2%): 35 years. If this held true, the world pop’n would be 10 billion right now!
DOUBLING TIME is volatile because even small changes in NIR can have major impact on projected doubling times.
Sources of Pop’n � Data United States Census Bureau � Federal body responsible for producing data about the American people and economy
The CENSUS � Official pop’n count conducted every 10 years (on years ending in Purpose is to count every person in the United States, and to collect data about them ‘ 0’)
The CENSUS is controversial because. NONPARTICIPATION EXTRAPOLATION Not everyone can be counted, – homeless, so illegal aliens, etc ‘extrapolations, ’ - and not or educated everyone thinks guesses, are they SHOULD made for certain be populations
Sources of � � Pop’n Data Population Reference Bureau - nonprofit Releases Annual Report. World Population Data Sheet � presents data from 200 countries on important demographic and health metrics
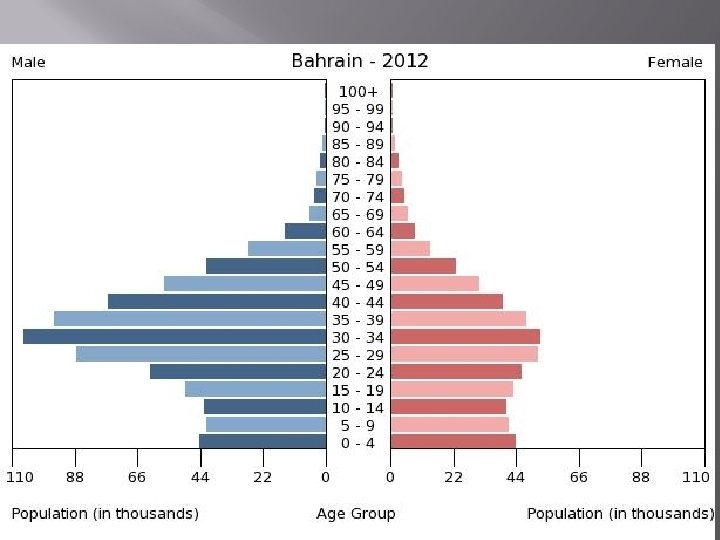
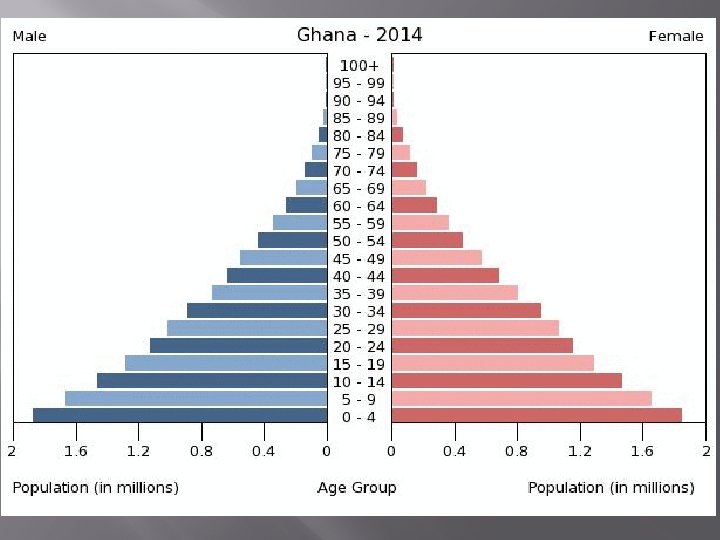
Population Structure Much can be learned by analyzing the age and sex structure of a country’s population �A special bar graph known as a POPULATION PYRAMID can visually display a country’s distinctive population structure.
Populations structures vary by country…
…and also from place to place within a country!
Issues in population pyramids �DEPENDENCY RATIO The number of people who are too young/old to work, compared to the number of people in their productive years. �Ages 0 -14 and 65+ are Dependents. �Larger ratios mean high financial burden on working class, who must pay for care of the young/old.
Sweden’s pyramid is healthier, with a strong The pyramid of Ghana has a heavy YOUTH working population to support dependents BULGE – a large proportion of young dependents
Issues in population pyramids �SEX RATIO Defined as the number of males per 100 females in the population � Developed countries have more females, as they live 7 years longer on average. � Many developing countries have more men, because male babies are preferred
GLOBAL SEX RATIO
Sometimes imbalances are due to historical factors. WHY MIGHT MORE ELDERLY RUSSIANS BE WOMEN?
Population Pyramids allow us to visualize data and to assess demographic issues in a country
Signs of trouble…. .
DEVELOPED COUNTRIES Australia Austria Belgium Canada Denmark Finland France Germany Greece Iceland Ireland Israel Italy Netherlands New Zealand Norway Portugal South Africa Spain Sweden Switzerland Turkey United Kingdom United States