Chapter 2 Functions and Their Graphs Section 3


 of x does f have a local maximum? What")

 = 3 x 2")

")

- Slides: 14
Chapter 2 Functions and Their Graphs
Section 3 Properties of Functions
Even and Odd Functions A function is even if, for every number x in its domain, the number –x is also in the domain and f(-x) = f(x) A function is odd if, for every number x in its domain, the number –x is also in the domain and f(-x) = -f(x) Graphs of Even and Odd Functions: Even – if the graph has symmetry with respect to the y-axis Odd – if the graph has symmetry with respect to the origin
Example 1: Determine whether each graph is even, odd or neither.
Example 2: Identify if the function if even, odd or neither. * Start by plugging in –X; if that deosn’t work, make entire function negative a) f(x) = x 2 – 5 b) g(x) = x 3 – 1 c) h(x) = 5 x 3 – x
A function f is increasing on an open interval I if, for any choice of x 1 and x 2 in I, with x 1 < x 2, we have f(x 1) < f(x 2) A function f is decreasing on an open interval I if, for any choice of x 1 and x 2 in I, with x 1 < x 2, we have f(x 1) > f(x 2) A function f is constant on an open interval I if, for all choices of x in I, the values f(x) are equal
Local Maxima and Local Minima A function f has a local maximum at c if there is an open interval I containing c so that, for all x not equal to c in I, f(x) < f(c). We call f(c) a local maximum of f (the graph changes from increasing to decreasing) A function f has a local minimum at c if there is an open interval I containing c so that, for all x not equal to c in I, f(x) > f(c). We call f(c) a local minimum of f (the graph changes from decreasing to increasing)
Example 4: At what value(s) of x does f have a local maximum? What are the maximums? At what value(s) of x does f have a local minimum? What are the minimums?
Using a Calculator to Determine Local Maximums and Minimums Find the local max and min for f(x) = 6 x 3 – 12 x + 5 for -2 < x < 2 (don’t forget to change your window!!) Local max: 2 nd TRACE Maximum Left? , Right? , Guess? Local min: 2 nd TRACE Minimum Left? , Right? , Guess? Where is it increasing and decreasing? ?
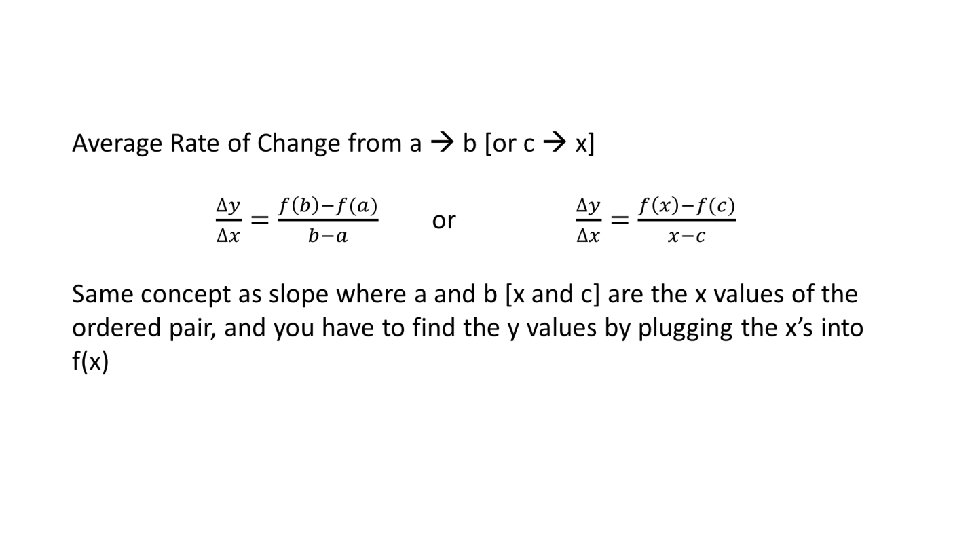
Example 6: Find the average rate of change of f(x) = 3 x 2 from: a) 1 to 3 b) 1 to 5 c) 1 to 7
Slope of the Secant Line The average rate of change of a function from a to b equals the slope of the secant line containing two points (a, f(a)) and (b, f(b)) on its graph.
? ? #s 11 -19 odd, 21, 35, 53, 57 (if there is time)
EXIT SLIP