
CHAPTER 2 Fuel for Exercise Bioenergetics and Muscle
CHAPTER 2 Fuel for Exercise: Bioenergetics and Muscle Metabolism
Terminology • Substrates – Fuel sources from which we make energy (adenosine triphosphate [ATP]) – Carbohydrate, fat, protein • Bioenergetics – Process of converting substrates into energy – Performed at cellular level • Metabolism: chemical reactions in the body
Measuring Energy Release • Can be calculated from heat produced • 1 calorie (cal) = heat energy required to raise 1 g of water from 14. 5°C to 15. 5°C • 1, 000 cal = 1 kcal = 1 Calorie (dietary)
Carbohydrate • All carbohydrate converted to glucose – 4. 1 kcal/g; ~2, 500 kcal stored in body – Primary ATP substrate for muscles, brain – Extra glucose stored as glycogen in liver, muscles • Glycogen converted back to glucose when needed to make more ATP • Glycogen stores limited (2, 500 kcal), must rely on dietary carbohydrate to replenish
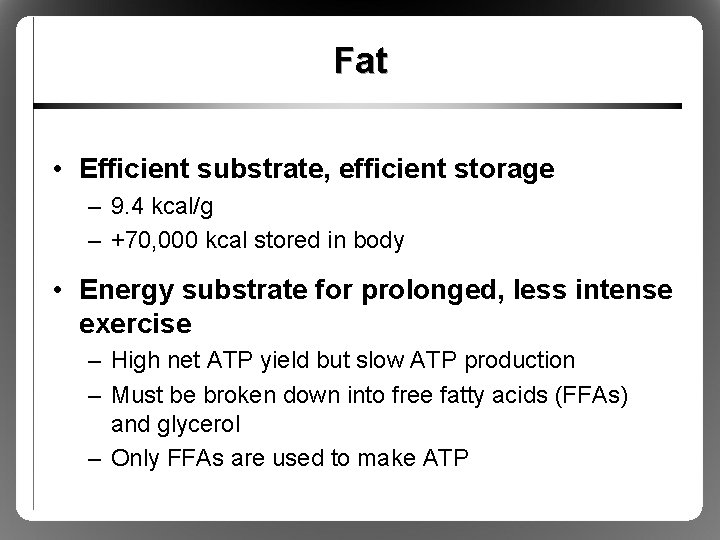
Fat • Efficient substrate, efficient storage – 9. 4 kcal/g – +70, 000 kcal stored in body • Energy substrate for prolonged, less intense exercise – High net ATP yield but slow ATP production – Must be broken down into free fatty acids (FFAs) and glycerol – Only FFAs are used to make ATP
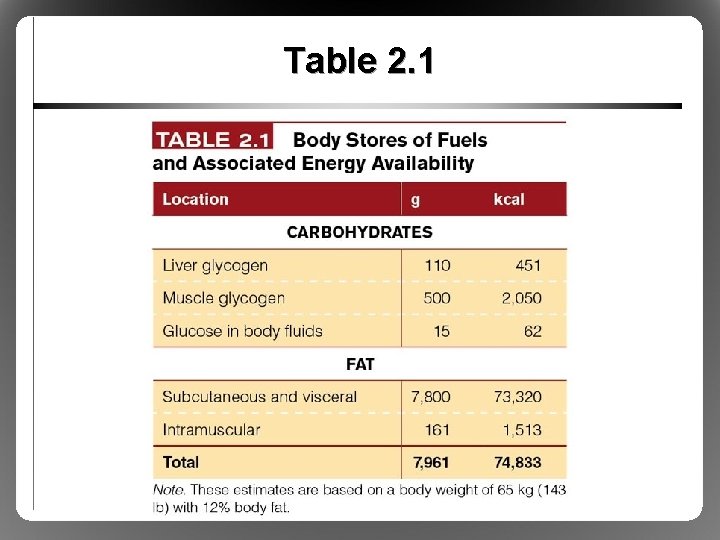
Table 2. 1
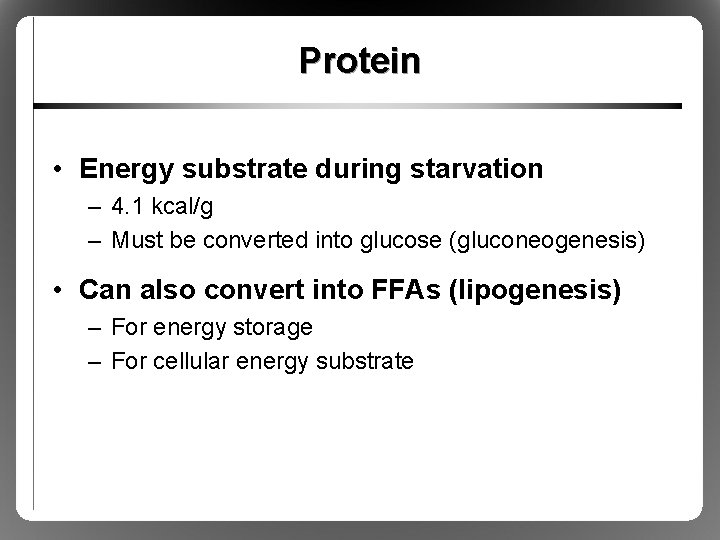
Protein • Energy substrate during starvation – 4. 1 kcal/g – Must be converted into glucose (gluconeogenesis) • Can also convert into FFAs (lipogenesis) – For energy storage – For cellular energy substrate
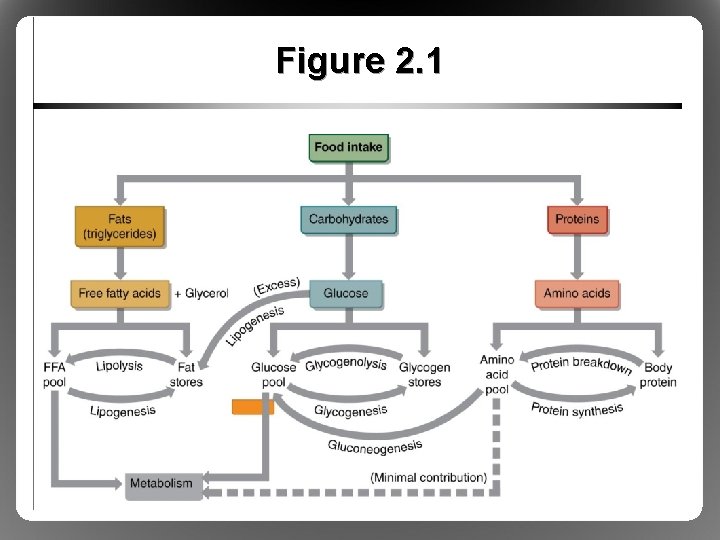
Figure 2. 1
Stored Energy: High-Energy Phosphates • ATP stored in small amounts until needed • Breakdown of ATP to release energy – ATP + water + ATPase ADP + Pi + energy – ADP: lower-energy compound, less useful • Synthesis of ATP from by-products – ADP + Pi + energy ATP (via phosphorylation) – Can occur in absence or presence of O 2
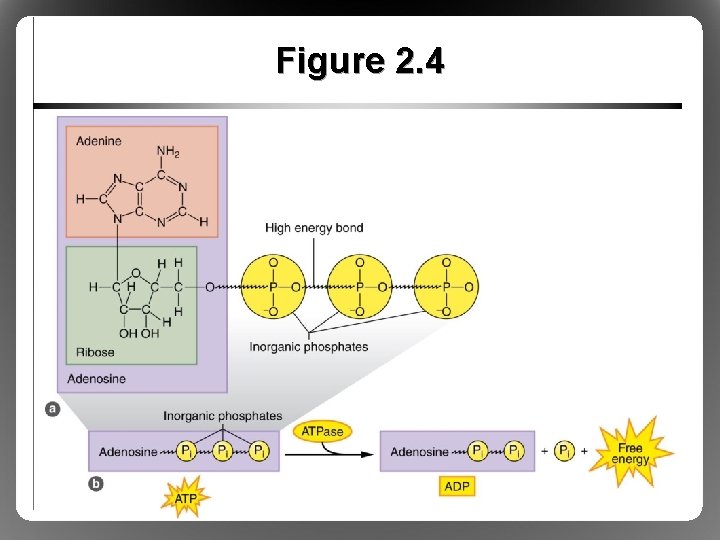
Figure 2. 4
Bioenergetics: Basic Energy Systems • ATP storage limited • Body must constantly synthesize new ATP • Three ATP synthesis pathways – ATP-PCr system (anaerobic metabolism) – Glycolytic system (anaerobic metabolism) – Oxidative system (aerobic metabolism)
ATP-PCr System • Anaerobic, substrate-level metabolism • ATP yield: 1 mol ATP/1 mol PCr • Duration: 3 to 15 s • Because ATP stores are very limited, this pathway is used to reassemble ATP
ATP-PCr System • Phosphocreatine (PCr): ATP recycling – PCr + creatine kinase Cr + Pi + energy – PCr energy cannot be used for cellular work – PCr energy can be used to reassemble ATP • Replenishes ATP stores during rest • Recycles ATP during exercise until used up (~3 -15 s maximal exercise)
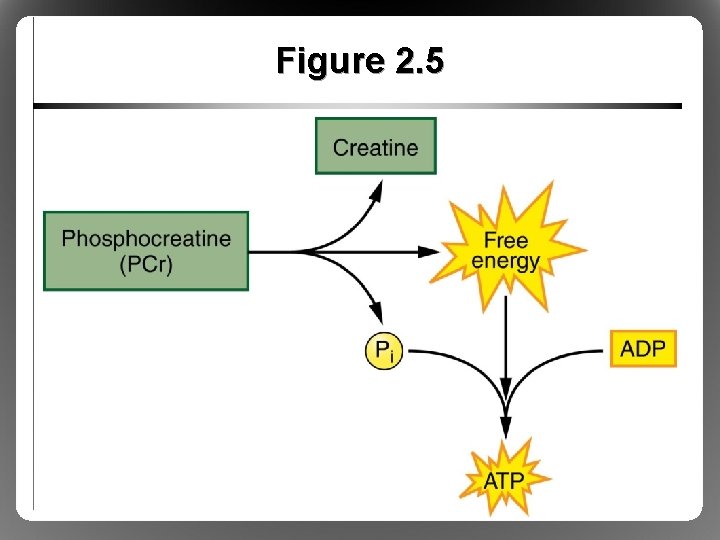
Figure 2. 5
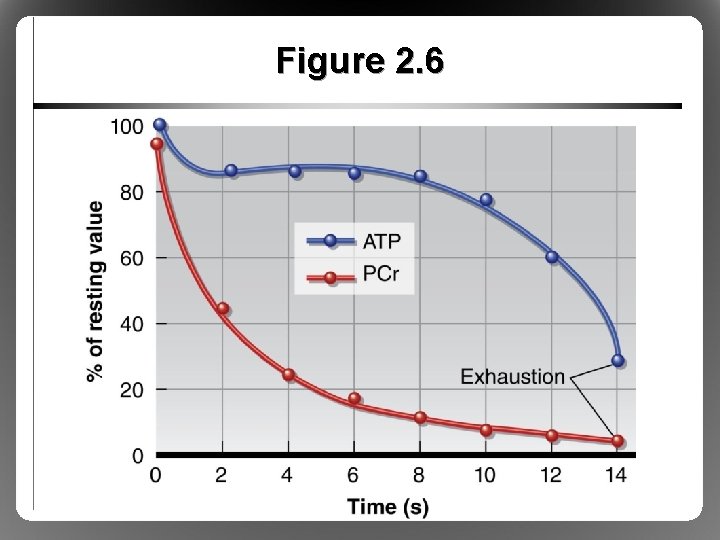
Figure 2. 6
Glycolytic System • Anaerobic • ATP yield: 2 to 3 mol ATP/1 mol substrate • Duration: 15 s to 2 min • Breakdown of glucose via glycolysis
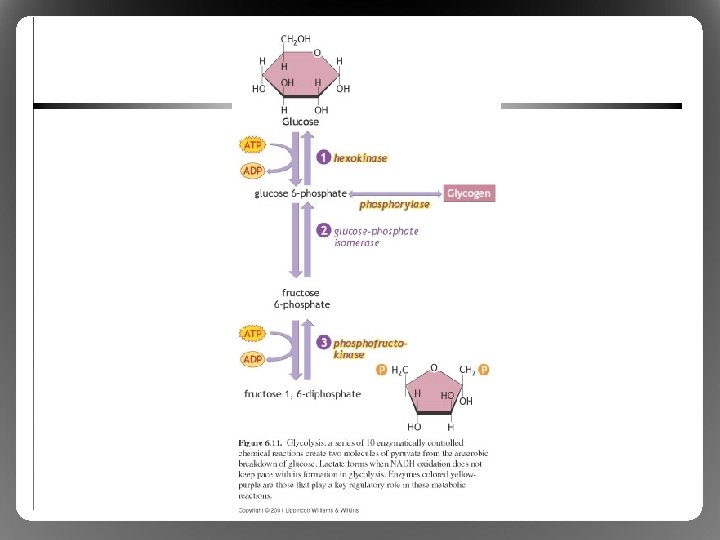
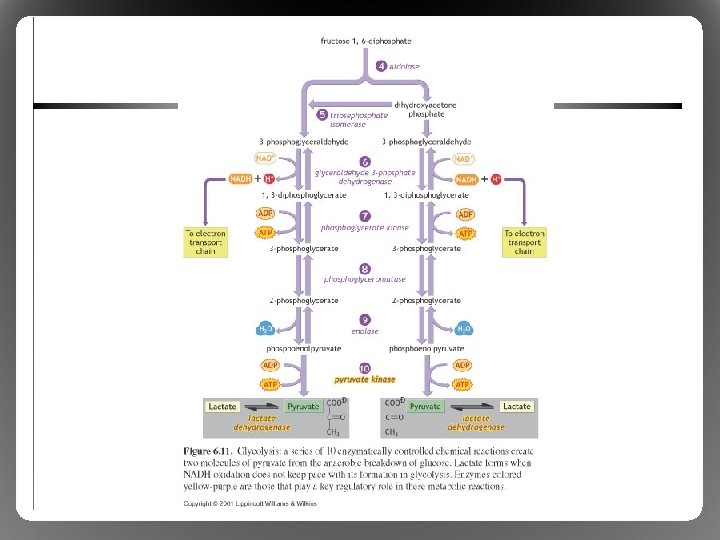
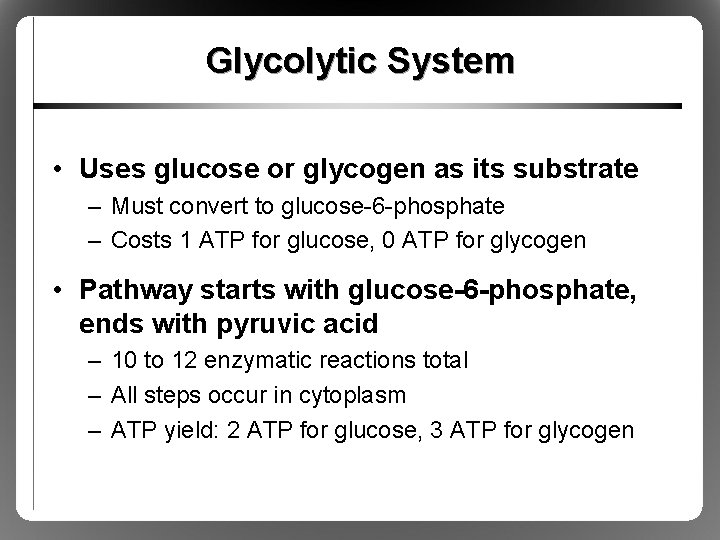
Glycolytic System • Uses glucose or glycogen as its substrate – Must convert to glucose-6 -phosphate – Costs 1 ATP for glucose, 0 ATP for glycogen • Pathway starts with glucose-6 -phosphate, ends with pyruvic acid – 10 to 12 enzymatic reactions total – All steps occur in cytoplasm – ATP yield: 2 ATP for glucose, 3 ATP for glycogen
Glycolytic System • Cons – Low ATP yield, inefficient use of substrate – Lack of O 2 converts pyruvic acid to lactic acid – Lactic acid impairs glycolysis, muscle contraction • Pros – Allows muscles to contract when O 2 limited – Permits shorter-term, higher-intensity exercise than oxidative metabolism can sustain
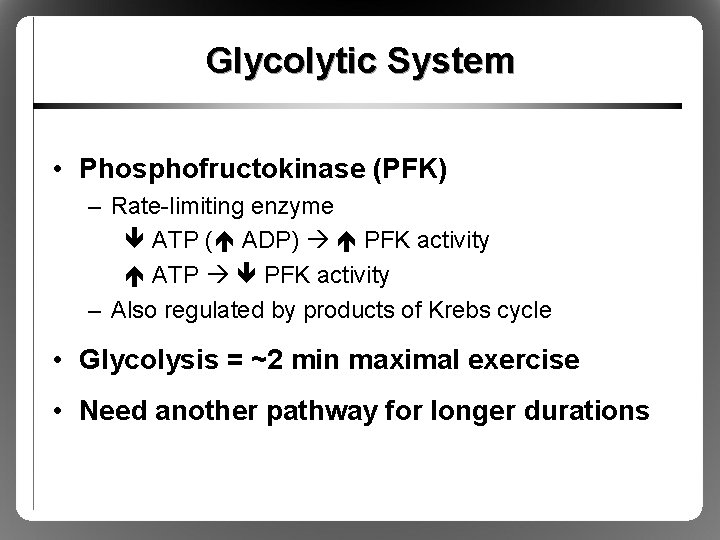
Glycolytic System • Phosphofructokinase (PFK) – Rate-limiting enzyme ATP ( ADP) PFK activity ATP PFK activity – Also regulated by products of Krebs cycle • Glycolysis = ~2 min maximal exercise • Need another pathway for longer durations
Oxidative System • Aerobic • ATP yield: depends on substrate – 32 to 33 ATP/1 glucose – 100+ ATP/1 FFA • Duration: steady supply for hours • Most complex of three bioenergetic systems • Occurs in the mitochondria, not cytoplasm
Oxidation of Carbohydrate • Stage 1: Glycolysis • Stage 2: Krebs cycle • Stage 3: Electron transport chain
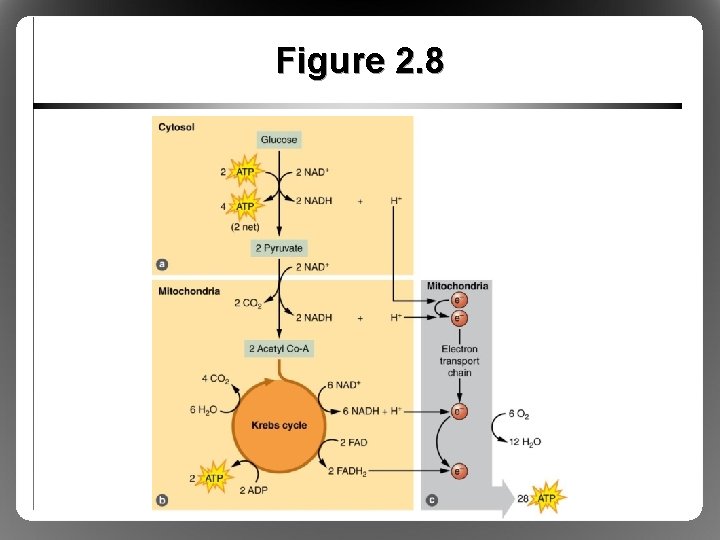
Figure 2. 8
Oxidation of Carbohydrate: Glycolysis Revisited • Glycolysis can occur with or without O 2 – ATP yield same as anaerobic glycolysis – Same general steps as anaerobic glycolysis but, in the presence of oxygen, – Pyruvic acid acetyl-Co. A, enters Krebs cycle
Oxidation of Carbohydrate: Krebs Cycle • 1 Molecule glucose 2 acetyl-Co. A – 1 molecule glucose 2 complete Krebs cycles – 1 molecule glucose double ATP yield • 2 Acetyl-Co. A 2 GTP 2 ATP • Also produces NADH, FADH, H+ – Too many H+ in the cell = too acidic – H+ moved to electron transport chain
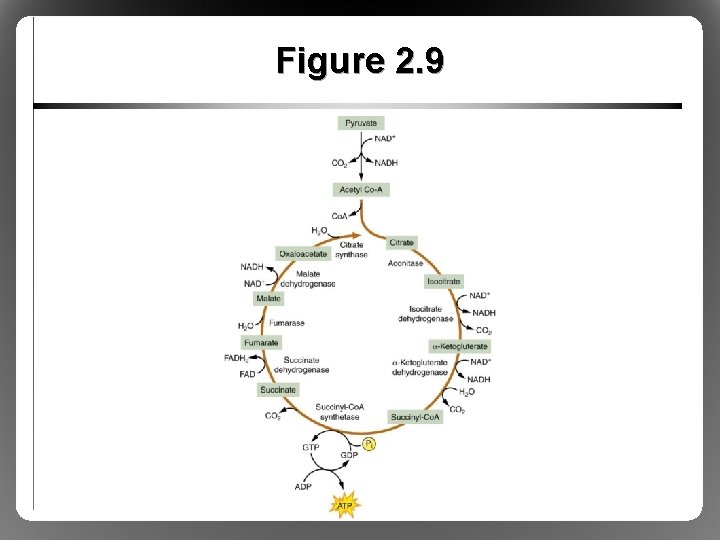
Figure 2. 9
Oxidation of Carbohydrate: Electron Transport Chain • H+, electrons carried to electron transport chain via NADH, FADH molecules • H+, electrons travel down the chain – – H+ combines with O 2 (neutralized, forms H 2 O) Electrons + O 2 help form ATP 2. 5 ATP per NADH 1. 5 ATP per FADH
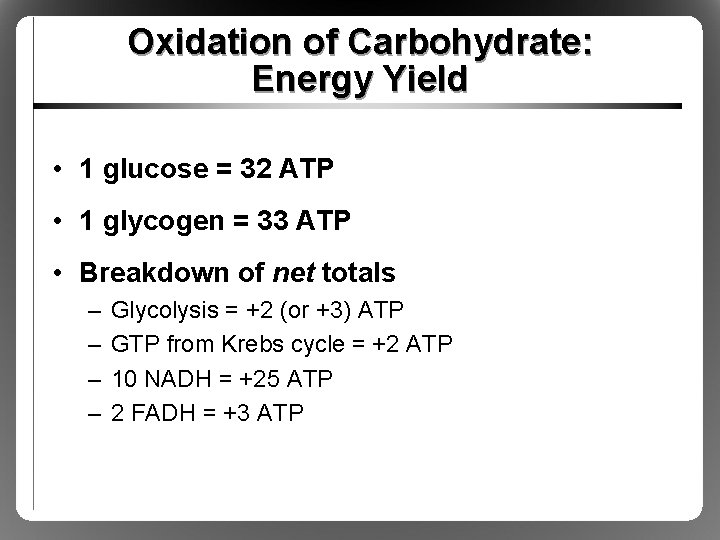
Oxidation of Carbohydrate: Energy Yield • 1 glucose = 32 ATP • 1 glycogen = 33 ATP • Breakdown of net totals – – Glycolysis = +2 (or +3) ATP GTP from Krebs cycle = +2 ATP 10 NADH = +25 ATP 2 FADH = +3 ATP
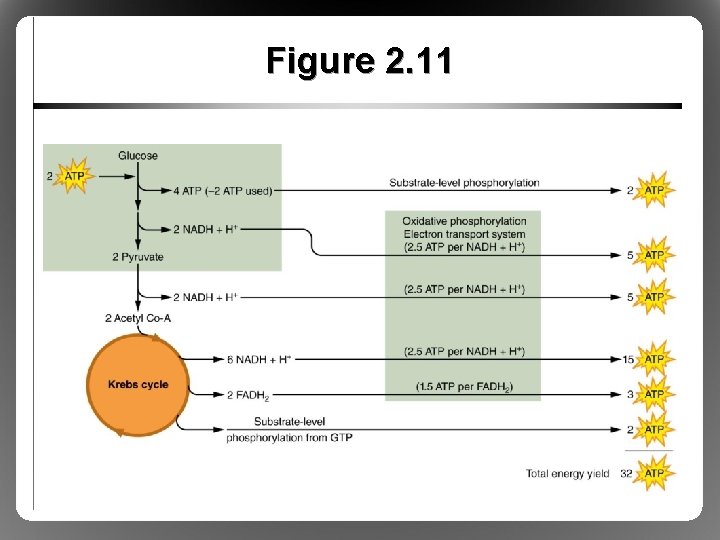
Figure 2. 11
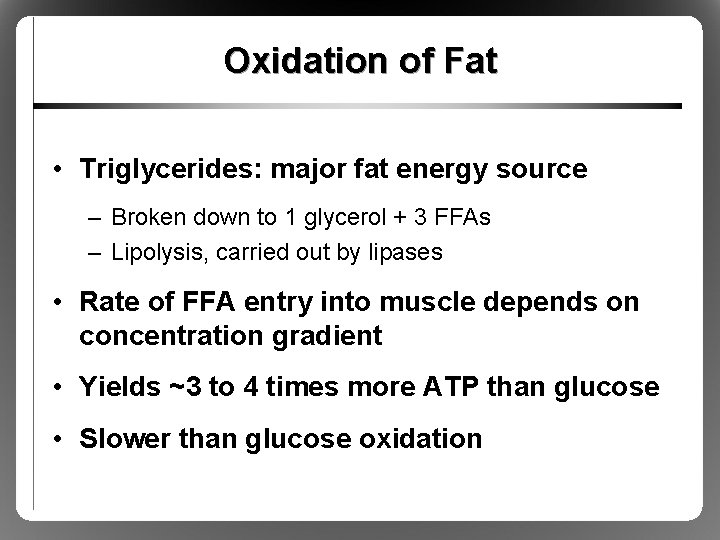
Oxidation of Fat • Triglycerides: major fat energy source – Broken down to 1 glycerol + 3 FFAs – Lipolysis, carried out by lipases • Rate of FFA entry into muscle depends on concentration gradient • Yields ~3 to 4 times more ATP than glucose • Slower than glucose oxidation
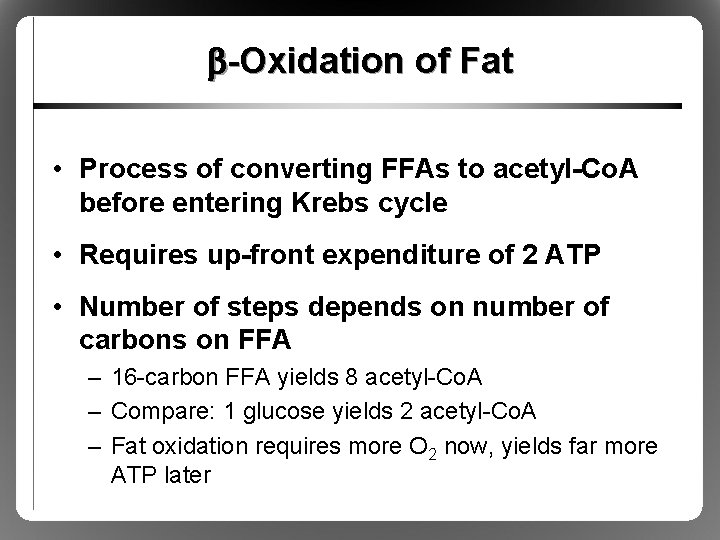
b-Oxidation of Fat • Process of converting FFAs to acetyl-Co. A before entering Krebs cycle • Requires up-front expenditure of 2 ATP • Number of steps depends on number of carbons on FFA – 16 -carbon FFA yields 8 acetyl-Co. A – Compare: 1 glucose yields 2 acetyl-Co. A – Fat oxidation requires more O 2 now, yields far more ATP later
Oxidation of Fat: Krebs Cycle, Electron Transport Chain • Acetyl-Co. A enters Krebs cycle • From there, same path as glucose oxidation • Different FFAs have different number of carbons – Will yield different number of acetyl-Co. A molecules – ATP yield will be different for different FFAs – Example: for palmitic acid (16 C): 129 ATP net yield
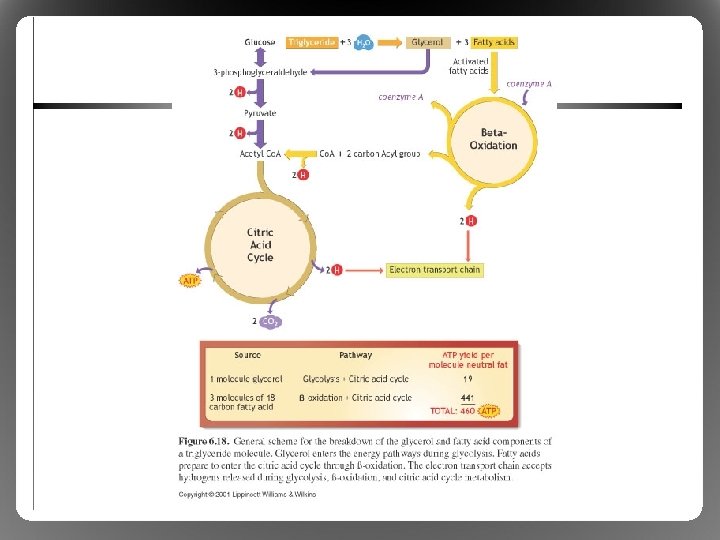
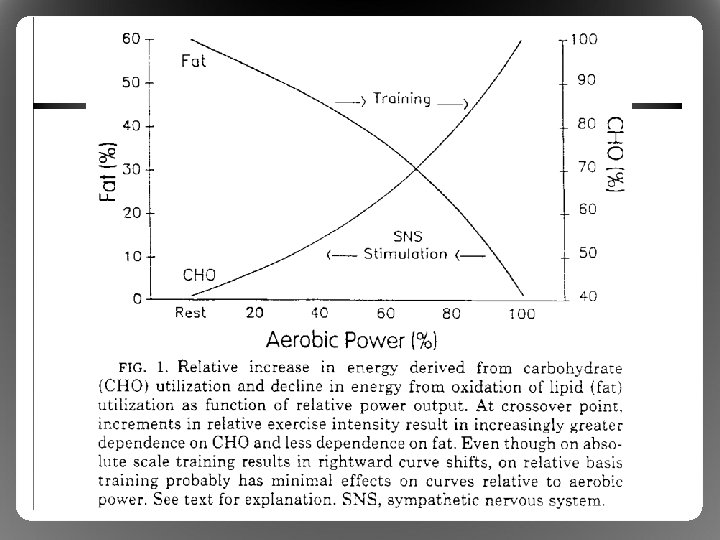
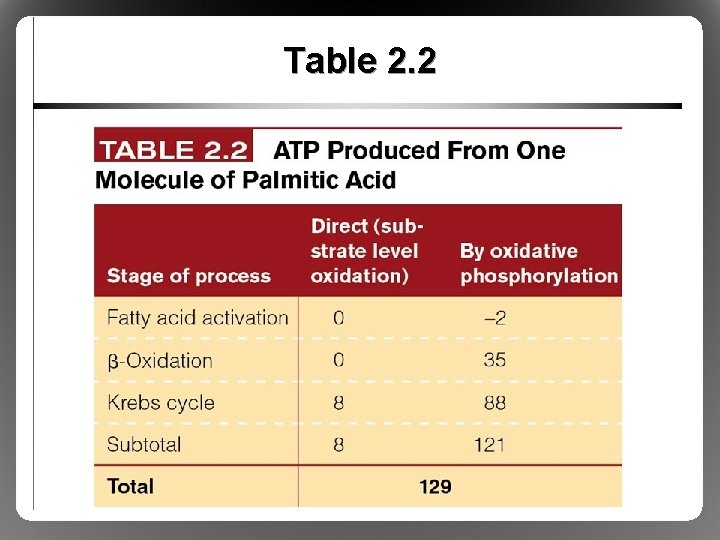
Table 2. 2
Oxidation of Protein • Rarely used as a substrate – Starvation – Can be converted to glucose (gluconeogenesis) – Can be converted to acetyl-Co. A • Energy yield not easy to determine – Nitrogen presence unique – Nitrogen excretion requires ATP expenditure – Generally minimal, estimates therefore ignore protein metabolism
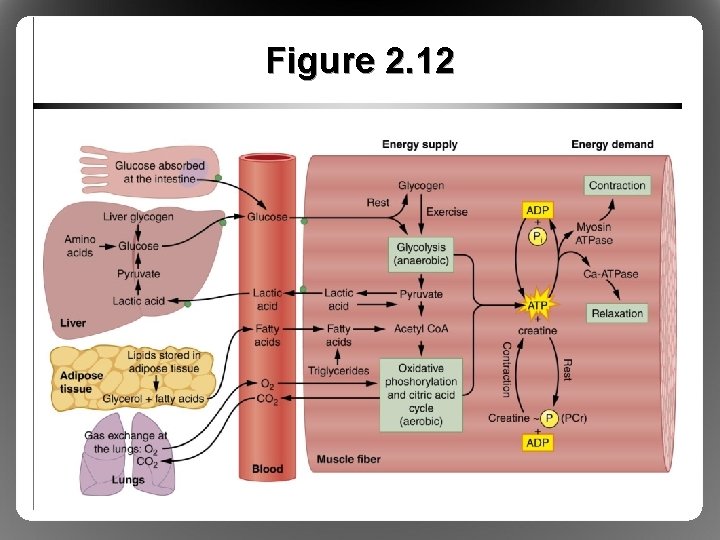
Figure 2. 12
Interaction Among Energy Systems • All three systems interact for all activities – No one system contributes 100%, but – One system often dominates for a given task • More cooperation during transition periods
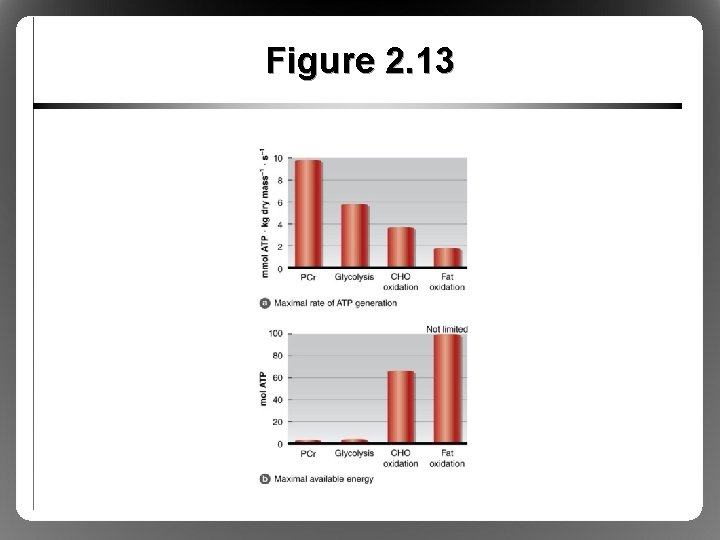
Figure 2. 13
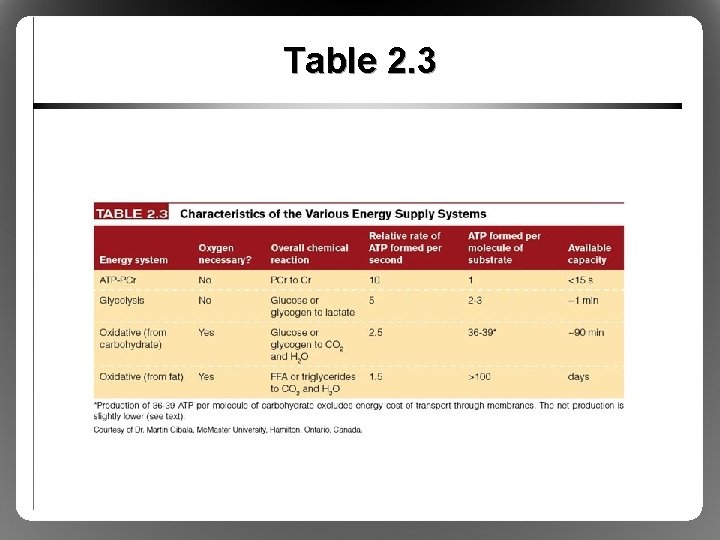
Table 2. 3
Oxidative Capacity of Muscle • Not all muscles exhibit maximal oxidative capabilities • Factors that determine oxidative capacity – Enzyme activity – Fiber type composition, endurance training – O 2 availability versus O 2 need
Enzyme Activity • Not all muscles exhibit optimal activity of oxidative enzymes • Enzyme activity predicts oxidative potential • Representative enzymes – Succinate dehydrogenase – Citrate synthase • Endurance trained versus untrained
Fiber Type Composition and Endurance Training • Type I fibers: greater oxidative capacity – More mitochondria – High oxidative enzyme concentrations – Type II better for glycolytic energy production • Endurance training – Enhances oxidative capacity of type II fibers – Develops more (and larger) mitochondria – More oxidative enzymes per mitochondrion
Oxygen Needs of Muscle • As intensity , so does ATP demand • In response – Rate of oxidative ATP production – O 2 intake at lungs – O 2 delivery by heart, vessels • O 2 storage limited—use it or lose it • O 2 levels entering and leaving the lungs accurate estimate of O 2 use in muscle
- Slides: 45