Chapter 2 DENSITY CURVES AND THE NORMAL DISTRIBUTION

Chapter 2 DENSITY CURVES AND THE NORMAL DISTRIBUTION

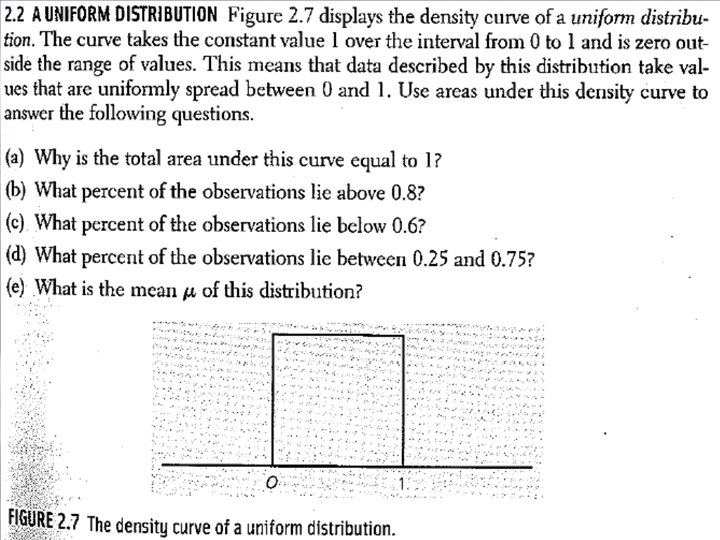
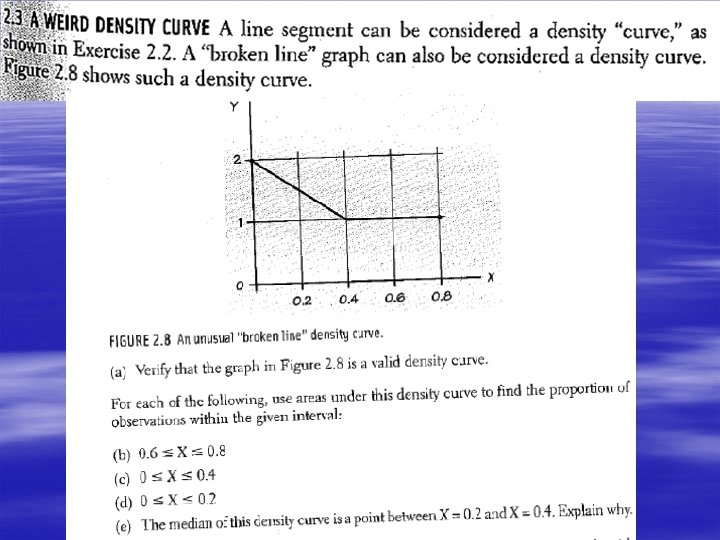
Density Curve § A graph that represents the relative frequency distribution for a set of data § It can be used to describe the overall pattern of a distribution. § Often an idealized version – “Mathematical Model” § ALWAYS above or on the horizontal axis § ALWAYS bounds AREA = 1 § AREA bounded is used to tell the proportion of observations within a range of values.

Examples 1 AREA = 1 1 1/2 1 2 3 4 5 6 AREA = 1 1/6 1 2 3 4 5 6

FROM HISTOGRAM … TO … A DESITY CURVE TOTAL AREA OF ALL BARS = 1 A Mathematical Model – an idealized representation of reality

ACTUAL % OF SCORES LESS THAN 6. . IS THE AREA OF THE HISTOGRAM BARS AREA = 0. 303

AREA OF THE APPROXIMATED DENSITY CURVE IS NOT EXACT! AREA OF SHADED REGION = 0. 293 … (i. e. 0. 01 lower than the actual area)

Total Area = 1. 00 Area =. 12 7 8

Let’s ROLL A DISTRIBUTION § § § § § Ski p fo P. 84 # 2. 5 Simulate the act of “Rolling a single die” {1, 2, 3, 4, 5, 6} Clear L 1 MATH >>> PRB 5: Rand. Int(1, 6, 100) STO L 1 WINDOW: X [1, 7]; Y [-5, 25] YScl = 5 STAT PLOT: Histogram for L 1 Repeat … Are we all the same? r no w…

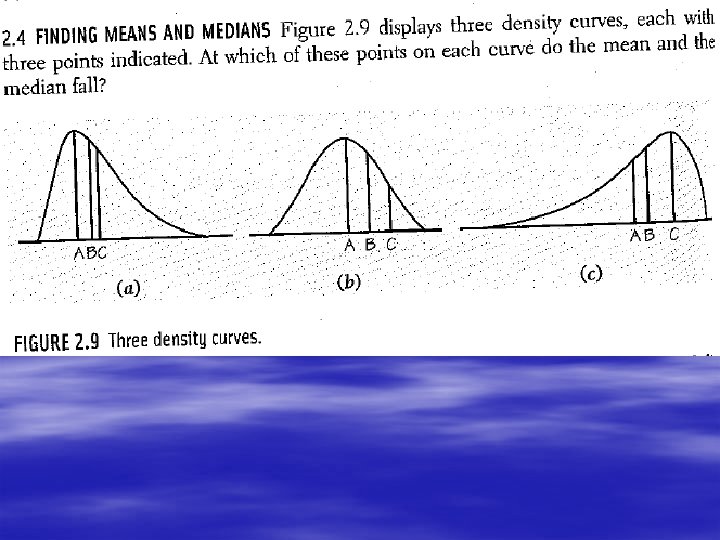
Mean and Median § MEAN: If the distribution were to be made out of solid material … the MEAN would be the balancing point. § MEDAIN: The point where the area under the curve is divided into to equal halves. § Same ideas from last chapter … regarding the impact of skewing. § Skewed Data

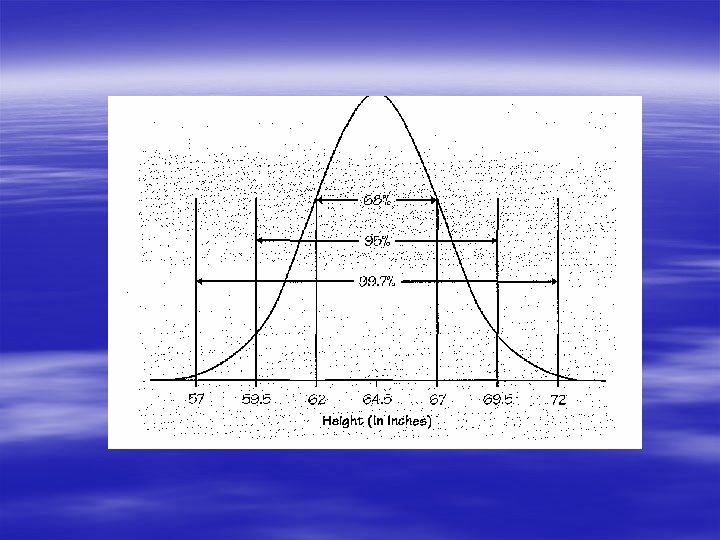
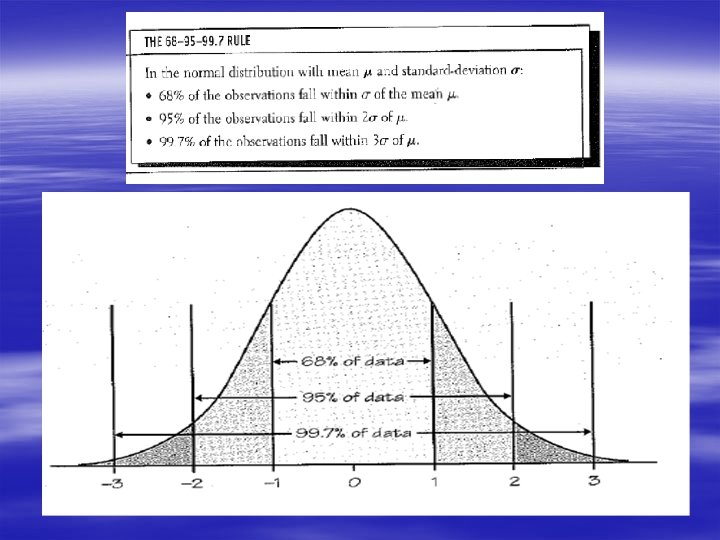
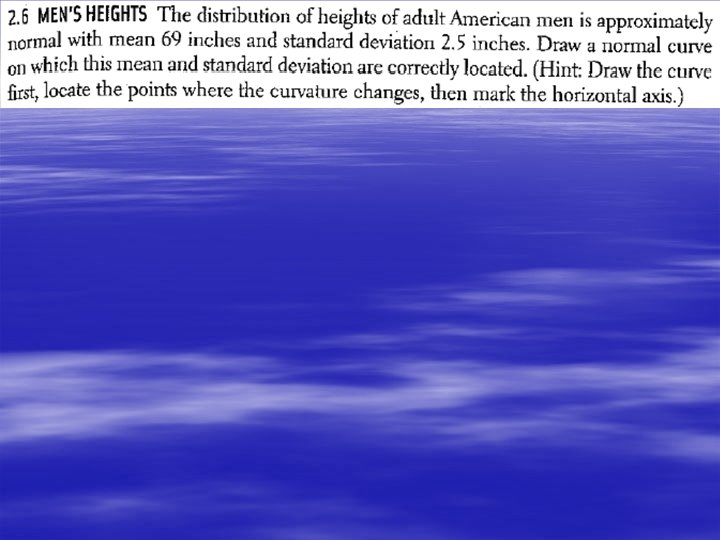
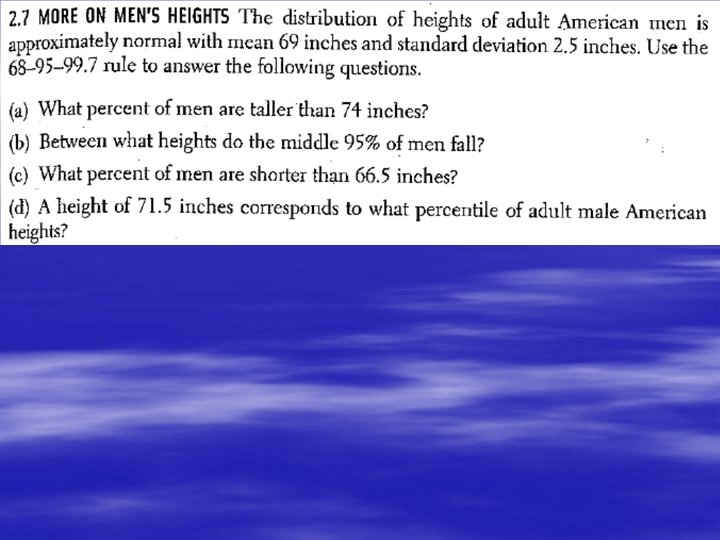
The “NORMAL” Distribution § Normal Distribution

Points of Inflection …. ONE Standard Deviation from the MEAN
- Slides: 19