Chapter 2 7 QC Tools 1 Objectives Understand

Chapter 2 7 QC Tools 1

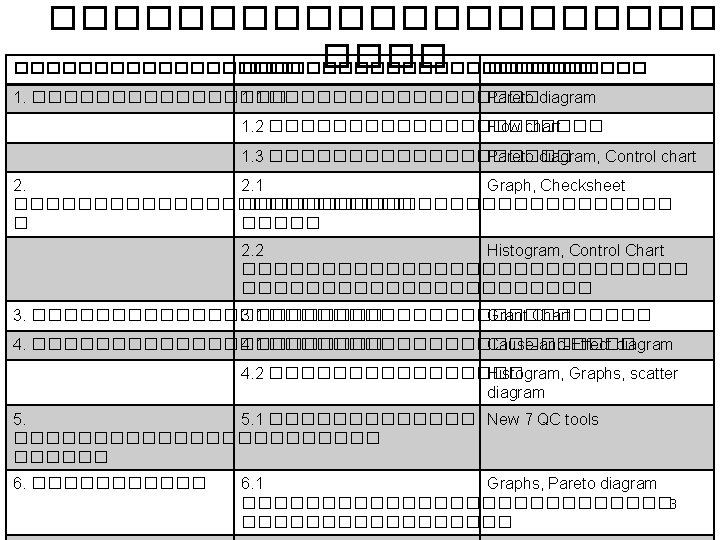
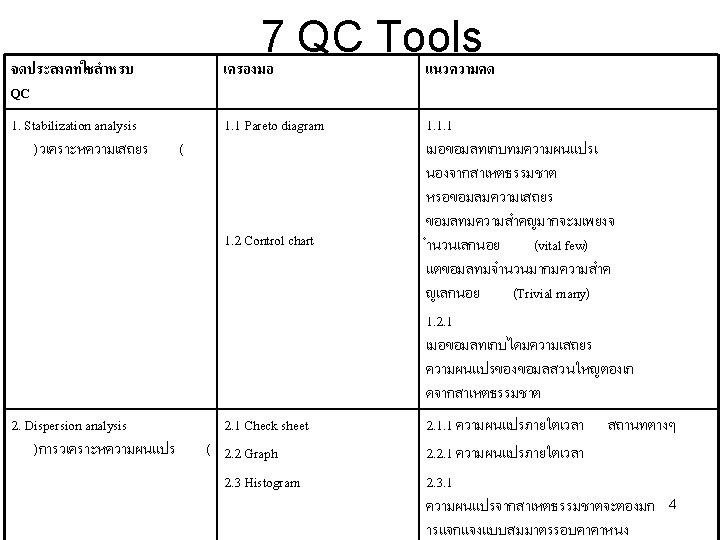
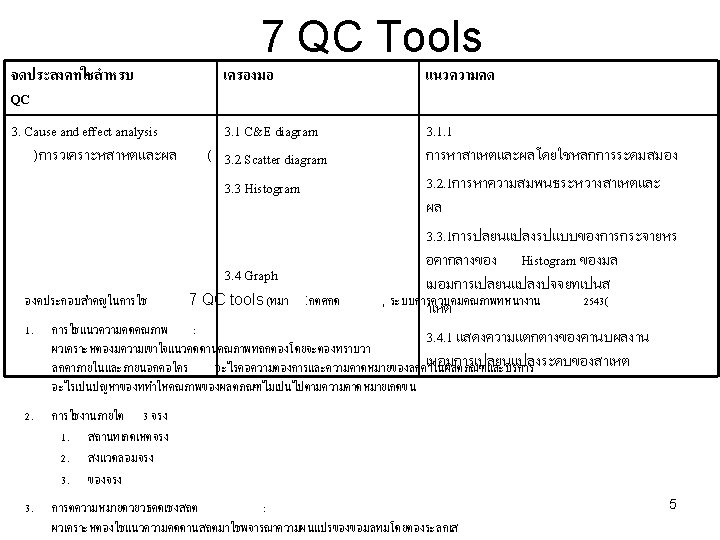
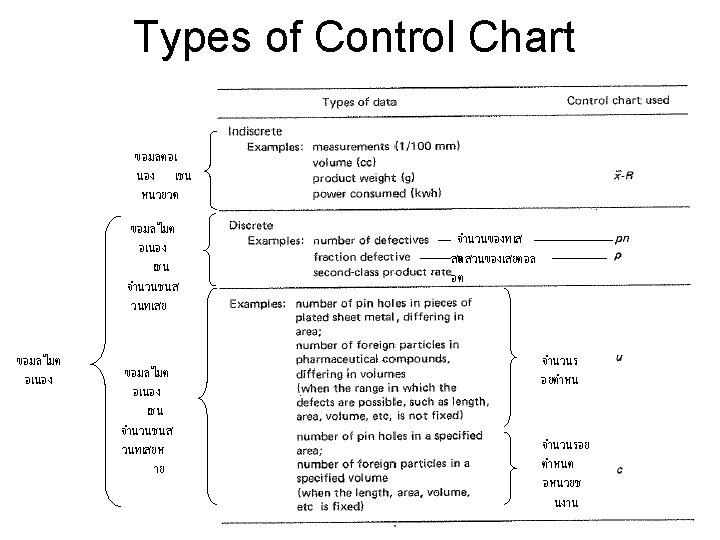
Objectives • Understand the basic concept of 7 QC tools – – – – Pareto diagram Flow chart Check sheet Histogram Cause and Effect diagram Control chart Scatter diagram (Graphs) • Learn how to use 7 QC tools to solve quality problems 2
 Pareto Chart: A graph to identify and plot problems or defects")
Pareto diagram (1) Pareto Chart: A graph to identify and plot problems or defects in descending order of frequency Percent Frequency 20% of items are more important than the rest (80%) A B C D E 6
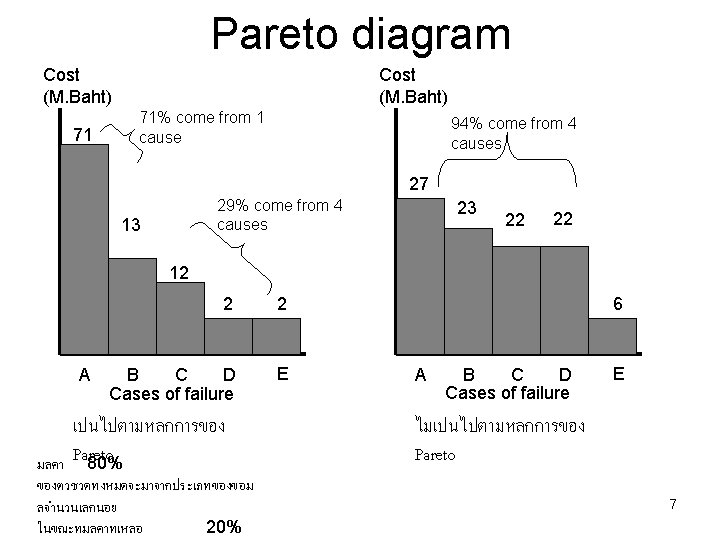

Percent of components Number of defects Pareto diagram 50% reduction Pareto diagram can be used to identify the degree of severity of quality problems. To eliminate defects and improve the operation, this tool can help us to make decision that which problems should be solved first. 8

Pareto diagram Before improvement After improvement 9

Pareto diagram No. of accidents 10
 Statistical Process Control Chart: A chart with time on the horizontal")
Control Chart (2) Statistical Process Control Chart: A chart with time on the horizontal axis to plot values of a statistic Upper control limit Target value Lower control limit Time 11
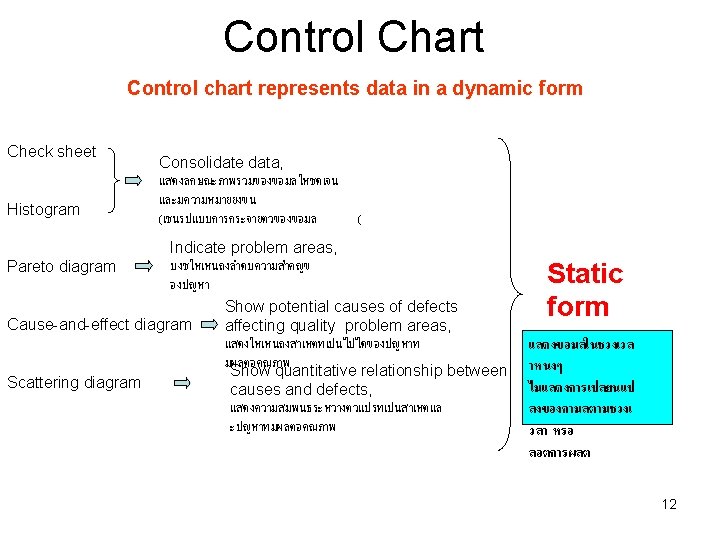

Control Chart day Static form Dynamic form 13

Control Chart 3 3 day Put the limit lines on the graph so that we can see if the data out of control or not! 14
 Check Sheet: An organized method of recording data Defect A B")
Check sheet (3) Check Sheet: An organized method of recording data Defect A B C 1 /// // / 2 / / // 3 / Hour 4 5 / / / 6 / 7 /// // // 8 / //// 16

Check sheets can be used for many purposes, but their most desirable characteristic is that they make it easy to compile data in such a form that they may be used readily and analyzed automatically. )ขอดทสำคญของ Check sheets คอ Check sheets สามารถนำมาใชในการวเคราะหขอมลในเบองตนไดทนทขณะทำการบนทกข อมล ( Function of check sheets (หนาทหลกของ check sheets( 1. Production process distribution checks 2. Defective item checks 3. Defective location checks 4. Defective cause checks 5. Check-up confirmation checks 17

Production process distribution checks An example a frequency distribution form. The disadvantage of this check sheet is that it does not show the change in value over a time period. 18

Defective item checks This check sheet indicates the different kinds of defects in one kind of products 19
 This example check sheet is used to investigated")
Defective location checks (Defect concentration diagram) This example check sheet is used to investigated bubbles in laminated automobile windshield glass. The location and form of bubbles was indicated on the check sheet (the big black and small spot on the right side), and it found that most of the bubbles were on the right side. 20 ## In you opinion, what should be the cause of this defect? ##

Defective cause checks An example of defective cause checks is used to record defectives in bakelite knobs, and the occurrence of defectives is illustrated separately by category: workers, machines, dates and types of defects. The symbols represent: : surface X : blowhole : defective finishing : improper shape : others 21

Check-up confirmation checks This example check sheet is used in an automobile assembly plant. This confirmation check sheet is used in the final phase of assembly or the “tester line” which is for 22 checking and finishing all the work that has already been done.

Check-up confirmation checks An equipment maintenance check sheet. จดประสงคสำหรบ check-up confirmation checks คอนขางจะแตกตางจาก กอนหนาน เนองจาก check sheet 23
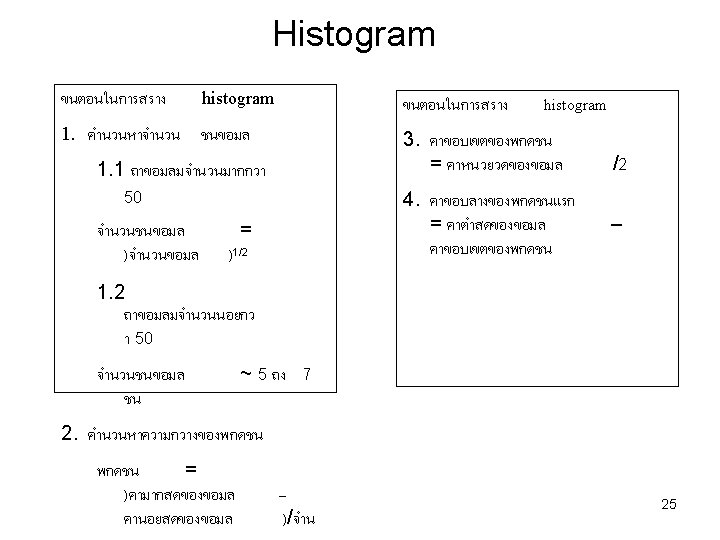
 Histogram: A distribution showing the frequency of occurrences of a variable Frequency")
Histogram (4) Histogram: A distribution showing the frequency of occurrences of a variable Frequency Distribution Repair time (minutes) 24
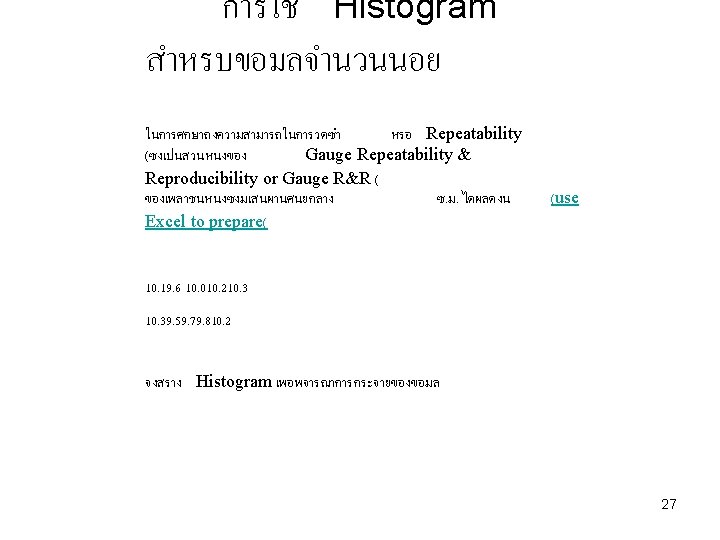
 ของหวบนทกขอมล (Magnetic Recording Head) แสดงไวดงน * (use Excel(")
การใช Histogram สำหรบขอมลจำนวนมาก ขอมลจากการวดความกวางของชองวาง (Gap Width) ของหวบนทกขอมล (Magnetic Recording Head) แสดงไวดงน * (use Excel( 1. 39 1. 40 1. 60 1. 41 1. 43 1. 46 1. 30 1. 50 1. 34 1. 47 1. 56 1. 35 1. 52 1. 51 1. 25 1. 39 1. 55 1. 59 1. 50 1. 66 1. 61 1. 32 1. 46 1. 30 1. 51 1. 52 1. 48 1. 38 1. 40 1. 55 1. 39 1. 33 1. 46 1. 43 1. 35 1. 57 1. 50 1. 20 1. 48 1. 41 1. 65 1. 51 1. 42 1. 60 1. 29 1. 38 1. 46 1. 39 1. 42 1. 46 1. 69 1. 55 1. 46 1. 52 1. 33 1. 52 1. 25 1. 48 1. 60 1. 43 1. 51 1. 35 1. 40 1. 46 1. 57 1. 62 1. 46 1. 51 1. 24 1. 50 1. 56 1. 30 1. 40 1. 55 1. 50 1. 52 1. 43 1. 39 1. 41 1. 38 1. 40 1. 35 1. 48 1. 42 1. 30 1. 38 1. 55 1. 46 1. 58 1. 34 1. 41 1. 29 1. 41 1. 42 1. 43 1. 38 1. 42 1. 60 1. 35 26 * กตต พลอยพานชเจรญ ,

Stem-and-leaf plot Raw data 1. จดลำดบขอมล 2. นยามความหมาย 1. 20 1. 30 1. 24 1. 32 1. 50 1. 61 1. 41 1. 34 1. 66 1. 51 1. 42 1. 52 1. 43 1. 46 1. 47 1. 20 1. 24 1. 30 1. 32 1. 34 1. 41 1. 42 1. 43 1. 46 1. 47 1. 50 1. 51 1. 52 1. 61 1. 66 1. 20 12 l 0 stem = 12 leaf = 0 29

Stem-and-leaf plot Accumulate Freq. 1. 24 1. 30 1. 32 1. 34 stem 1. 20 leaf 1. 41 2 12 0 4 1. 42 5 13 0 2 4 (11) 14 1 2 2 1. 43 5 15 0 1 2 1. 46 2 16 1 6 1. 42 3. สรางแผนภาพ 3 6 7 1. 47 1. 50 1. 51 1. 52 1. 61 1. 66 30

Stem-and-leaf plot Answer Introduction to Statistical Quality Control, 6 th Edition by Douglas C. Montgomery. Copyright (c) 2009 John Wiley & Sons, Inc. 31
 Materials Quality characteristic Equipment (Machine) Inspection (Measurement) cause )สงทสงผลกระ")
Cause-and-effect diagram Work methods (Men/Methods) Materials Quality characteristic Equipment (Machine) Inspection (Measurement) cause )สงทสงผลกระ ทบตอคณภาพ และเปนสงทตองการ ปรบปรง ( effect 32

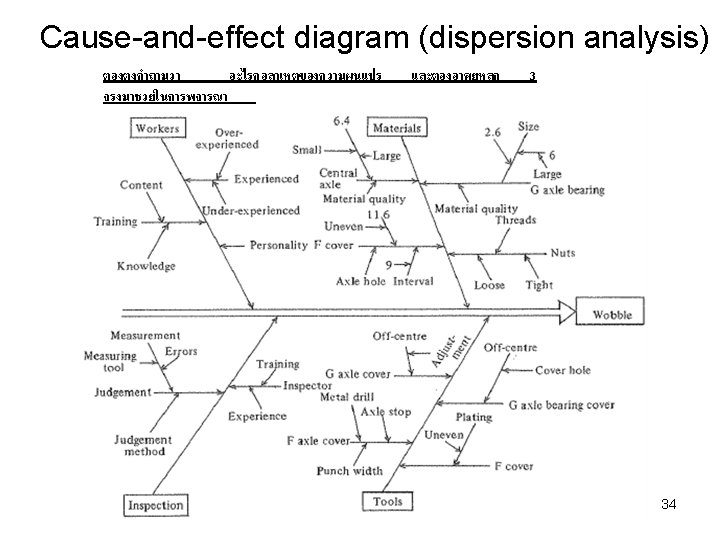
Cause-and-effect diagram 2. 6 Worker Size Materials G axle bearing Wobble Inspection Tools 33
 35")
Cause-and-effect diagram (process classification) 35
 Cause-and-effect diagram shows that how scarring occurs during steel tubing")
Cause-and-effect diagram (process classification) Cause-and-effect diagram shows that how scarring occurs during steel tubing process. 36

Good and poor cause-and-effect diagram A B 37

Cause-and-effect diagram Case study: Find the possible causes of late attending in QC class and suggest the solution of this problems by using cause-and-effect diagram. 38
 Scatter Diagram: A graph of the value of one variable")
Scattering diagram Productivity (b) Scatter Diagram: A graph of the value of one variable vs. another variable Absenteeism 39
 and the severed length")
Scattering diagram The result of investigating the conveyer speed (cause) and the severed length (effect) as shown above 40

Scattering diagram 41

Scattering diagram B A D C E Matching game 42
- Slides: 42