Chapter 2 4 Equations of Lines Curve Fitting


")
 be any other point on the line. Since the line is")

 Write an")
 Find an equation of the")


 Find an")
 Use the equation from part (a) to approximate the cost of tuition and")


 Use the points (1955,")
 Use the equation to")
- Slides: 37
Chapter 2. 4 Equations of Lines; Curve Fitting
Point-Slope Form In the previous section we saw that the graph of a linear functions is a straight line. In this section we develop various forms for the equation of a line.
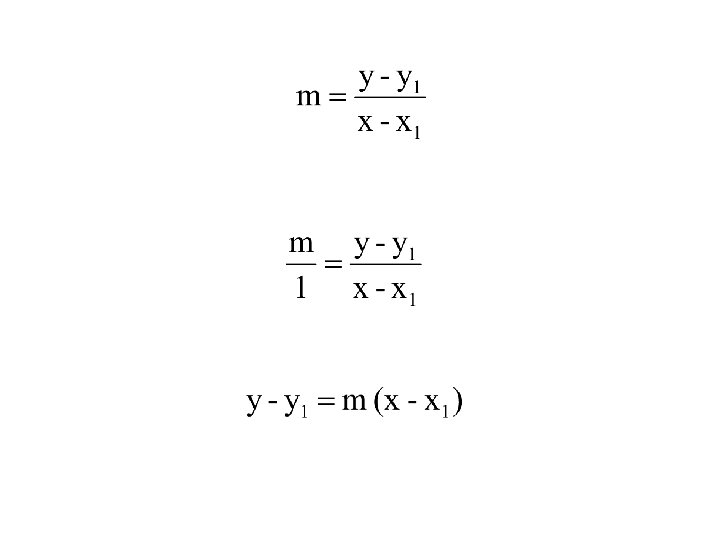
Fugure 40 shows the line passing through the fixed point (x 1, y 1) having slope m.
Let (x, y) be any other point on the line. Since the line is not vertical, x – x 1 ≠ 0.
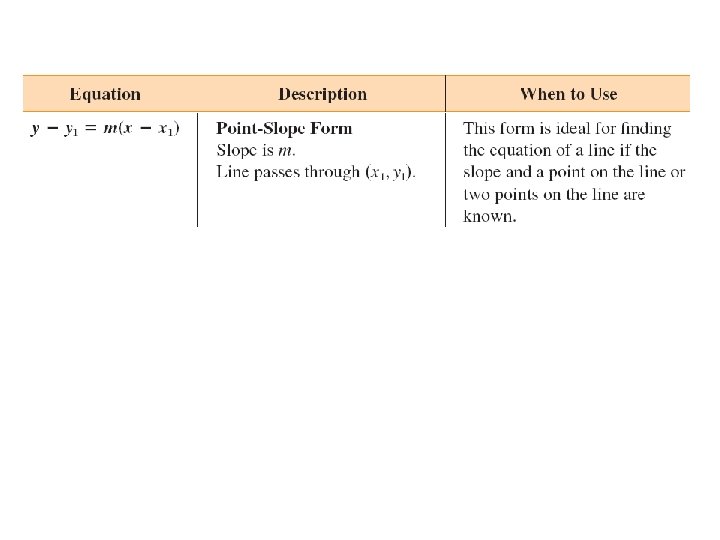
The result is the point-slope form of the equation of a line.
Example 1 Using the Point-Slope Form (Given a Point and the Slope) Write an equation of the line through (-4, 1) having a slope -3
Example 2 Using the Point-Slope Form (Given Two Points) Find an equation of the line through (-3, 2) and (2, -4)
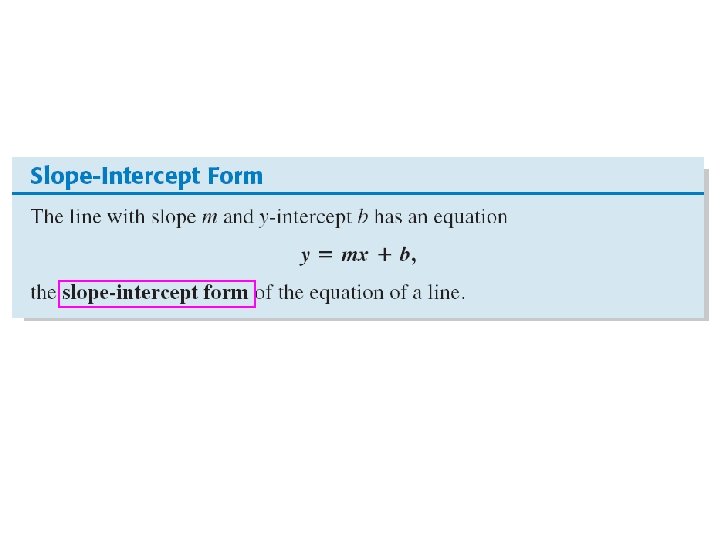
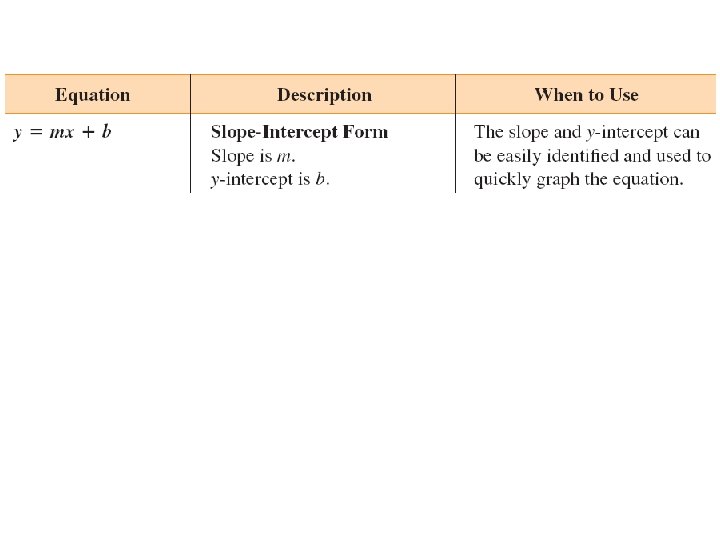
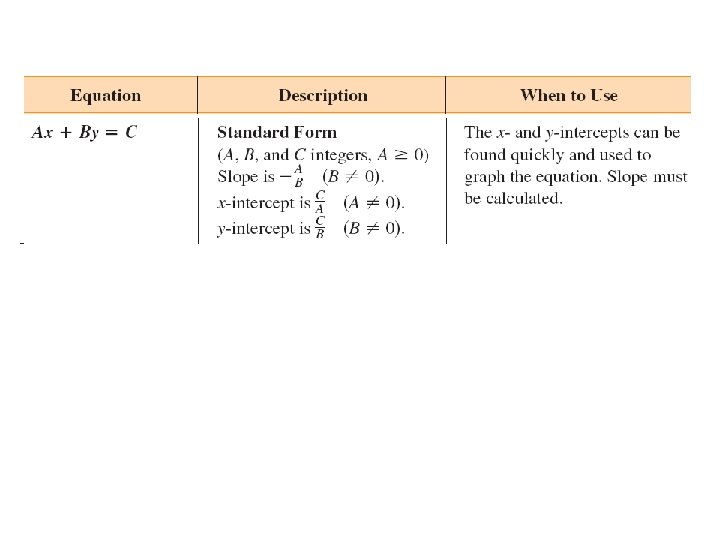
Since this result show the slope of the line and the y-intercept, it is called the slope-intercept form of the equation of the line.
Example 3 Using the Slope-Intercept Form to Find an Equation of a Line Find an equation of the line with slope -4/5 and yintercept -2.
Example 4 Using the Slope-Intercept Form to Graph a Line Find the slope and y-intercept of 3 x – y = 2. Then graph the line
y Example 4 Using the Slope-Intercept Form to Graph a Line Graph 3 x – y = 2 x
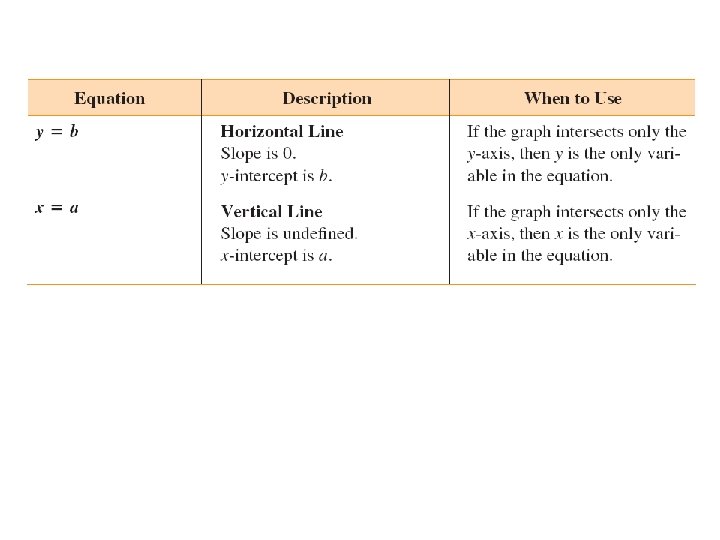
Vertical and Horizontal Lines
Parallel and Perpendicular Lines
Parallel and Perpendicular Lines
Parallel and Perpendicular Lines
y Example 5 Finding Equations of Parallel and Perpendicular Lines Graph 2 x + 5 y = -4 x
y Example 5 Finding Equations of Parallel and Perpendicular Lines Graph 2 x + 5 y = -4 x
y Example 5 Finding Equations of Parallel and Perpendicular Lines Graph 2 x + 5 y = -4 Graph (3, 5) x
Example 5 Finding Equations of Parallel and Perpendicular Lines Find the equation in slope-intercept form of the line that passes through the point (3, 5) and satisfies the given condition. (a) parallel to the line 2 x + 5 y = 4
Example 5 Finding Equations of Parallel and Perpendicular Lines Find the equation in slope-intercept form of the line that passes through the point (3, 5) and satisfies the given condition. (b) perpendicular to the line 2 x + 5 y = 4
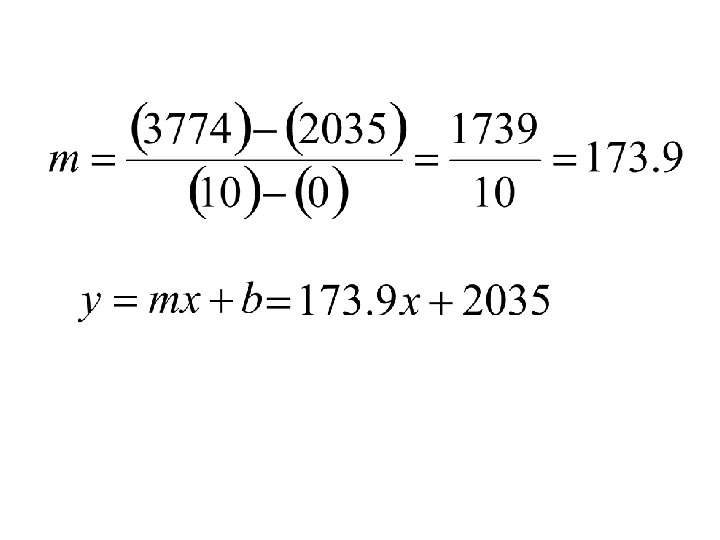
Example 6 Finding an Equation of a Line That Models Data Average annual tuition and fees for in-state students at public 4 -year colleges are shown in the table for selected years and graphed as ordered pairs of points in Figure 46, where x = 0 represents 1990, x = 4 represents 1994, and so on, and y represents the cost in dollars.
Example 6 Finding an Equation of a Line That Models Data This graph of ordered pairs of data is called a scatter diagram.
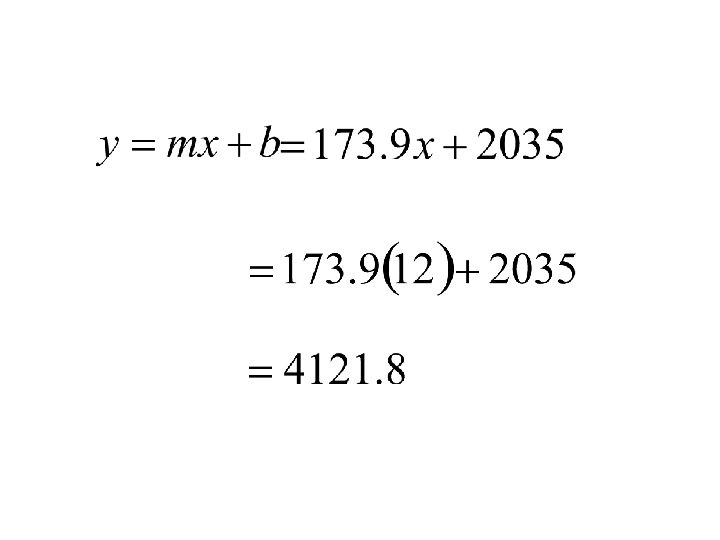
Example 6 Finding an Equation of a Line That Models Data (a) Find an equation that models the data.
(b) Use the equation from part (a) to approximate the cost of tuition and fees at public 4 -year colleges in 1992
Example 7 Finding a Linear Equation That Models Data The table below and graph in Figure 47 on the next page illustrate how the percent of women in the civilian labor force has changed from 1955 to 2000.
Example 7 Finding a Linear Equation That Models Data The table below and graph in Figure 47 on the next page illustrate how the percent of women in the civilian labor force has changed from 1955 to 2000.
Example 7 Finding a Linear Equation That Models Data (a) Use the points (1955, 35. 7) and (1995, 58. 9) to find a linear equation that models the data.
Example 7 Finding a Linear Equation That Models Data (b) Use the equation to estimate the percent for 2000. How does the result compare to the actual figure of 60. 0%?