
Chapter 18 Introduction to Managerial Accounting Demonstration Problems
Chapter 18 Introduction to Managerial Accounting Demonstration Problems © 2016 Pearson Education, Inc. 18 -1
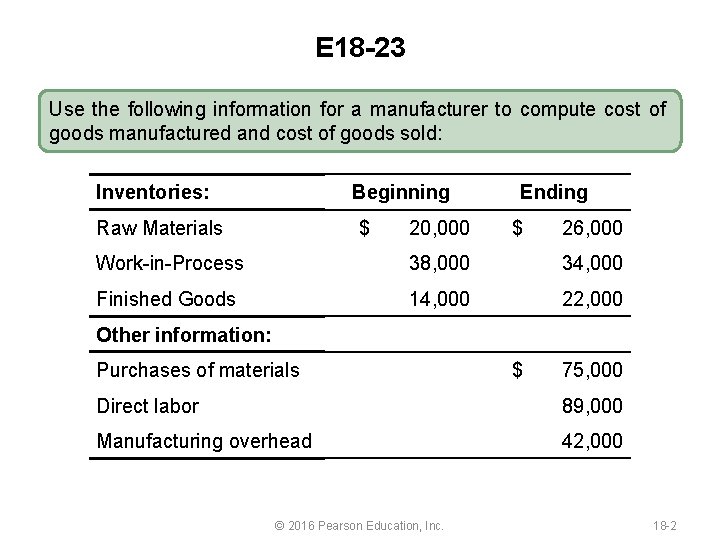
E 18 -23 Use the following information for a manufacturer to compute cost of goods manufactured and cost of goods sold: Inventories: Beginning Raw Materials $ 20, 000 Ending $ 26, 000 Work-in-Process 38, 000 34, 000 Finished Goods 14, 000 22, 000 Other information: Purchases of materials $ 75, 000 Direct labor 89, 000 Manufacturing overhead 42, 000 © 2016 Pearson Education, Inc. 18 -2
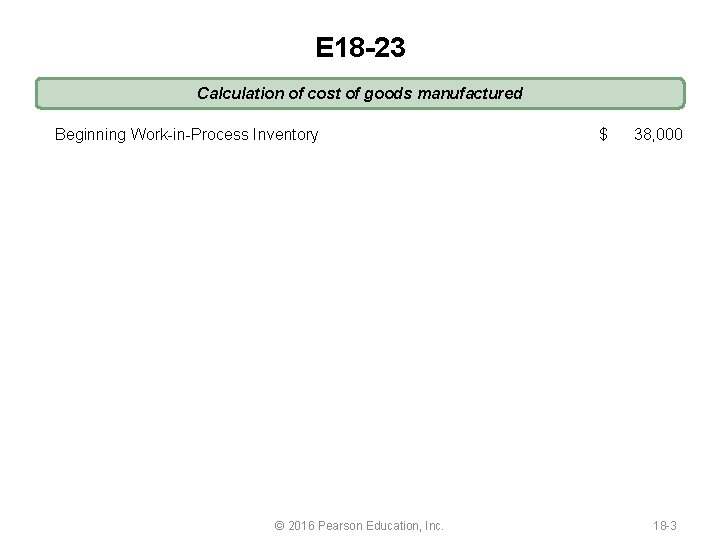
E 18 -23 Calculation of cost of goods manufactured Beginning Work-in-Process Inventory © 2016 Pearson Education, Inc. $ 38, 000 18 -3
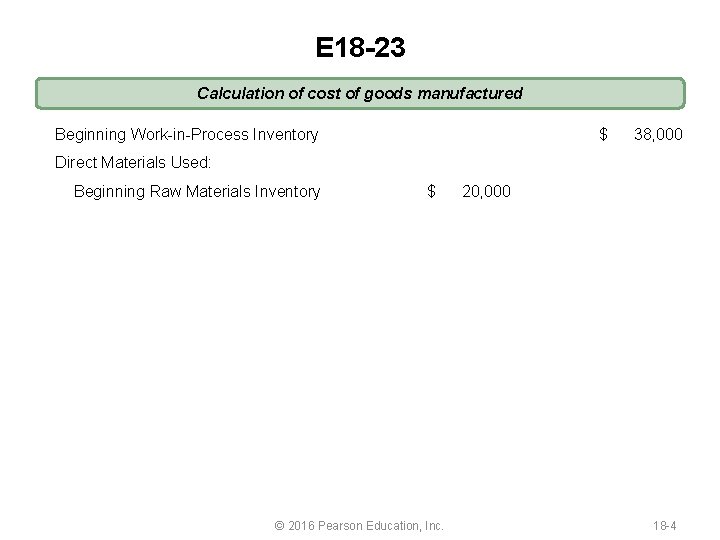
E 18 -23 Calculation of cost of goods manufactured Beginning Work-in-Process Inventory $ Direct Materials Used: $ 20, 000 Beginning Raw Materials Inventory © 2016 Pearson Education, Inc. 38, 000 18 -4
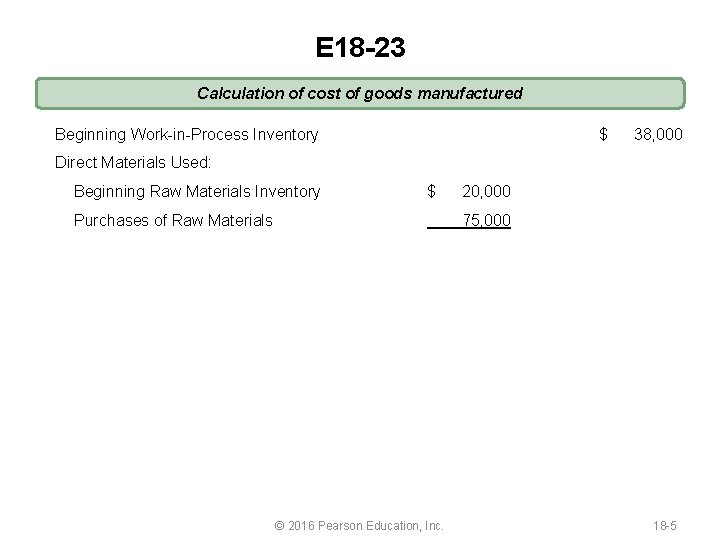
E 18 -23 Calculation of cost of goods manufactured Beginning Work-in-Process Inventory $ Direct Materials Used: $ 20, 000 75, 000 Beginning Raw Materials Inventory Purchases of Raw Materials © 2016 Pearson Education, Inc. 38, 000 18 -5
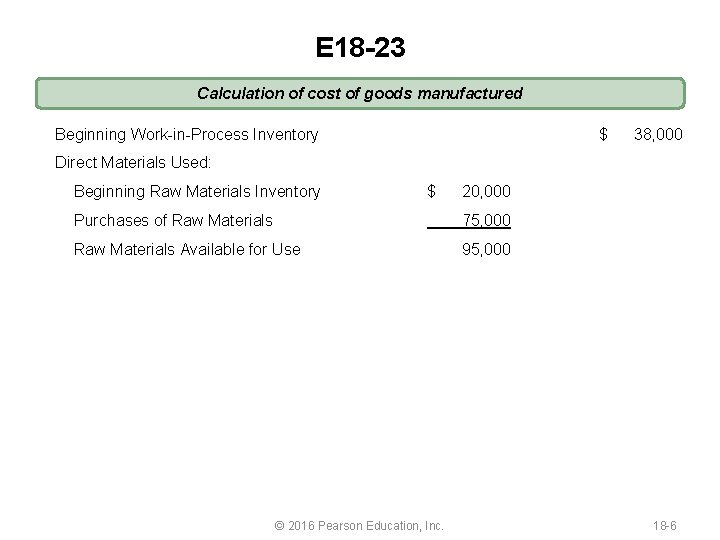
E 18 -23 Calculation of cost of goods manufactured Beginning Work-in-Process Inventory $ Direct Materials Used: $ 20, 000 Purchases of Raw Materials 75, 000 Raw Materials Available for Use 95, 000 Beginning Raw Materials Inventory © 2016 Pearson Education, Inc. 38, 000 18 -6
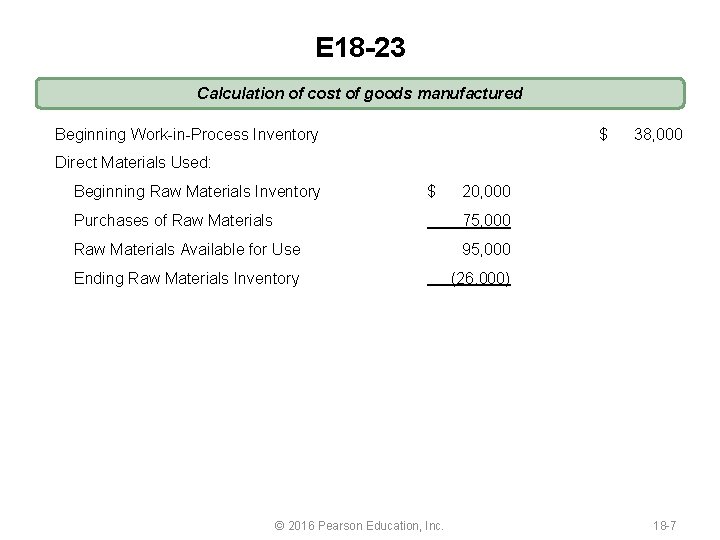
E 18 -23 Calculation of cost of goods manufactured Beginning Work-in-Process Inventory $ Direct Materials Used: $ 20, 000 Purchases of Raw Materials 75, 000 Raw Materials Available for Use 95, 000 Ending Raw Materials Inventory (26, 000) Beginning Raw Materials Inventory © 2016 Pearson Education, Inc. 38, 000 18 -7
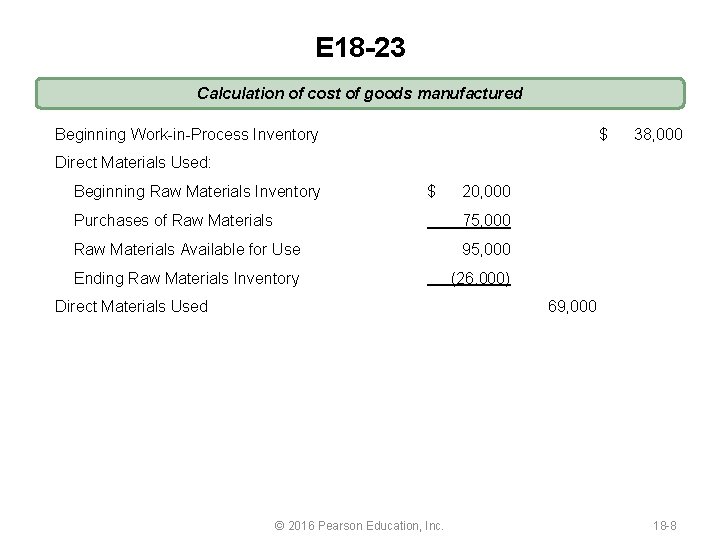
E 18 -23 Calculation of cost of goods manufactured Beginning Work-in-Process Inventory $ Direct Materials Used: $ 20, 000 Purchases of Raw Materials 75, 000 Raw Materials Available for Use 95, 000 Ending Raw Materials Inventory (26, 000) Beginning Raw Materials Inventory Direct Materials Used © 2016 Pearson Education, Inc. 38, 000 69, 000 18 -8
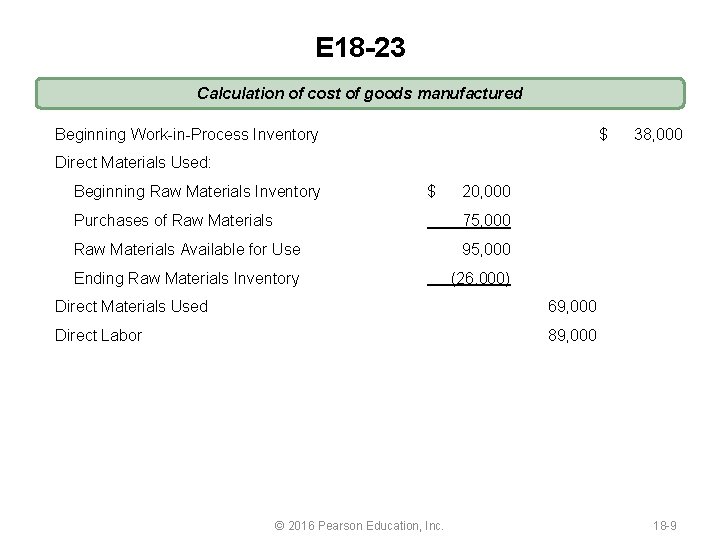
E 18 -23 Calculation of cost of goods manufactured Beginning Work-in-Process Inventory $ Direct Materials Used: $ 20, 000 Purchases of Raw Materials 75, 000 Raw Materials Available for Use 95, 000 Ending Raw Materials Inventory (26, 000) Beginning Raw Materials Inventory Direct Materials Used 69, 000 Direct Labor 89, 000 © 2016 Pearson Education, Inc. 38, 000 18 -9
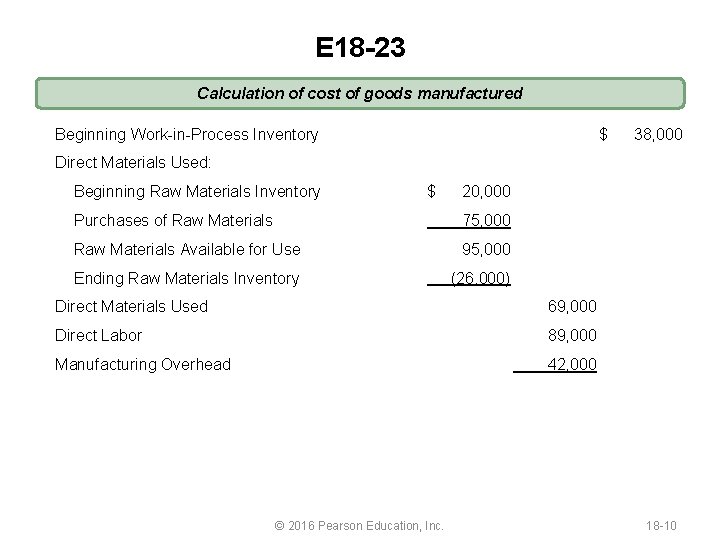
E 18 -23 Calculation of cost of goods manufactured Beginning Work-in-Process Inventory $ Direct Materials Used: $ 20, 000 Purchases of Raw Materials 75, 000 Raw Materials Available for Use 95, 000 Ending Raw Materials Inventory (26, 000) Beginning Raw Materials Inventory Direct Materials Used 69, 000 Direct Labor 89, 000 Manufacturing Overhead 42, 000 © 2016 Pearson Education, Inc. 38, 000 18 -10
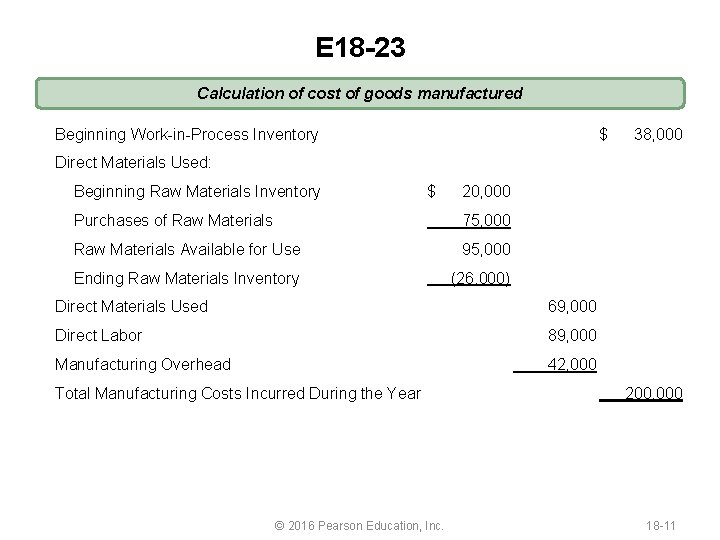
E 18 -23 Calculation of cost of goods manufactured Beginning Work-in-Process Inventory $ Direct Materials Used: $ 20, 000 Purchases of Raw Materials 75, 000 Raw Materials Available for Use 95, 000 Ending Raw Materials Inventory (26, 000) Beginning Raw Materials Inventory Direct Materials Used 69, 000 Direct Labor 89, 000 Manufacturing Overhead 42, 000 Total Manufacturing Costs Incurred During the Year © 2016 Pearson Education, Inc. 38, 000 200, 000 18 -11
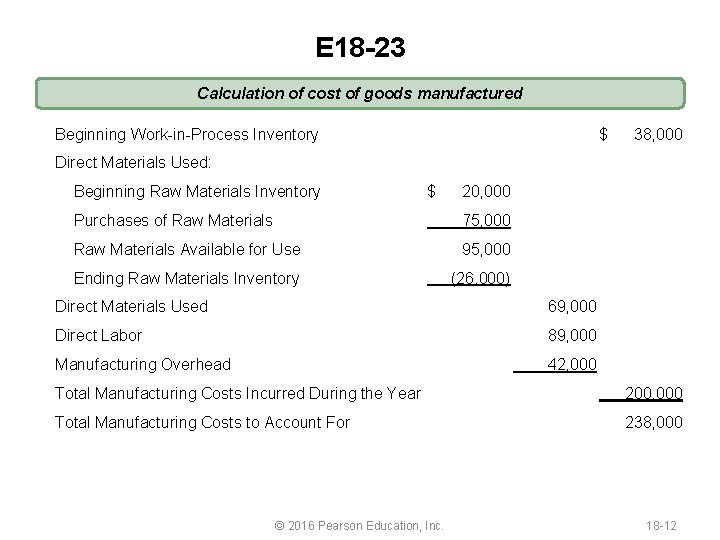
E 18 -23 Calculation of cost of goods manufactured Beginning Work-in-Process Inventory $ Direct Materials Used: $ 20, 000 Purchases of Raw Materials 75, 000 Raw Materials Available for Use 95, 000 Ending Raw Materials Inventory (26, 000) Beginning Raw Materials Inventory Direct Materials Used 69, 000 Direct Labor 89, 000 Manufacturing Overhead 42, 000 38, 000 Total Manufacturing Costs Incurred During the Year 200, 000 Total Manufacturing Costs to Account For 238, 000 © 2016 Pearson Education, Inc. 18 -12
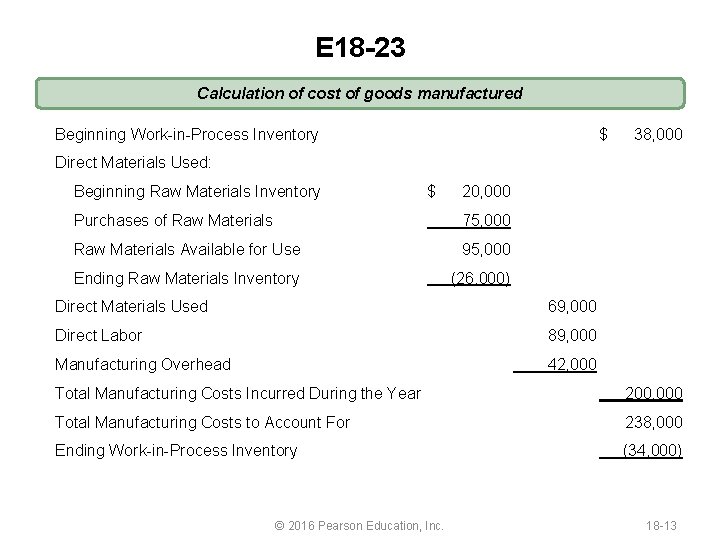
E 18 -23 Calculation of cost of goods manufactured Beginning Work-in-Process Inventory $ Direct Materials Used: $ 20, 000 Purchases of Raw Materials 75, 000 Raw Materials Available for Use 95, 000 Ending Raw Materials Inventory (26, 000) Beginning Raw Materials Inventory Direct Materials Used 69, 000 Direct Labor 89, 000 Manufacturing Overhead 42, 000 38, 000 Total Manufacturing Costs Incurred During the Year 200, 000 Total Manufacturing Costs to Account For 238, 000 Ending Work-in-Process Inventory (34, 000) © 2016 Pearson Education, Inc. 18 -13
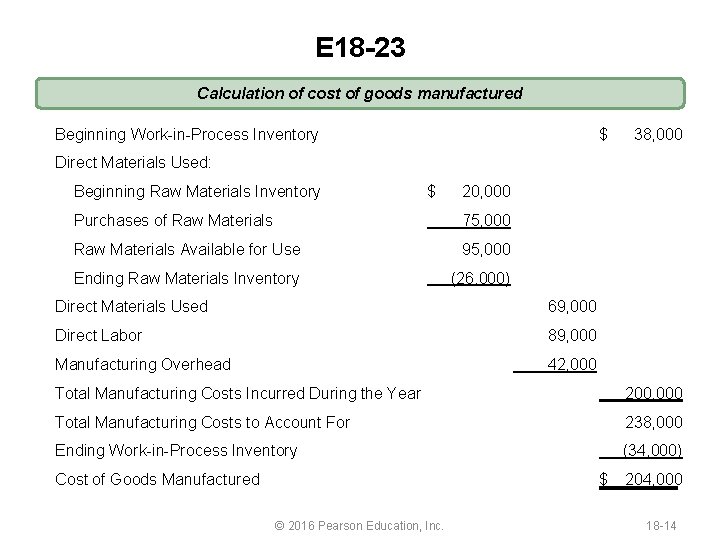
E 18 -23 Calculation of cost of goods manufactured Beginning Work-in-Process Inventory $ Direct Materials Used: $ 20, 000 Purchases of Raw Materials 75, 000 Raw Materials Available for Use 95, 000 Ending Raw Materials Inventory (26, 000) Beginning Raw Materials Inventory Direct Materials Used 69, 000 Direct Labor 89, 000 Manufacturing Overhead 42, 000 38, 000 Total Manufacturing Costs Incurred During the Year 200, 000 Total Manufacturing Costs to Account For 238, 000 Ending Work-in-Process Inventory (34, 000) Cost of Goods Manufactured © 2016 Pearson Education, Inc. $ 204, 000 18 -14
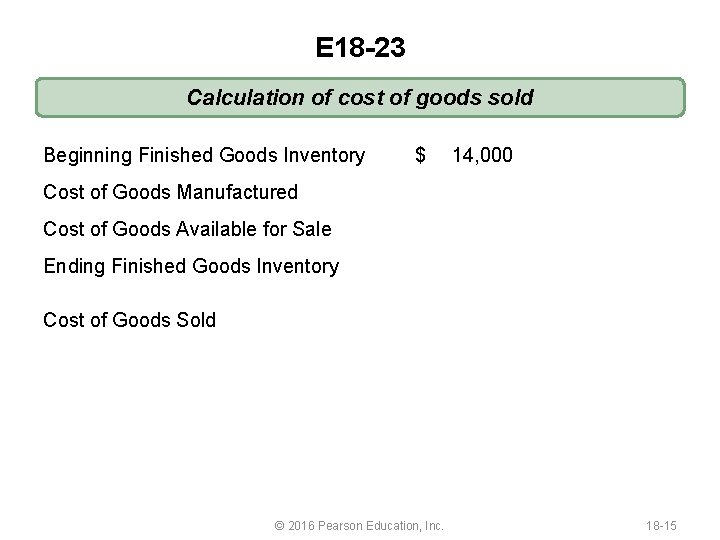
E 18 -23 Calculation of cost of goods sold Beginning Finished Goods Inventory $ 14, 000 Cost of Goods Manufactured Cost of Goods Available for Sale Ending Finished Goods Inventory Cost of Goods Sold © 2016 Pearson Education, Inc. 18 -15
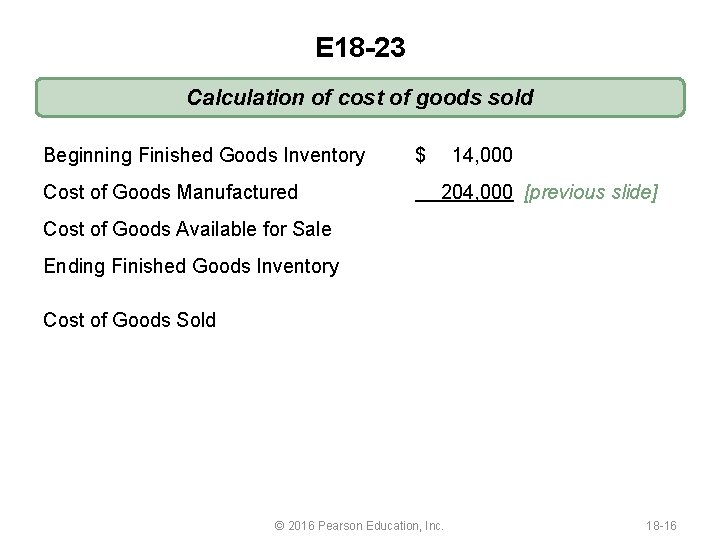
E 18 -23 Calculation of cost of goods sold Beginning Finished Goods Inventory Cost of Goods Manufactured $ 14, 000 204, 000 [previous slide] Cost of Goods Available for Sale Ending Finished Goods Inventory Cost of Goods Sold © 2016 Pearson Education, Inc. 18 -16
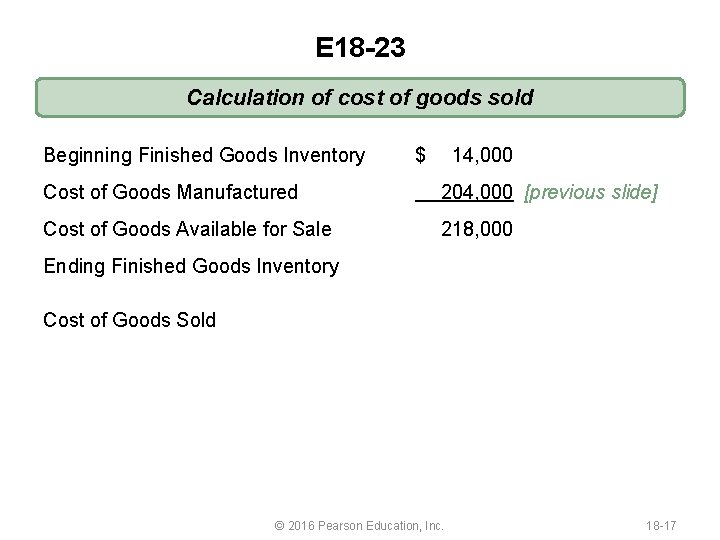
E 18 -23 Calculation of cost of goods sold Beginning Finished Goods Inventory $ 14, 000 Cost of Goods Manufactured 204, 000 [previous slide] Cost of Goods Available for Sale 218, 000 Ending Finished Goods Inventory Cost of Goods Sold © 2016 Pearson Education, Inc. 18 -17

E 18 -23 Calculation of cost of goods sold Beginning Finished Goods Inventory $ 14, 000 Cost of Goods Manufactured 204, 000 [previous slide] Cost of Goods Available for Sale 218, 000 Ending Finished Goods Inventory (22, 000) Cost of Goods Sold © 2016 Pearson Education, Inc. 18 -18
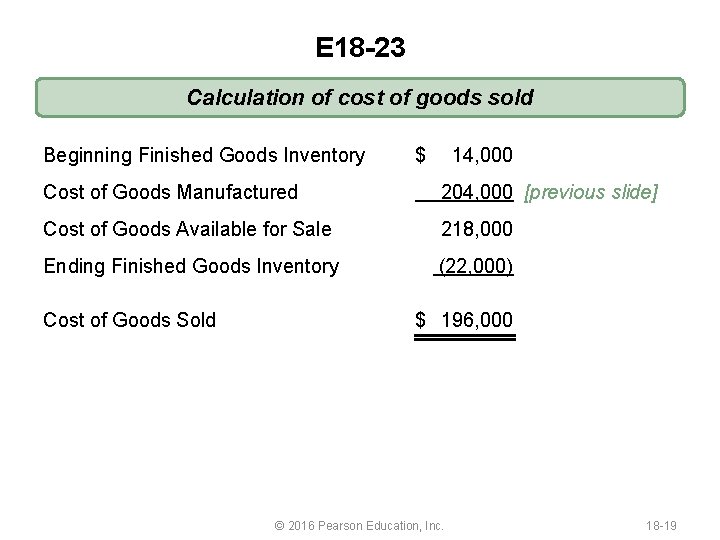
E 18 -23 Calculation of cost of goods sold Beginning Finished Goods Inventory $ 14, 000 Cost of Goods Manufactured 204, 000 [previous slide] Cost of Goods Available for Sale 218, 000 Ending Finished Goods Inventory (22, 000) Cost of Goods Sold $ 196, 000 © 2016 Pearson Education, Inc. 18 -19
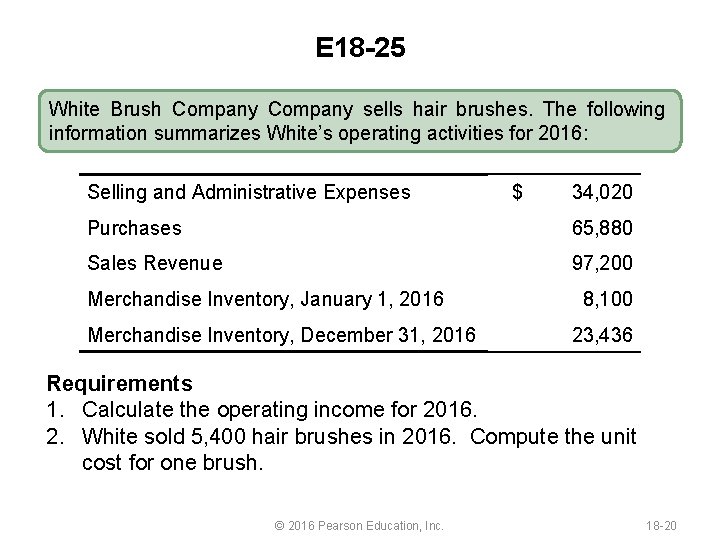
E 18 -25 White Brush Company sells hair brushes. The following information summarizes White’s operating activities for 2016: Selling and Administrative Expenses $ 34, 020 Purchases 65, 880 Sales Revenue 97, 200 Merchandise Inventory, January 1, 2016 Merchandise Inventory, December 31, 2016 8, 100 23, 436 Requirements 1. Calculate the operating income for 2016. 2. White sold 5, 400 hair brushes in 2016. Compute the unit cost for one brush. © 2016 Pearson Education, Inc. 18 -20
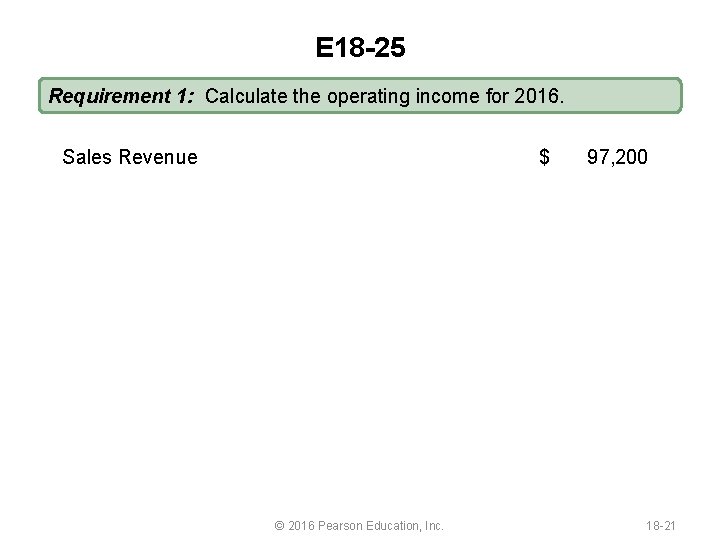
E 18 -25 Requirement 1: Calculate the operating income for 2016. Sales Revenue $ 97, 200 © 2016 Pearson Education, Inc. 18 -21
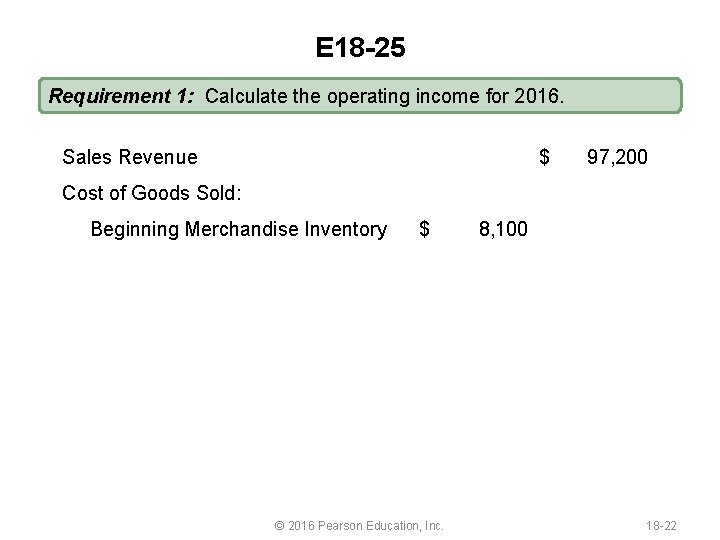
E 18 -25 Requirement 1: Calculate the operating income for 2016. Sales Revenue $ Cost of Goods Sold: Beginning Merchandise Inventory $ 8, 100 97, 200 © 2016 Pearson Education, Inc. 18 -22
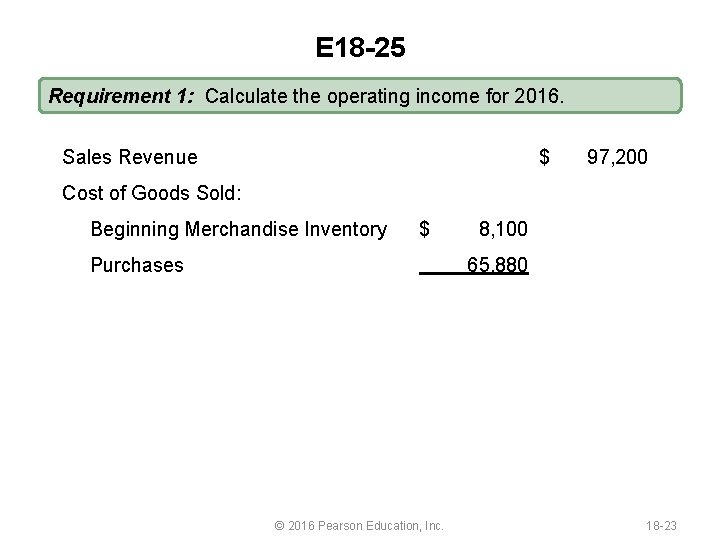
E 18 -25 Requirement 1: Calculate the operating income for 2016. Sales Revenue $ Cost of Goods Sold: Beginning Merchandise Inventory $ 8, 100 Purchases 65, 880 97, 200 © 2016 Pearson Education, Inc. 18 -23
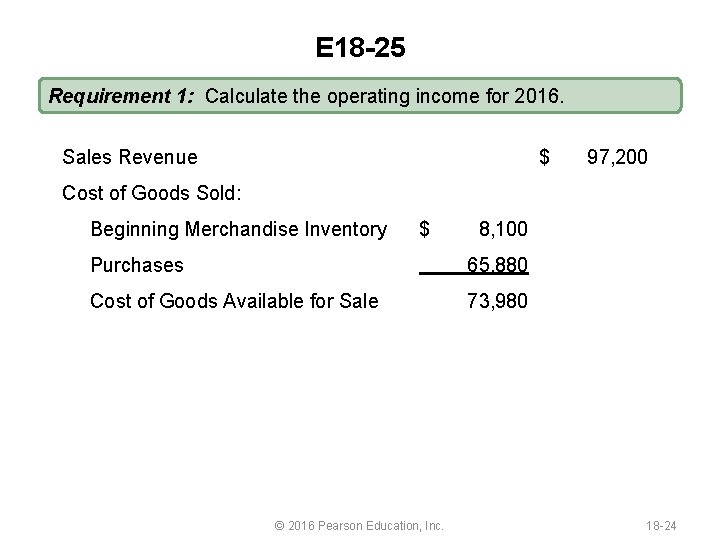
E 18 -25 Requirement 1: Calculate the operating income for 2016. Sales Revenue $ Cost of Goods Sold: Beginning Merchandise Inventory $ 8, 100 Purchases 65, 880 Cost of Goods Available for Sale 73, 980 97, 200 © 2016 Pearson Education, Inc. 18 -24
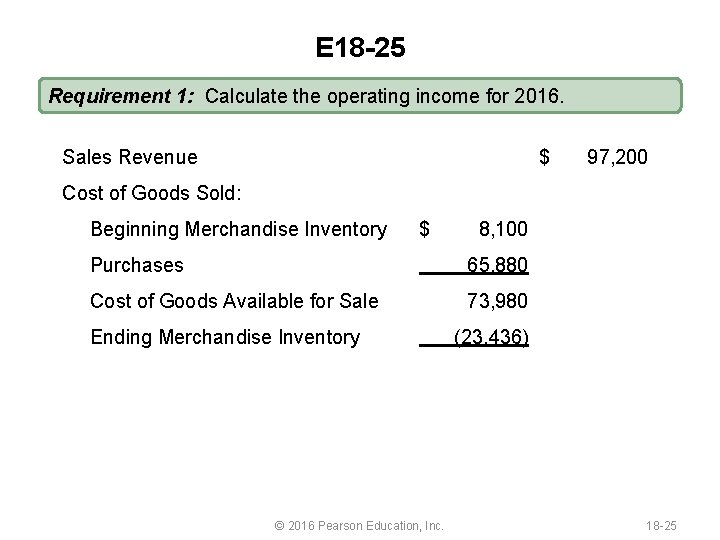
E 18 -25 Requirement 1: Calculate the operating income for 2016. Sales Revenue $ Cost of Goods Sold: Beginning Merchandise Inventory $ 8, 100 Purchases 65, 880 Cost of Goods Available for Sale 73, 980 Ending Merchandise Inventory 97, 200 (23, 436) © 2016 Pearson Education, Inc. 18 -25
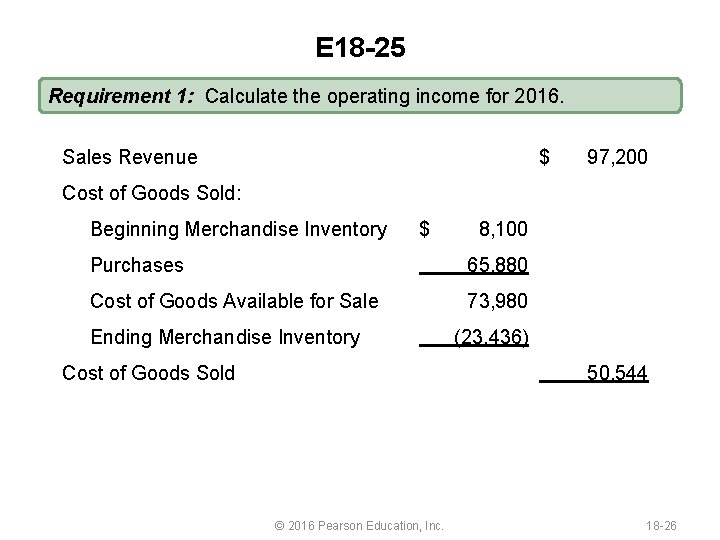
E 18 -25 Requirement 1: Calculate the operating income for 2016. Sales Revenue $ Cost of Goods Sold: Beginning Merchandise Inventory $ 8, 100 Purchases 65, 880 Cost of Goods Available for Sale 73, 980 Ending Merchandise Inventory Cost of Goods Sold 97, 200 (23, 436) 50, 544 © 2016 Pearson Education, Inc. 18 -26
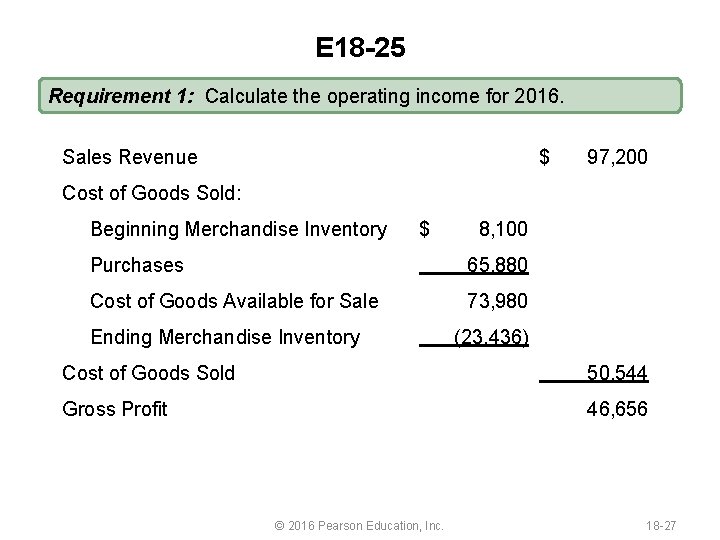
E 18 -25 Requirement 1: Calculate the operating income for 2016. Sales Revenue $ Cost of Goods Sold: Beginning Merchandise Inventory $ 8, 100 Purchases 65, 880 Cost of Goods Available for Sale 73, 980 Ending Merchandise Inventory 97, 200 (23, 436) Cost of Goods Sold Gross Profit 50, 544 46, 656 © 2016 Pearson Education, Inc. 18 -27
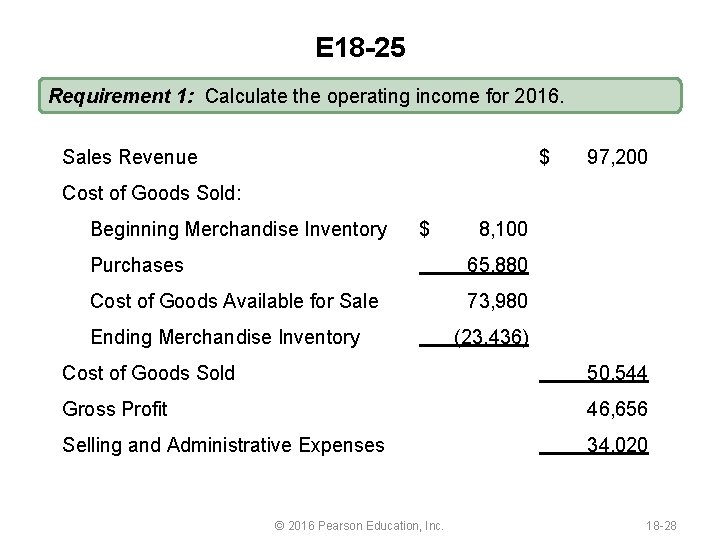
E 18 -25 Requirement 1: Calculate the operating income for 2016. Sales Revenue $ Cost of Goods Sold: Beginning Merchandise Inventory $ 8, 100 Purchases 65, 880 Cost of Goods Available for Sale 73, 980 Ending Merchandise Inventory 97, 200 (23, 436) Cost of Goods Sold Gross Profit Selling and Administrative Expenses 50, 544 46, 656 34, 020 © 2016 Pearson Education, Inc. 18 -28
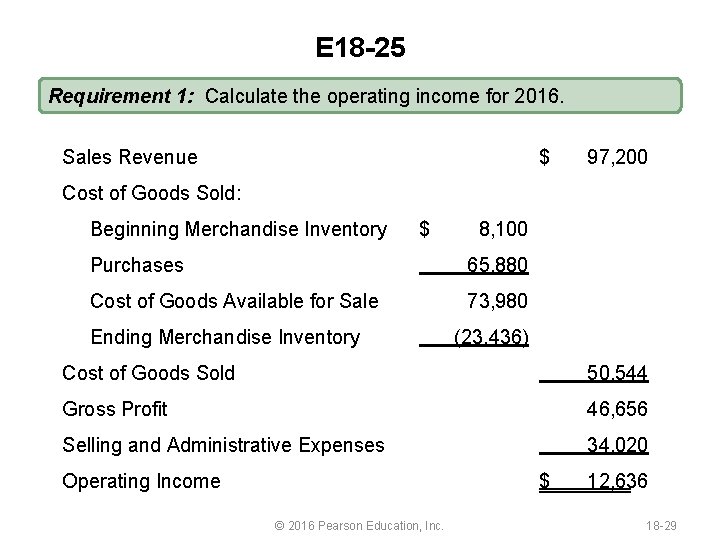
E 18 -25 Requirement 1: Calculate the operating income for 2016. Sales Revenue $ Cost of Goods Sold: Beginning Merchandise Inventory $ 8, 100 Purchases 65, 880 Cost of Goods Available for Sale 73, 980 Ending Merchandise Inventory 97, 200 (23, 436) Cost of Goods Sold Gross Profit Selling and Administrative Expenses Operating Income © 2016 Pearson Education, Inc. 50, 544 46, 656 34, 020 $ 12, 636 18 -29
E 18 -25 Requirement 2: White sold 5, 400 hair brushes in 2016. Compute the unit cost for one brush. Unit cost of one brush = © 2016 Pearson Education, Inc. 18 -30

E 18 -25 Requirement 2: White sold 5, 400 hair brushes in 2016. Compute the unit cost for one brush. Unit cost of one brush Cost of goods sold Total units sold = © 2016 Pearson Education, Inc. 18 -31
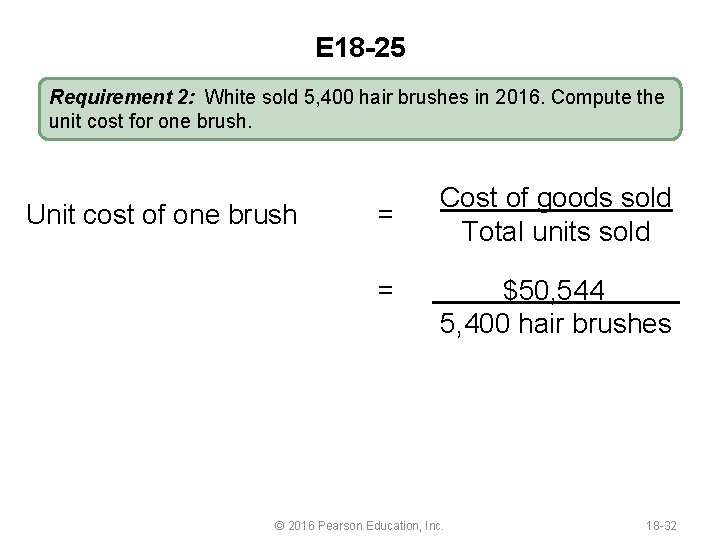
E 18 -25 Requirement 2: White sold 5, 400 hair brushes in 2016. Compute the unit cost for one brush. Unit cost of one brush = = Cost of goods sold Total units sold $50, 544 5, 400 hair brushes © 2016 Pearson Education, Inc. 18 -32
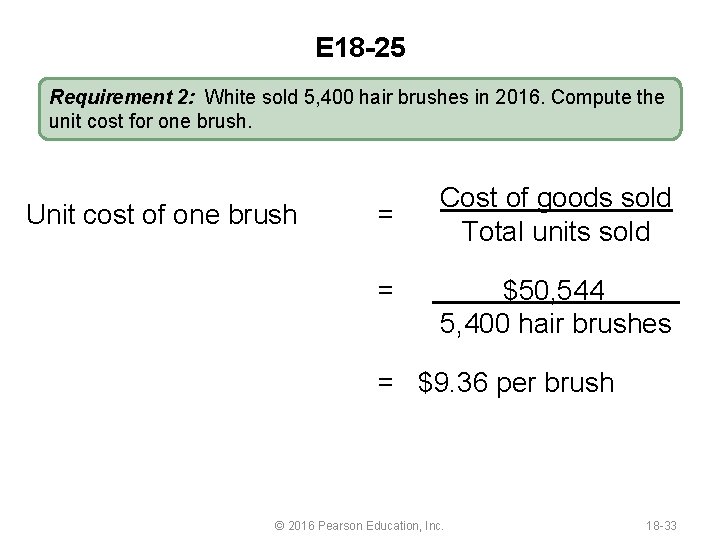
E 18 -25 Requirement 2: White sold 5, 400 hair brushes in 2016. Compute the unit cost for one brush. Unit cost of one brush = = Cost of goods sold Total units sold $50, 544 5, 400 hair brushes = $9. 36 per brush © 2016 Pearson Education, Inc. 18 -33
End of Chapter 18 © 2016 Pearson Education, Inc. 18 -34
- Slides: 34