Chapter 16 Section 4 Weather Weather Maps and


,")


 From the NWS website you can view any kind of")
 www. noaa. gov n NOAA collects and analyzes")

- Slides: 22
Chapter 16 Section 4 Weather, Weather Maps and Forecasting
A. Weather ► 1. Weather: The daily conditions of a particular area: temp, rain, pressure, wind, etc. ► 2. Climate- average conditions of an area over time. ► 3. Weather Forecast- A prediction about future weather conditions based on weather data. ► 4. Meteorologist: A scientist who studies the weather and brings us the weather forecast, like you see on the news. They use information they gather from many sources to predict the weather. ► 5. Meteorology- the science of studying weather
B. Weather Forecasting Technology • 1. Weather Balloon: Carry electronic equipment that can measure weather conditions as high as 30 km above the Earth’s surface. They measure temperature, air pressure and relative humidity. They can also measure wind speed and direction. • 2. Thermometer: Measures temperature • 3. Barometer: Measures air pressure • 4. Psychrometer: An instrument used for measuring the water vapor content of the atmosphere. • 5. Windsock: Cone shaped cloth bag that measures wind direction
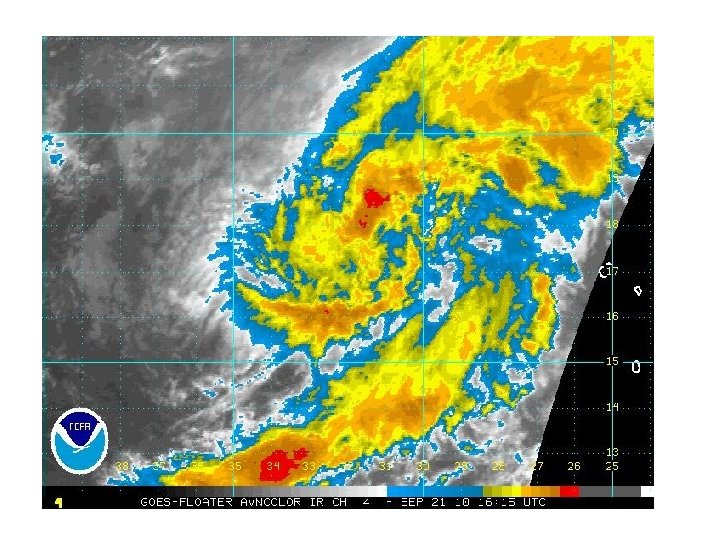
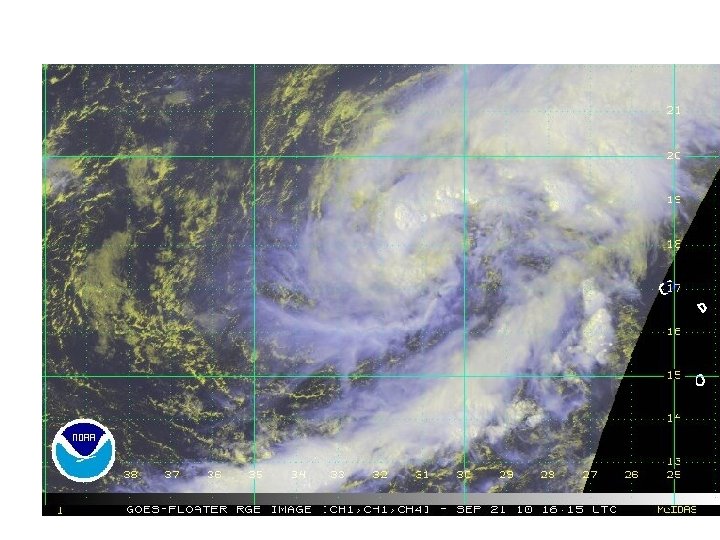
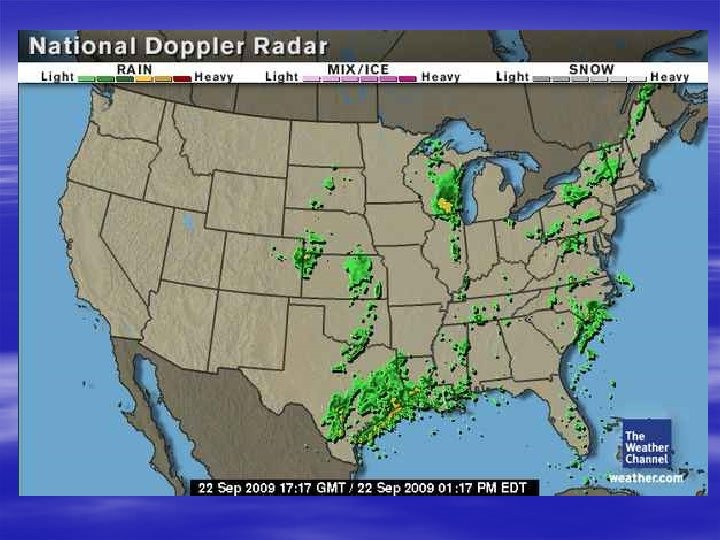
o 6. Anemometer- Measure wind speed o 7. Radar- Finds location, movement and amount of precipitation. Can also predict kind of precipitation 8. Doppler Radar is used by local T. V. stations to track precipitation. o 9. Weather Satellite Orbit Earth and provide images of weather systems.
Weather Instruments Anemometer Wind Sock Thermometer Barometer Doppler Radar Weather Satellite
Satellites in Space • Satellites are tracked by United States Space Surveillance Network (SSN), which has been tracking every object in orbit over 10 cm (3. 937 inches) in diameter since it was founded in 1957. • There approximately 3, 000 satellites operating in Earth orbit, according to the US National Aeronautics and Space Administration (NASA), out of roughly 8, 000 man-made objects in total. • In its entire history, the SSN has tracked more than 24, 500 space objects orbiting Earth. The majority of these have fallen into unstable orbits and incinerated during reentry. • The SSN also keeps track which piece of space junk belongs to which country
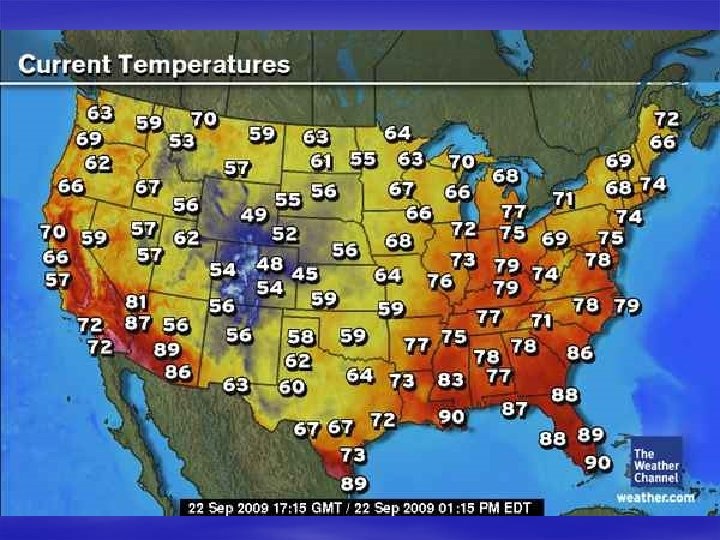
C. Weather Map 1. A weather map can show many different things. 1. Temperature 2. High Pressure (clear) 3. Low Pressure (cloudy) 4. Isobars 5. Rain/Snow 6. Fog 7. Warm Front 8. Cold Front 9. Severe Weather- Hurricanes
D. ISOBARS 1. An isobar is a line connecting locations of equal barometric pressure. Certain weather maps allow us to view High and Low pressure systems that control the weather. Isobar maps show where pressures are relatively high and low, and show us where pressure changes are gradual or dramatic over a distance.
ISOBARS- Certain weather maps allow us to view High and Low pressure systems that control the weather. An isobar is a line connecting locations of equal barometric pressure. Isobar maps show where pressures are relatively high and low, and show us where pressure changes are gradual or dramatic over a distance.
Weather Map Symbols Cold Front High Pressure Clear Weather Warm Front Low Pressure Cloudy Weather Occluded Front Isobars: Stationary Front Show equal Lines of Pressure.
Terms to know: 1. Upwelling-the rising of deeper colder ocean water to shallower depths 2. El Nino- an abnormal warming of surface ocean waters in the Pacific Ocean 3. La Nina-characterized by unusually cold ocean temperatures in the Pacific Ocean 4. Low Pressure- cloudy weather. A hurricane is an area of low pressure 5. High Pressure- clear weather
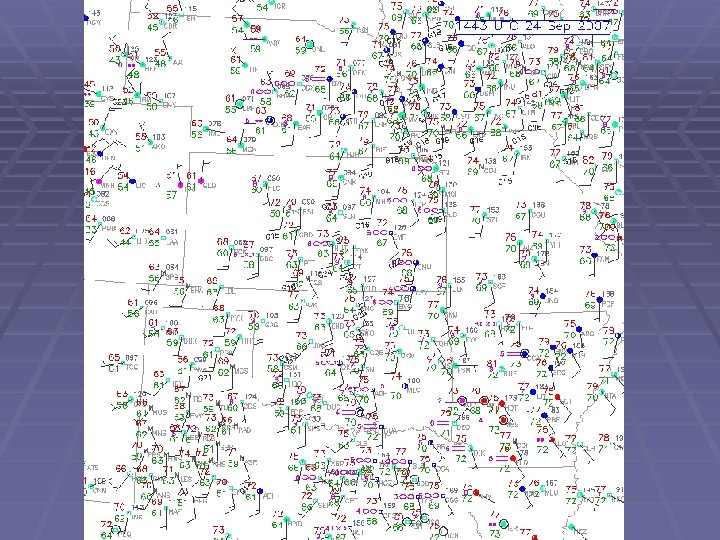
E. Station Model 1. A station model is a symbolic illustration showing the weather occurring at a given reporting station. 2. Meteorologists created the station model to plot a number of weather elements in a small space on weather maps. 3. Maps filled with dense station-model plots can be difficult to read, but they allow meteorologists, pilots, and mariners to see important weather patterns.
Station Model § 77: Temperature § § § § 68: Dewpoint 998: Pressure, to the nearest tenth of a millibar. Add either a 10 or 9 in front based on which would bring the value closer to 1000. The pressure here is 999. 8 millibars (mb). -03: Pressure tendency the last 3 hours, to the nearest tenth of a millibar. The pressure here has fallen. 3 mb the last 3 hours Middle Circle (filled in w/ mostly black): Cloud cover. It's mostly black showing that this station is mostly cloudy. Technically, this represents a broken sky with 7/8 of the sky covered with clouds. Black line, extending from circle: Wind barb. It points to where the wind is coming from. The wind here is from the southwest, hence a southwest wind. The two lines extending represent 20 knot winds with each line representing 10 knots. Symbol between 77 and 68: This is the present weather field and in this case shows that there is a thunderstorm occuring at the station symbol next to -03: That line is the pressure tendency. The 1 st hour the pressure was steady, then fell the last two hours. Triangle(with a dot above it): Previous weather, or the weather one hour ago. In this case it was a light rain shower.
Station Models § Click Below to see the different type of symbols used on a station model. § http: //www. hpc. ncep. noaa. gov/html/station plot_printer. html
National Weather Service (NWS) From the NWS website you can view any kind of weather related information. n You can even see river stages and air quality. n National Oceanic and Atmospheric Administration's National Weather Service
National Oceanic and Atmospheric Administration (NOAA) www. noaa. gov n NOAA collects and analyzes weather data. n Animations: http: //www. educypedia. be/education/climat eanimations. htm n http: //www. ghcc. msfc. nasa. gov/GOES/ n
Assignment: Sept. 24 Define terms 1 -11 using the notes. n Quiz on these terms Wednesday, Sept. 26 n Test 3: Wednesday, October 3 n