Chapter 16 Section 4 Weather Weather Maps and


 From the NWS website you can view any kind of")
 www. noaa. gov n NOAA collects and analyzes")

- Slides: 17
Chapter 16 Section 4 Weather, Weather Maps and Forecasting
Weather ► Weather: The daily conditions of a particular area: temp, rain, pressure, wind, etc. ► Weather Forecast- A prediction about future weather conditions based on weather data. ► Meteorologist: A scientist who studies the weather and brings us the weather forecast, like you see on the news. They use information they gather from many sources to predict the weather. ► Meteorology- the science of studying weather
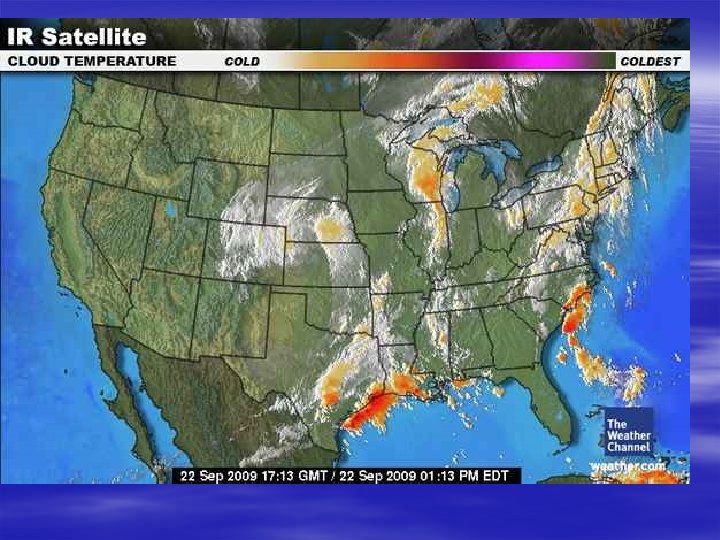
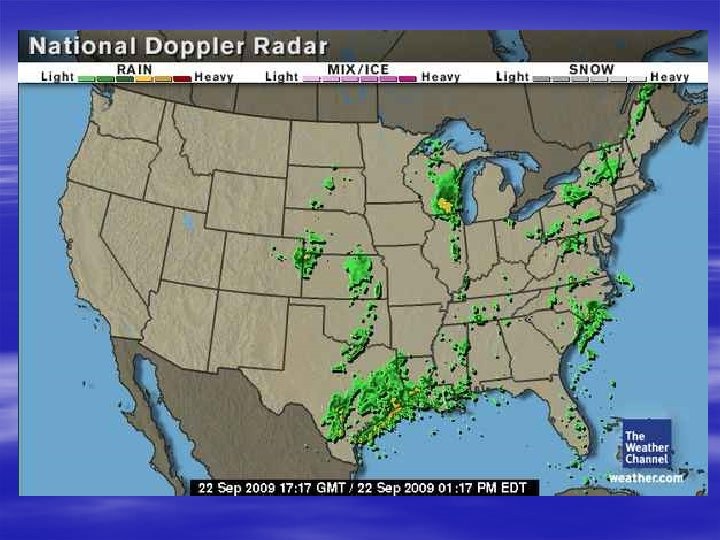
Weather Forecasting Technology • Weather Balloon Carry electronic equipment that can measure weather conditions as high as 30 km above the Earth’s surface. They measure temperature, air pressure and relative humidity. They can also measure wind speed and direction. • Thermometer Measures temperature • Barometer Measures air pressure • Psychrometer An instrument used for measuring the water vapor content of the atmosphere; a type of hygrometer. • Windsock Cone shaped cloth bag Measures wind direction • Anemometer Measure wind speed • Radar Finds location, movement and amount of precipitation. Can also predict kind of precipitation Doppler Radar is used by local T. V. stations to track precipitation. • Weather Satellite Orbit Earth and provide images of weather systems.
Weather Instruments Anemometer Wind Sock Thermometer Barometer Doppler Radar Weather Satellite
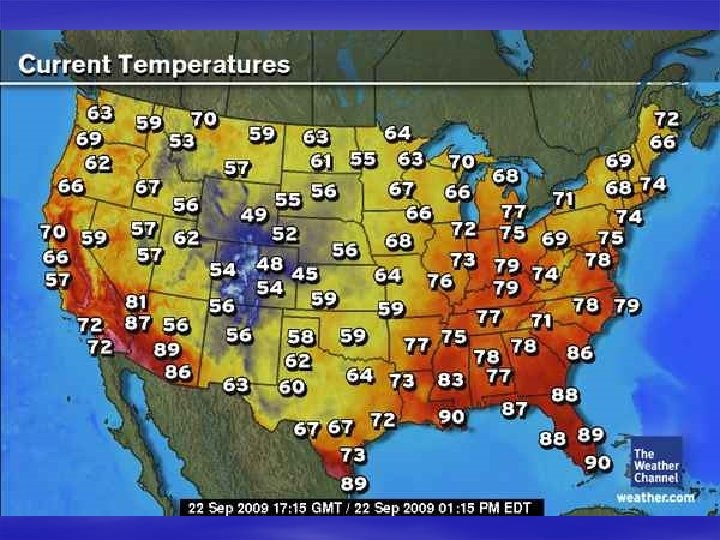
Weather Map A weather map can show many different things. § Temperature § High Pressure (clear) § Low Pressure (cloudy) § Isobars § Rain/Snow § Fog § Warm Front § Cold Front § Severe Weather- Hurricanes
ISOBARS- Certain weather maps allow us to view High and Low pressure systems that control the weather. An isobar is a line connecting locations of equal barometric pressure. Isobar maps show where pressures are relatively high and low, and show us where pressure changes are gradual or dramatic over a distance.
Weather Map Symbols Cold Front High Pressure Clear Weather Warm Front Low Pressure Cloudy Weather Occluded Front Isobars: Stationary Front Show equal Lines of Pressure.
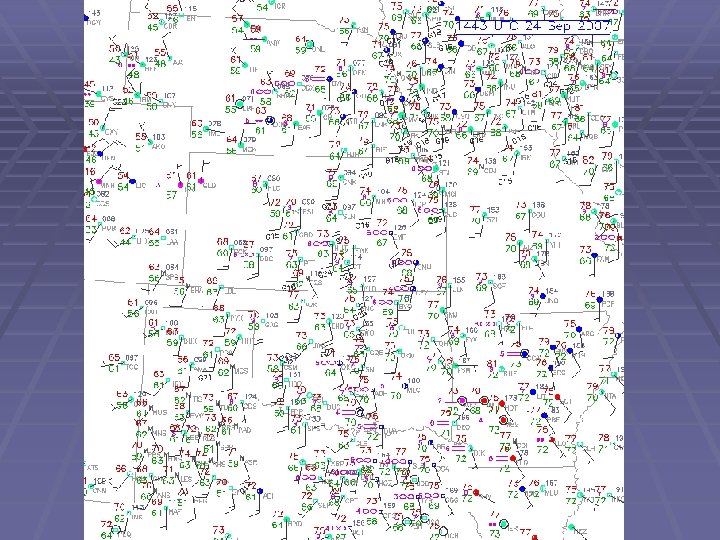
Station Model • All over the United States, hundreds of weather observations are taken several times during the day. These stations collect information such as temperature, pressure, dew point, etc. • Meteorologists need a way to get all of this detailed information into the smallest area possible on a weather map, so that several stations can be plotted for the same observation time on the same map, thus giving a ‘big picture’ of what the weather is doing at a snapshot in time. • Thus the need for the station model. The following exercise will show to translate weather information to and from a station model, and then you will both decode and encode station models on your own.
Station Model § 77: Temperature § § § § 68: Dewpoint 998: Pressure, to the nearest tenth of a millibar. Add either a 10 or 9 in front based on which would bring the value closer to 1000. The pressure here is 999. 8 millibars (mb). -03: Pressure tendency the last 3 hours, to the nearest tenth of a millibar. The pressure here has fallen. 3 mb the last 3 hours Middle Circle (filled in w/ mostly black): Cloud cover. It's mostly black showing that this station is mostly cloudy. Technically, this represents a broken sky with 7/8 of the sky covered with clouds. Black line, extending from circle: Wind barb. It points to where the wind is coming from. The wind here is from the southwest, hence a southwest wind. The two lines extending represent 20 knot winds with each line representing 10 knots. Symbol between 77 and 68: This is the present weather field and in this case shows that there is a thunderstorm occuring at the station symbol next to -03: That line is the pressure tendency. The 1 st hour the pressure was steady, then fell the last two hours. Triangle(with a dot above it): Previous weather, or the weather one hour ago. In this case it was a light rain shower.
Station Models § Click Below to see the different type of symbols used on a station model. § http: //www. hpc. ncep. noaa. gov/html/station plot_printer. html
National Weather Service (NWS) From the NWS website you can view any kind of weather related information. n You can even see river stages and air quality. n National Oceanic and Atmospheric Administration's National Weather Service
National Oceanic and Atmospheric Administration (NOAA) www. noaa. gov n NOAA collects and analyzes weather data. n
Assignment: Sept. 24 Define terms 1 -11 using the notes. n Quiz on these terms Wednesday, Sept. 26 n Test 3: Wednesday, October 3 n