Chapter 15 ppt 2 Buffer capacity titration curves

Chapter 15, ppt 2 Buffer capacity, titration curves and indicators

Buffering Capacity • Definition: The amount of protons or hydroxide ions a buffer can absorb without a significant change in p. H. • Large buffering capacity means it contains a large amount of buffering components and it can absorb a lot of protons/hydroxide ions and show little p. H change • NOTE: The p. H of a buffered solution is determined by [A-]/[HA]. The capacity is determined by how large [HA] and [A-] are
![Optimal Buffering • We want to avoid large changes in the [A-]/[HA] ratio –](http://slidetodoc.com/presentation_image_h2/22e24ee74382f9c036bbc728d206c332/image-3.jpg "Optimal Buffering • We want to avoid large changes in the [A-]/[HA] ratio –")
Optimal Buffering • We want to avoid large changes in the [A-]/[HA] ratio – Best buffered solution will have [HA]=[A-], or [A-]/[HA] = 1

Example • We wish to buffer a solution at p. H = 10. 07. Which one of the following bases (and conjugate acid salts) would be most useful? – NH 3 (Kb = 1. 8 X 10 -5) – C 6 H 5 NH 2 (Kb = 4. 2 X 10 -10) – N 2 H 4 (Kb = 9. 6 X 10 -7)

Titration Term Review • Titrant in buret = solution of known concentration • Equivalence point = stoichiometric point = moles of acid equal moles of base • Endpoint = color changes due to p. H and depends on indicator used • p. H curve = titration curve is a plot of the p. H of the solution being analyzed as a function of the amount of titrant added

Titrations and p. H Curves • Strong Acid - Strong Base • Weak Acid with Strong Base • Weak Base with Strong Acid • Mole is too large of a unit when working with mililiters, so generally a millimole (mmol) is used… 1000 mmol = 1 mol and mmol/m. L = M

Strong Acid - Strong Base Titration • p. H changes gradually until the titration is close to the equilvalence point where a dramatic change occurs • p. H = 7. 00 at equivalence point • Curve points right/left based on beginning solution • Polyprotic acids have multiple curves

Weak Acid-Strong Base Titration • p. H at the equivalence point of a titration of a weak acid with a strong base is always greater than 7. 00 (basic) • p. H is determined by the amount of excess OH- present • Curve looks different before and the same after the equivalence point • The AMOUNT, not strength of acid determines the equivalence point. The STRENGTH affects the p. H at the equivalence point, however. This p. H affects the titration curve.

Titrations vs. Ka • Titration curves can be used to determine equilibrium constant values • EX: 2. 00 mmol of a monoprotic weak acid is dissolved in 100. 0 m. L of water and is titrated with 0. 0500 M Na. OH. After 20. 0 m. L Na. OH has been added, the p. H is 6. 00. What is the Ka value for the acid? – Answer: 1. 0 X 10 -6

Weak Base - Strong Acid Titration • The p. H at the equivalence point will be less than 7. 00 (acid)

Determining the Equivalence Point 1. p. H meter can be used and a plot of the titration curve can be made. 2. Acid-base indicator can be used to see the endpoint (NOT SAME AS EQUIVALENCE POINT, however various indicators can be used so this error won’t be a big deal).

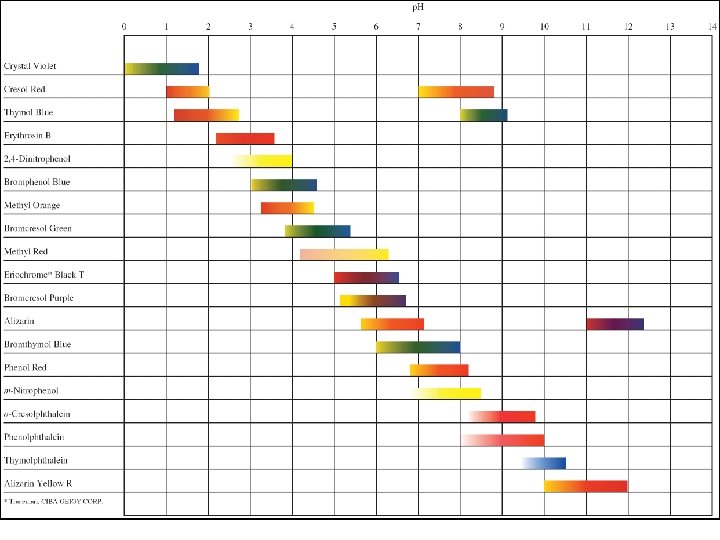
Acid-Base Indicators • Indicators are represented by HIn. As the H+ ions react with OH- ions from the basic titrant (are removed from the HIn), In- ions remain. These In- ions cause the color to change based on the indicator present. • Indicators can be chosen where the endpoint and equivalence point are very close. – Determine the p. H at the equivalence point – Use p. H range chart on page 732
- Slides: 13