Chapter 15 Market Demand Two goods Individual demand


, ∆x/∆p 1 is not a")
 where p=a/2 b so | |=1. When")
x, when you increase the quantity, for the marginal unit, you get")
. So when | |=1, MR=0. When | |>1, MR>0.")
/b, MR=p+(dp/dx)x=p-x/b=(a-x)/b-x/b=(a 2 x)/b. So the slope is twice")


- Slides: 14
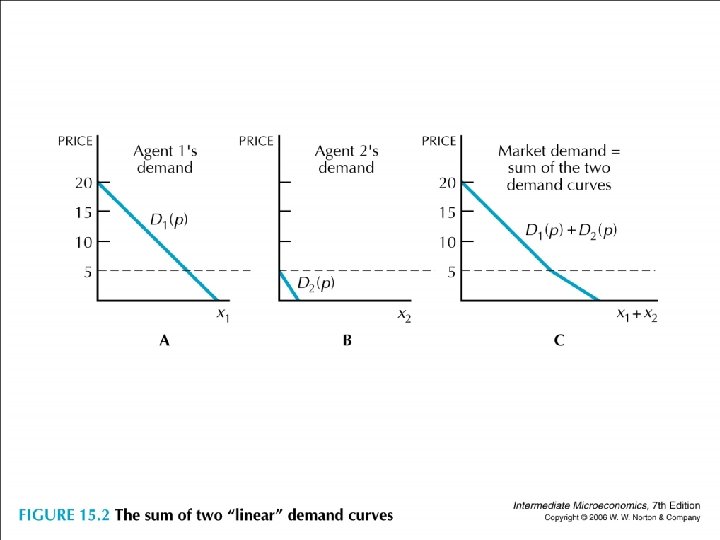
• • Chapter 15 Market Demand Two goods Individual demand for good 1: xi(p 1, p 2, mi) Market demand x(p 1, p 2, m 1, m 2, …, mn)= x 1(p 1, p 2, m 1)+ x 2(p 1, p 2, m 2)+…+ xn(p 1, p 2, mn) • Market demand depends on the distribution of income. • Earlier we talked about inverse demand: given a quantity, the demand gives us the MRS for the consumer to demand such.
• For market demand, we can interpret the inverse demand the same way. Since at optimum, everyone chooses so that MRS equals the relative price ratio and the price ratio is common. Hence, given a quantity (quantity demanded by all), the demand gives us the MRS for all.
• One way to characterize the demand is to describe how responsive it is. For instance, how responsive demand is to price changes, income changes or price changes of other goods.
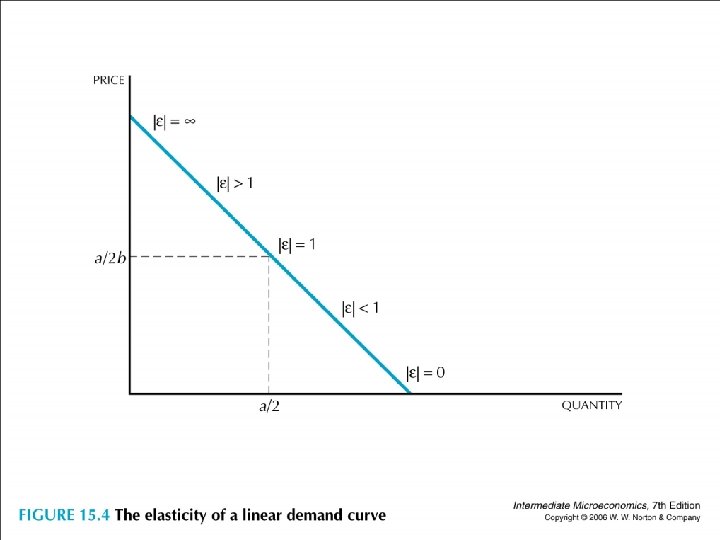
• Price elasticity: x(p 1, p 2, m), ∆x/∆p 1 is not a good measure because it is not unit free. We use (∆x/x)/(∆p 1/p 1) instead. • It is negative for most demands, but sometimes we ignore the negative signs. • | |>1: elastic, | |=1: unit elastic, | |<1: inelastic • Linear demand x=a-bp, a, b>0, then | |=|bp/(a-bp)|
• At the midpoint, | |=bp/(a-bp) where p=a/2 b so | |=1. When p is higher than the midpoint, | |>1. When p is lower than the midpoint, | |<1. • Can calculate the relationship between revenue and elasticity. Revenue R=px, so marginal revenue (the change of revenue when the quantity is increased) MR=d. R/dx=p+(dp/dx)x=p(1+(dp/p)/(dx/ x))=p(1+1/ ), when negatively sloping, this equals p(1 -1/| |).
• MR=p+(dp/dx)x, when you increase the quantity, for the marginal unit, you get an additional revenue p, but since there is only one price, all the units sold before have to be sold at the same price. Thus the revenue is changed by the amount as well (dp/dx)x. • Notice that MR at x=0 equals p (no units sold before) and MR at x>0 typically is less than p when downward sloping.
• MR=p(1 -1/| |). So when | |=1, MR=0. When | |>1, MR>0. When | |<1, MR<0. The intuition is, when demand is elastic, a price decrease makes quantity increase a lot. So it is worthwhile to decrease the price or increase the quantity. Hence MR>0. On the other hand, when the demand is inelastic, a price decrease can hardly change quantity. Thus not worthwhile to decrease the price or increase the quantity, so MR<0.
• For linear demand p=(a-x)/b, MR=p+(dp/dx)x=p-x/b=(a-x)/b-x/b=(a 2 x)/b. So the slope is twice negative. • Simple observation, a firm will not choose a price at which the demand is inelastic. By decreasing the quantity (increasing price), since MR<0, decreasing the quantity increases R.
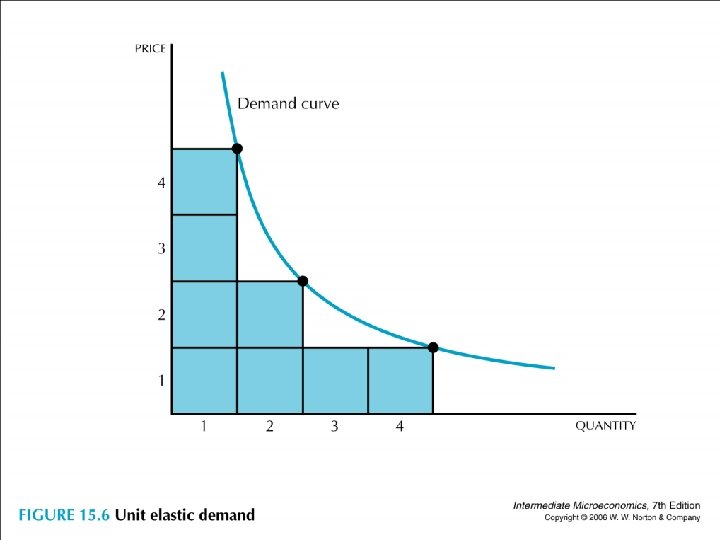
• Decreasing the quantity decreases cost typically. R is increased, C is decreased, so total profit is increased. • Convenient to regress ln(x) on ln(p) because if ln(x)=c+fln(p), then dln(x)/dln(p)=(dx/x)/(dp/p)=f. • Unit elastic demand has MR=0 or R=constant. So any rectangular under the demand curve has the same area.
• Can also work conveniently in this way. To generate a demand of constant elasticity, we want ln(x)=k+fln(p) where k, f are constants. Let ek=c. Hence ln(x)=ln(cpf) or xp-f=c. For instance, if unit elastic, then xp-(-1)=c or xp=c. Work out the examples of f=-2, f=-1/2 yourself. • Income elasticity can be similarly defined as (∆x/x)/(∆m/m). Income elasticity>0: normal, <0: inferior, >1: luxury.
• Income elasticities tend to cluster around 1 because budget constraint is binding. For instance: p 1 x 1 + p 2 x 2=m and p 1 x 1’+ p 2 x 2’=m’. Let ∆ denote the difference. Then p 1∆ x 1+p 2∆x 2=∆m or p 1∆ x 1/∆m+ p 2∆x 2/∆m=1 or [(p 1 x 1)/m](∆ x 1/x 1)/(∆m/m)+ [(p 2 x 2)/m] (∆x 2 /x 2)/(∆m/m)=1. The weighted average (expenditure share) of the income elasticities is 1.