Chapter 15 Capital Budgeting Typical Capital Budgeting Decisions

Chapter 15 Capital Budgeting

Typical Capital Budgeting Decisions Capital budgeting tends to fall into two broad categories. . . Screening decisions. Does a proposed project meet some present standard of acceptance? Preference decisions. Selecting from among several competing courses of action.

Capital Budgeting Methods We will consider four Capital Budgeting methods : 1. 2. 3. 4. Net Present Value Method Internal Rate of Return Method Cash Payback Method Average Rate of Return Method

The Mathematics of Interest A dollar received today is worth more than a dollar received a year from now because you can put it in the bank today and have more than a dollar a year from now.

The Mathematics of Interest – An Example Assume a bank pays 10% interest on a $100 deposit made today. How much will the $100 be worth in one year? Fn = P(1 + n r)

Computation of Present Value An investment can be viewed in two ways—its future value or its present value. Present Value Future Value Let’s look at a situation where the future value is known and the present value is the unknown.

Present Value – An Example If a bond will pay $100 in two years, what is the present value of the $100 if an investor can earn a return of 12% on investments? Fn P= (1 + r)n

Present Value of a Series of Cash Flows An investment that involves a series of identical cash flows at the end of each year is called an annuity $100 1 $100 2 $100 3 $100 4 $100 5 6
 we. . .")
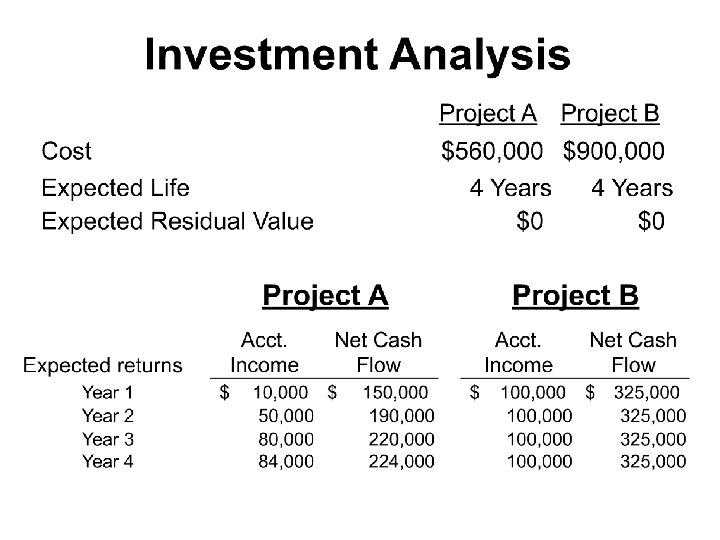
The Net Present Value Method To determine net present value (NPV) we. . . Ø Determine the net initial investment in the project Ø Calculate the sum of the present values of the future cash flows Ø Subtract the amount of the net initial investment from the sum of the present value of the future cash flows to obtain the net present value of the project Ø The interest rate (discount rate) used in determining net present value is the company’s minimum desired rate of return Ø Let’s use 15% as the discount rate to calculate the net present value for Projects A and B

Project A NPV @ 15% Year Net Cash Flow PV Factor Present Value 1 $150, 000 . 870 $130, 500 2 $190, 000 . 756 $143, 640 3 $220, 000 . 658 $144, 760 4 $224, 000 . 572 $128, 128 Total $547, 028 Investment $560, 000 Net Present Value ($12, 972)

Project B NPV @ 15% Year Annual Cash Flow PV Factor Present Value 1 -4 $325, 000 2. 855 $927, 875 Investment $900, 000 Net Present Value $900, 000 $27, 875

The Net Present Value Method General decision rule. . .

Net Present Value Method The net present value of one project cannot be directly compared to the net present value of another project (for ranking) unless the investments are equal.

Ranking Capital Investment Opportunities Using NPV Present Value Index = Sum of PV of cash inflows Initial Investment Project A = $547, 028 = 0. 977 $560, 000 Project B = $927, 875 = 1. 031 $900, 000 Project B yields a higher return than Project A.
 Method • The internal rate of return is the")
Internal Rate of Return (IRR) Method • The internal rate of return is the true rate of return promised by an investment project over its useful life. • It is computed by finding the discount rate that will cause the net present value of a project to be zero. • A trial and error process must be used to find the internal rate of return. • It works better if a project’s cash flows are identical every year. • Let’s calculate the IRR for Projects A and B

Project A NPV @ 12% Year Net Cash Flow PV Factor Present Value 1 $150, 000 . 893 $133, 950 2 $190, 000 . 797 $151, 430 3 $220, 000 . 712 $156, 640 4 $224, 000 . 636 $142, 464 Total $584, 484 Investment $560, 000 Net Present Value $24, 484

Project B NPV @ 20% Year Annual Cash Flow PV Factor Present Value 1 -4 $325, 000 2. 589 $841, 425 Investment $900, 000 Net Present Value $900, 000 ($58, 575)

Internal Rate of Return Method General decision rule. . . When using the internal rate of return, the cost of capital acts as a hurdle rate that a project must clear for acceptance.

Internal Rate of Return Method When using the internal rate of return method to rank competing investment projects, the preference rule is: The higher the internal rate of return, the more desirable the project.

Internal Rate of Return Method - Example • Decker Company can purchase a new machine at a cost of $72, 100 that will save $20, 000 per year in cash operating costs. • The machine has a 7 -year life. • What is the Internal Rate of Return?
 that")
The Payback Method The payback period is the length of time (in years) that it takes for a project to recover its initial cost out of the cash receipts that it generates. Let’s calculate the payback period for Projects A and B

Project A Payback Period Year Net Cash Flow Cumulative Cash Flow 1 $150, 000 2 $190, 000 $340, 000 3 $220, 000 $560, 000 4 $224, 000 Initial Investment: $560, 000

Project B Payback Period Year Net Cash Flow Cumulative Cash Flow 1 $325, 000 2 $325, 000 $650, 000 3 $325, 000 $975, 000 4 $325, 000 Initial Investment: $900, 000

The Payback Method – Another Example • Myers Company wants to install an espresso bar in place of several coffee vending machines in one of its stores. The company estimates that incremental annual revenues and expenses associated with the espresso bar would be: Sales $100, 000 Less variable expenses 30, 000 Contribution margin 70, 000 Less fixed expenses: Insurance $ 9, 000 Salaries 26, 000 Depreciation 15, 000 50, 000 Net operating income $ 20, 000 • Equipment for the espresso bar would cost $150, 000 (salvage value is 0) and have a 10 -year life. The old vending machines would be thrown away since they have no salvage value. The company requires a payback period of 5 years or less on all investments. Let’s calculate the Payback Period

Average Rate of Return Method • Does not focus on cash flows -- rather it focuses on accounting income • The following formula is used to calculate the simple rate of return: Average rate = of return Average annual income Average investment • Let’s calculate the Average Rate of Return for Projects A and B.

The Average Rate of Return Method – Another Example • Myers Company wants to install an espresso bar in place of several coffee vending machines in one of its stores. The company estimates that incremental annual revenues and expenses associated with the espresso bar would be: Sales $100, 000 Less variable expenses 30, 000 Contribution margin 70, 000 Less fixed expenses: Insurance $ 9, 000 Salaries 26, 000 Depreciation 15, 000 50, 000 Net operating income $ 20, 000 • Equipment for the espresso bar would cost $150, 000 (salvage value is 0) and have a 10 -year life. The old vending machines would be thrown away since they have no salvage value. The company requires an average rate of return of 25% or more on all investments. Let’s calculate the Average Rate of Return
- Slides: 27