Chapter 14 Water Pollution P 381 AXES Paragraph


 © BOD- the amount of oxygen a quantity of water")


 © Sediment pollution (sand, silt and")


")
 supports the “protection and propagation of fish,")


- Slides: 39
Chapter 14 Water Pollution P. 381 AXES Paragraph P. 20 NB
Agenda 12/1 • • Welcome back! Start CH 14, Warm up, pg. 52 Pass back: PG & E assignment, Watt Meter labs • Need PG & E assignments from. . Read Opening Story CH 14 Go over Topic IV Test, Test Corrections due Friday! Current Events: • Taylor, Jonathan, Brad Ecocolumn Lab help
12/1 Water Pollution CH 14 Obj. TSW distinguish the difference between point and nonpoint source pollution. P. 52 NB 1. Compare & Contrast Point Source & Non Point Source Pollution. 2. What are three reasons scientists are concerned about human waste water? 3. Explain BOD.
Water Pollution © Water pollution- the contamination of streams, rivers, lakes, oceans, or groundwater with substances produced through human activities and that negatively affect organisms.
Which is Point source and Nonpoint source?
Water Pollution © Point sources- distinct locations that pump waste into a waterway. © Nonpoint sources- diffuse areas such as an entire farming region that pollutes a waterway. © Important difference because: © Distinction can help in controlling pollutant inputs to waterways © EX) ?
Human Wastewater © Water produced by human activities such as human sewage from toilets and gray water from bathing and washing clothes or dishes.
Three reasons scientists are concerned about human wastewater: © Oxygen-demanding wastes like bacteria that put a large demand for oxygen in the water. © Nutrients that are released from wastewater decomposition can make the water more fertile causing eutrophication. © Wastewater can carry a wide variety of diseasecausing organisms.
Biochemical Oxygen Demand (BOD) © BOD- the amount of oxygen a quantity of water uses over a period of time at a specific temperature. © Lower BOD values indicate the water is less polluted and higher BOD values indicate it is more polluted by wastewater. Fish Die off in Lake Trafford Florida Dead Zone – Raw Sewage
Eutrophication © Eutrophication is an abundance of fertility to a body of water. © Eutrophication is caused by an increase in nutrients, such as fertilizers. © Eutrophication cause a rapid growth of algae which eventually dies, causing the microbes to increase the BOD.
Agenda 12/2 • Warm up, pg. 54 • Stamp CH 14 MC SG, go over answers, pg. 55 • Pollution Solution Presentations, pg. 55 • Ecocolumn Lab Time • Video, notes on pg. 59
12/2 Pollution: Waste, Treatment, and Human Health. CH 14 Obj. TSW learn and discuss diseases in our water, how to clean waste water and how inorganic compounds can cause a risk to human health. P. 54 NB 1. Identify some disease causing organisms, & explain what an indicator species is. 2. Describe and contrast the two most common ways to treat wastewater. 3. ID some heavy metals and explain the risk to human health and the environment.
Common Diseases from Human Wastewater © Cholera © Typhoid fever © Stomach flu © Diarrhea © Cholera © Hepatitis
Indicator Species • • • Given the risk that so many pathogens pose= Need to be able to test if they are in our drinking water Hard to test for all of these pathogens Use indicator species Organisms that indicate whether or not diseasecausing pathogens are likely to be present Best indicator: • Fecal Coliform Bacteria
Treatments for Human and Animal Wastewater © Septic systems- a large container that receives wastewater from the house.
Treatments for Human and Animal Wastewater © Sewage Treatment Plants- centralized plants in areas with large populations that receive wastewater via a network of underground pipes.
A sewage Treatment Plant
Treatments for Human and Animal Wastewater © Manure lagoons- large, human-made ponds line with rubber to prevent the manure from leaking into the groundwater. After the manure is broken down by bacteria, it is spread onto fields as fertilizers. © Biodigesters collect methane produced from the microbial breakdown and convert it to electricity for the electrical grid during peak demand.
Heavy Metals and Other Substances that can threaten human Health and the Environment © Lead © Arsenic © Mercury © Acids © Synthetic compounds (pesticides, pharmaceuticals, and hormones)
Measurements from water wells. Dissolves in ground water Associated with Skin Cancers, lungs, kidneys, & bladder. Arsenic can be removed by membrane filtration, distillation, and reverse osmosis.
World Mercury Production Causes: • Burning Coal • Incineration of garbage • Hazardous waste • Medical supplies • Dental supplies • Limestone
Pollution Solution • • Groups of three, Five topics: • • • Oil Pollution: Prishna, Lovpret, Mandeep Solid Waste Pollution: Jeanelle, Matt, Ayat, Jon Sediment Pollution: Monica, Luis, Bryan, Rachana Thermal Pollution: Brad, Magda, Ellie, Taylor Noise Pollution: Daniela Jasmine, Joseph Explain what it is and how we can remediate it? (Use book and outside sources)
Do the Math • • • In 2010, the South Anna River had a largemouth bass population of 25, 000 individuals over a 10 -mile stretch. In early 2011, a chemical spill occurred and the population of largemouth bass decreased to only 5000 individuals over the same area. Calculate the percent change in largemouth bass in the South Anna River. 25, 000 – 5, 000 = 20, 000/25, 000 =. 80 x 100 = 80% There was an 80% change in the large mouth bass found in the south Anna river after the oil spill.
12/3 Water & Air Pollution Review CH 14 & 15 Obj. TSW discuss thermal, & noise pollution and our Nations water laws. P. 52 NB 1. Discuss what thermal pollution is and a solution to the problem. 2. Why is Noise considered water pollution? 3. Discuss what some of our Nation’s water laws are?
Acid Mine Drainage - Italy Streams with low p. H Tall smokestacks from Industrial plants burning coal were releasing sulfur dioxide & nitrogen dioxide into the air. Sulfuric acid and nitric acid were formed in the atmosphere and returned hundreds of kilometers away as acid deposition – rain & snow. p. H below 5 Installation of Scrubbers to decrease acids.
Contaminants in Streams • Waste Water • Agriculture • Forestry • Industry USGS tested 139 streams across the US they contained antibiotics, reproductive hormones, nonprescription drugs and steroids
Oil Pollution in the Ocean Approx. What surprises you about these graphs? 5, 000 offshore oil platforms in North America. Oil Tankers have double hulls to help prevent spills.
Ways to Remediate Oil Pollution ©Containment using booms to keep the floating oil from spreading. ©Chemicals that help break up the oil, making it disperse before it hits the shoreline. ©Bacteria that are genetically engineered to consume oil
Other Water Pollutants © Solid waste pollution (garbage) © Sediment pollution (sand, silt and clay) © Thermal pollution © Noise pollution Santa Ana River in CA Indonesia
Thermal Pollution – Nuclear Reactors Empty the water into holding ponds before it returns to the river or lake or ocean. Iceland – Svartsengi Power Plant Solution – to use a cooling tower to reduce the temperature of water by evaporation.
LAB: Waste and its effect on atmospheric carbon dioxide • P. 68 Env. Sci book • Obj. to evaluate the effect of the presence of pollutants such as sewage, agricultural runoff etc. on atmospheric carbon dioxide levels in the environment. • P. 25 NB
Procedure 1. In pairs, Get a GLX and a CO sensor probe. 2. Turn on your GLX, plug in your CO sensor probe. Note 2 2 the value in the air, write this CO 2 value on your lab. 3. Using a graduated cylinder, add 5 ml of tap water to the 250 –ml plastic CO 2 collection bottle, write the CO 2 value on your lab. 4. Add 10 ml of milk to the 250 - ml gas sampling bottle, write the CO 2 value on your lab. Dry the graduated cylinder. 5. Noting the time, add 10 ml of yeast mixture to the 250 ml gas sampling bottle and swirl to mix. 6. Connect the probe to the bottle and record the data every minute for the next 4 minutes. Control is Time 0. 7. Now, repeat the 1 – 6 steps, but add 30 ml of milk.
Data: CO 2 level in the classroom _____ Time 0 1 2 3 (Control) minutes 4 minutes 10 ml Milk [CO 2] 30 ml Milk [CO 2] Qualitative data: Did you feel heat from the 250 ml gas sampling bottle? Why? Lab due:
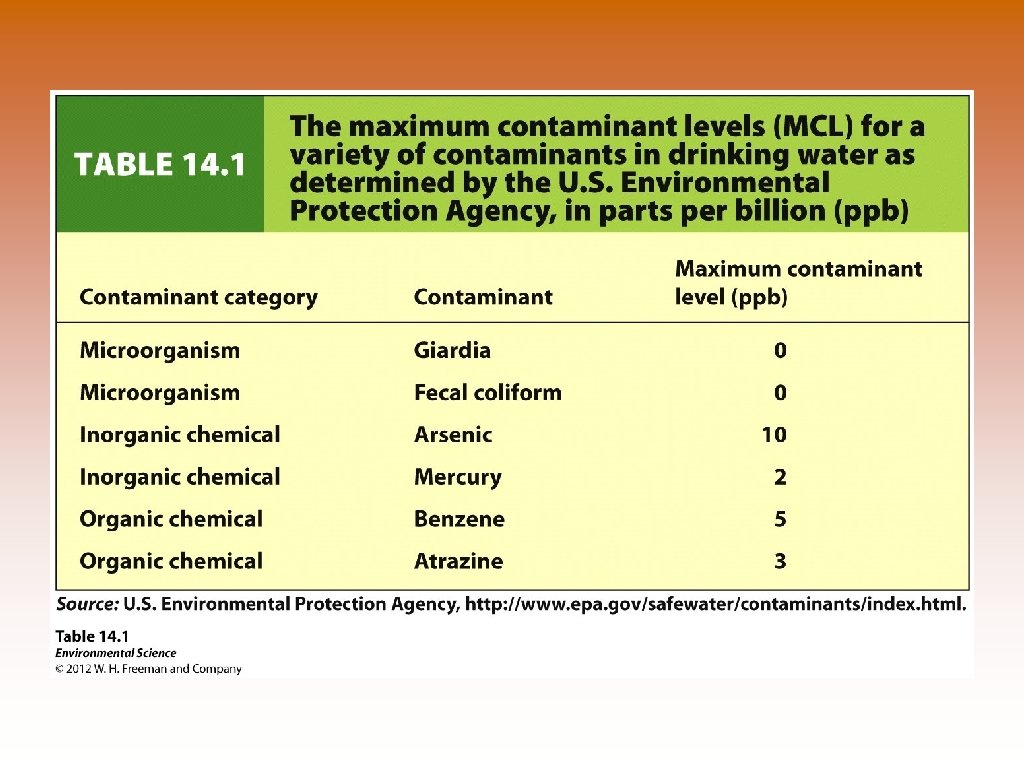
Water Laws © Clean Water Act- (1972) supports the “protection and propagation of fish, shellfish, and wildlife and recreation in and on the water”. © Issued water quality standards that defined acceptable limits of various pollutants in U. S. waterways. © Safe Drinking Water Act- (1974, 1986, 1996) sets the national standards for safe drinking water. © It is responsible for establishing maximum contaminant levels (MCL) for 77 different elements or substances in both surface water and groundwater.
• Sustainability: A “Green” wastewater treatment plant in Massachusetts Greenhouses decompose the organic material and remove excess nitrogen.
Working Toward Sustainability • Building “Green” Solutions to Wastewater Treatment
5/28 Water Pollution CH 14 p. 74 NB 1. Give an example of Point source pollution. 2. Explain Eutrophication. 3. Give some examples of Heavy Metals and where they are found.