
Chapter 13 Simple Linear Regression Yandell Econ 216




- Slides: 67
Chapter 13 Simple Linear Regression Yandell – Econ 216 Chap 13 -1
Chapter Goals After completing this chapter, you should be able to: Evaluate and interpret the simple correlation between two variables n Calculate and interpret the simple linear regression equation for a set of data n Understand the assumptions behind regression analysis n n Determine whether a regression model is significant Yandell – Econ 216 Chap 13 -2
Chapter Goals (continued) After completing this chapter, you should be able to: n n Calculate and interpret confidence intervals for the regression coefficients Recognize regression analysis applications for purposes of prediction and description Recognize some potential problems if regression analysis is used incorrectly Recognize nonlinear relationships between two variables Yandell – Econ 216 Chap 13 -3
Correlation and Regression Overview A brief overview of correlation and regression is available on this course CD n n Correlation and regression basics Steps in regression analysis Summary measures of regression Notation and definitions Click here to view the Overview document (. pdf format) Yandell – Econ 216 Chap 13 -4
Scatter Plots and Correlation n n A scatter plot (or scatter diagram) is used to show the relationship between two variables Correlation analysis is used to measure strength of the association (linear relationship) between two variables n Correlation is only concerned with strength of the relationship n No causal effect is implied with correlation n Correlation was first presented in Chapter 3 Yandell – Econ 216 Chap 13 -5
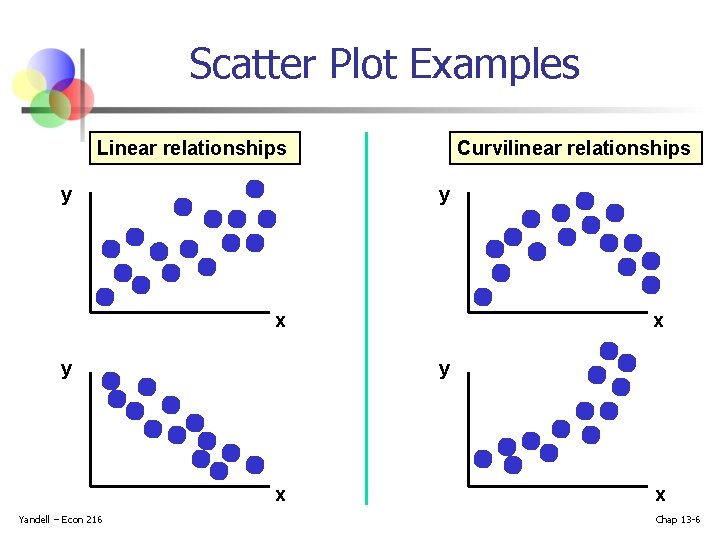
Scatter Plot Examples Linear relationships y Curvilinear relationships y x y y x Yandell – Econ 216 x x Chap 13 -6
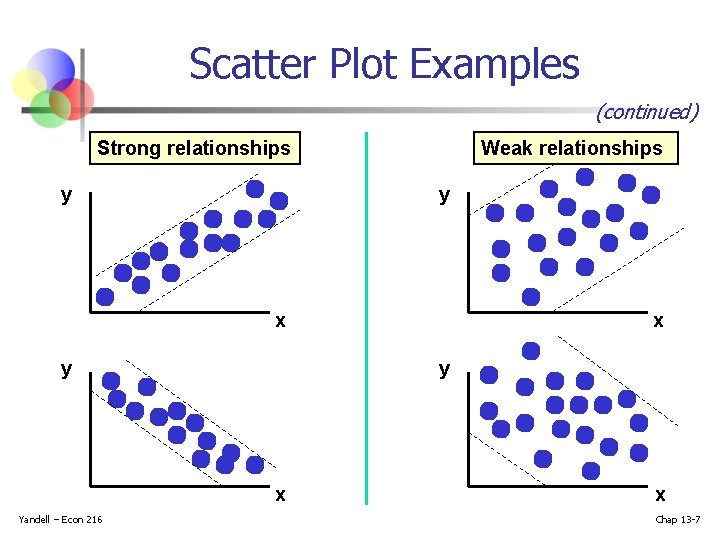
Scatter Plot Examples (continued) Strong relationships y Weak relationships y x y y x Yandell – Econ 216 x x Chap 13 -7
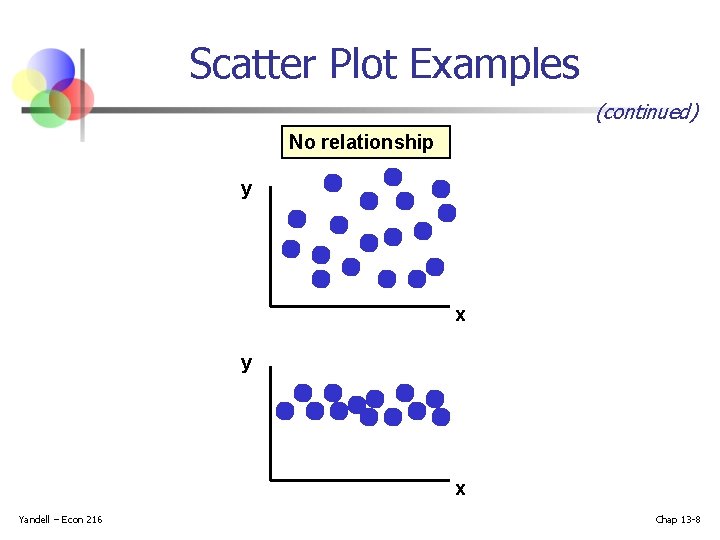
Scatter Plot Examples (continued) No relationship y x Yandell – Econ 216 Chap 13 -8
Correlation Coefficient (continued) n n Yandell – Econ 216 The population correlation coefficient ρ (rho) measures the strength of the association between the variables The sample correlation coefficient r is an estimate of ρ and is used to measure the strength of the linear relationship in the sample observations Chap 13 -9
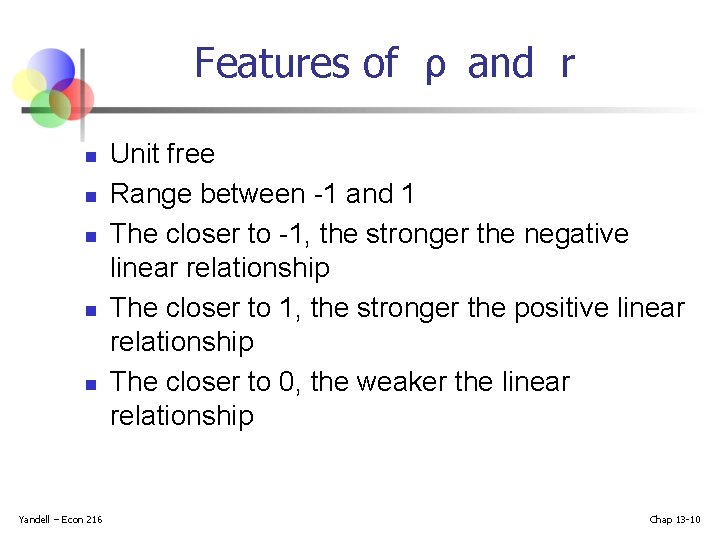
Features of ρ and r n n n Yandell – Econ 216 Unit free Range between -1 and 1 The closer to -1, the stronger the negative linear relationship The closer to 1, the stronger the positive linear relationship The closer to 0, the weaker the linear relationship Chap 13 -10
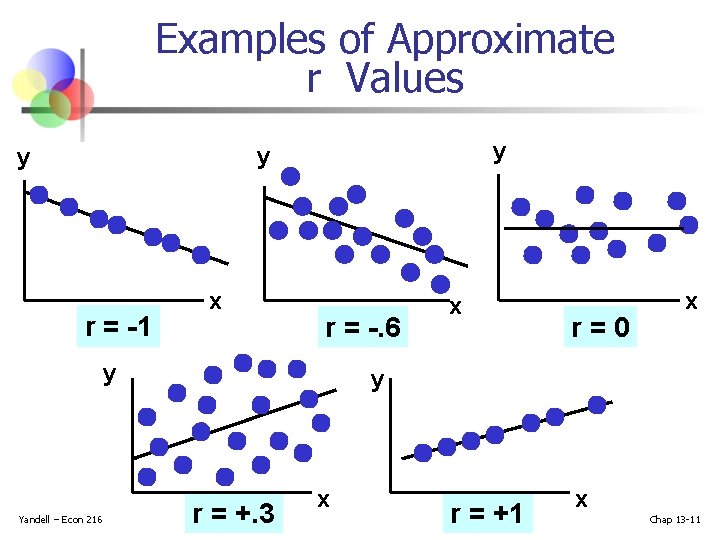
Examples of Approximate r Values y y y r = -1 x r = -. 6 y Yandell – Econ 216 x r = 0 x y r = +. 3 x r = +1 x Chap 13 -11
Introduction to Regression Analysis n Regression analysis is used to: n n Predict the value of a dependent variable based on the value of at least one independent variable Explain the impact of changes in an independent variable on the dependent variable Dependent variable: the variable we wish to explain Independent variable: the variable used to explain the dependent variable Yandell – Econ 216 Chap 13 -12
Simple Linear Regression Model n n n Yandell – Econ 216 Only one independent variable, X Relationship between X and Y is described by a linear function Changes in Y are assumed to be caused by changes in X Chap 13 -13
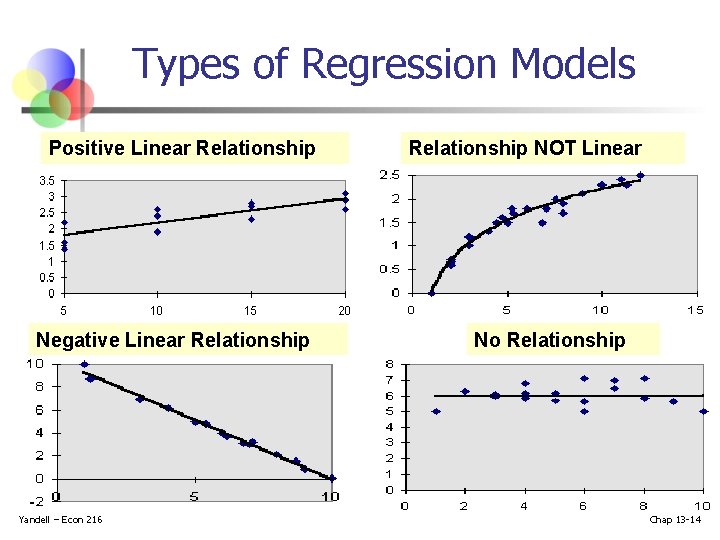
Types of Regression Models Positive Linear Relationship Negative Linear Relationship Yandell – Econ 216 Relationship NOT Linear No Relationship Chap 13 -14
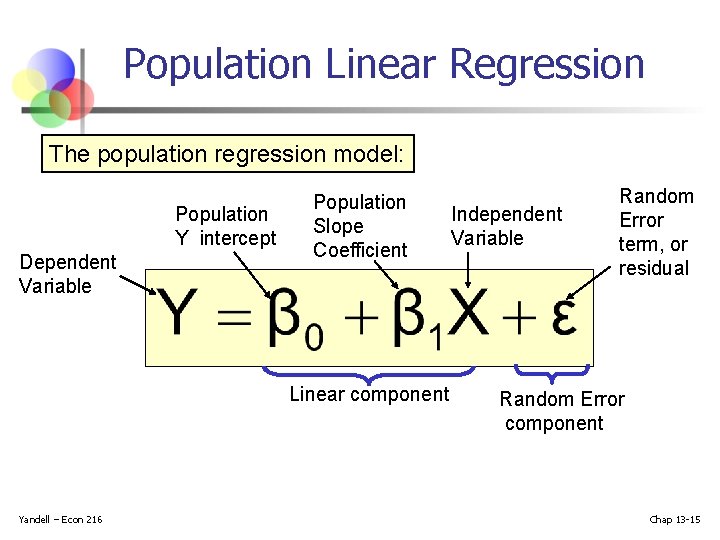
Population Linear Regression The population regression model: Population Y intercept Dependent Variable Population Slope Coefficient Linear component Yandell – Econ 216 Independent Variable Random Error term, or residual Random Error component Chap 13 -15
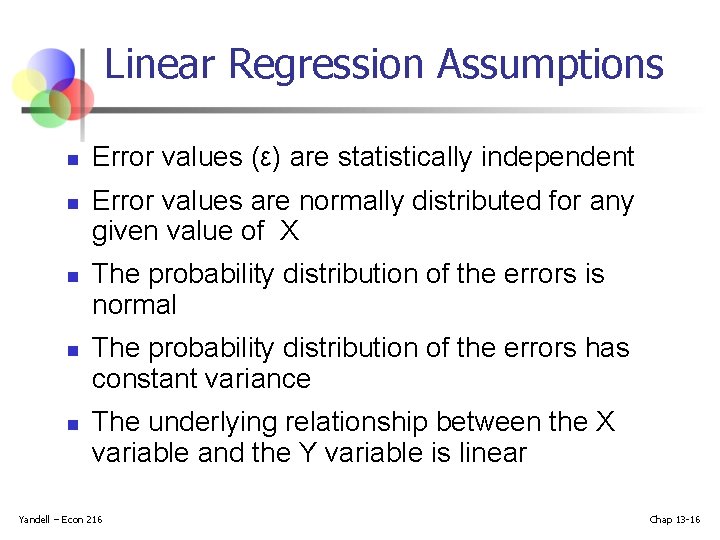
Linear Regression Assumptions n n n Error values (ε) are statistically independent Error values are normally distributed for any given value of X The probability distribution of the errors is normal The probability distribution of the errors has constant variance The underlying relationship between the X variable and the Y variable is linear Yandell – Econ 216 Chap 13 -16
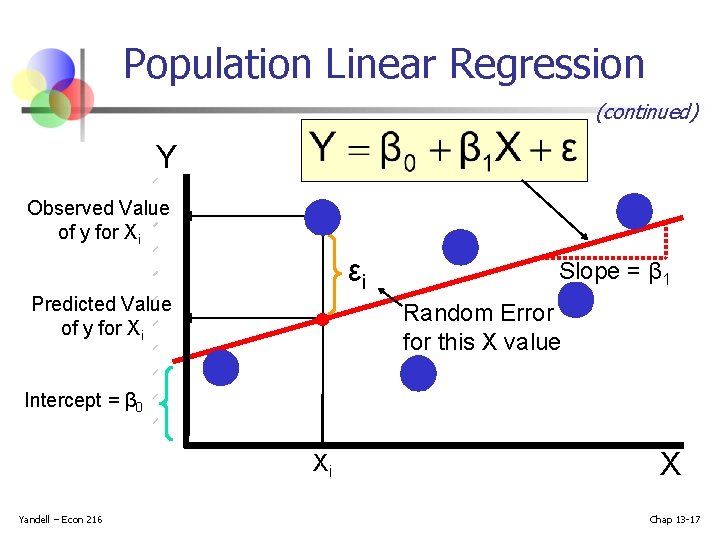
Population Linear Regression (continued) Y Observed Value of y for Xi εi Predicted Value of y for Xi Slope = β 1 Random Error for this X value Intercept = β 0 Xi Yandell – Econ 216 X Chap 13 -17
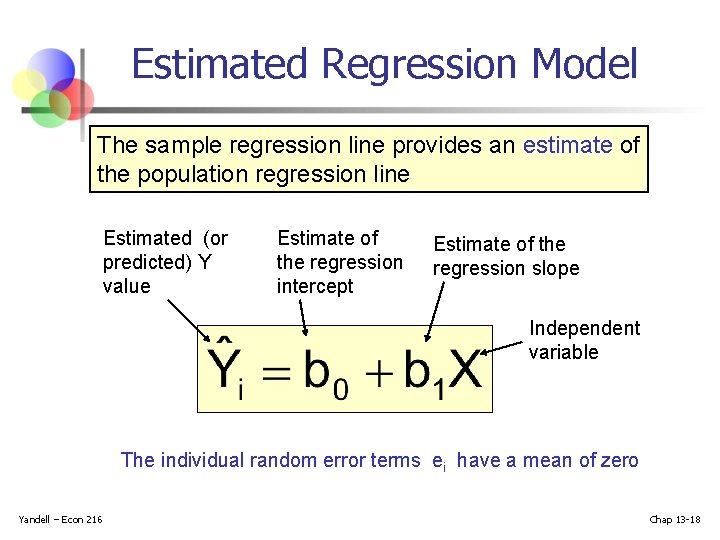
Estimated Regression Model The sample regression line provides an estimate of the population regression line Estimated (or predicted) Y value Estimate of the regression intercept Estimate of the regression slope Independent variable The individual random error terms ei have a mean of zero Yandell – Econ 216 Chap 13 -18
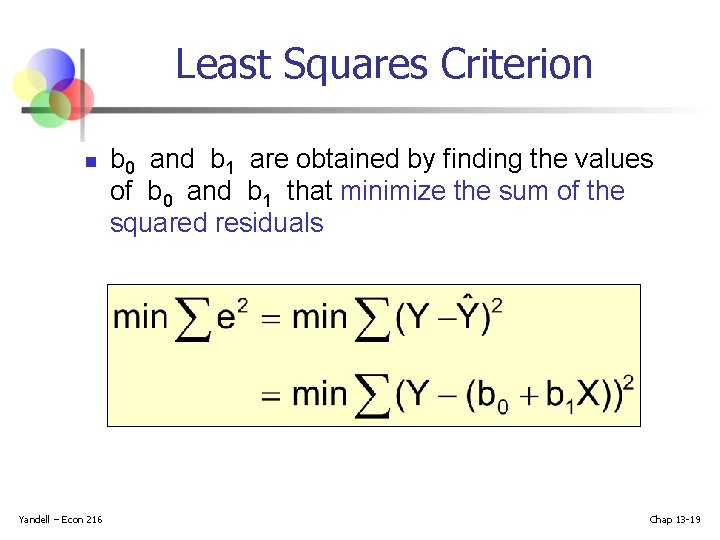
Least Squares Criterion n Yandell – Econ 216 b 0 and b 1 are obtained by finding the values of b 0 and b 1 that minimize the sum of the squared residuals Chap 13 -19
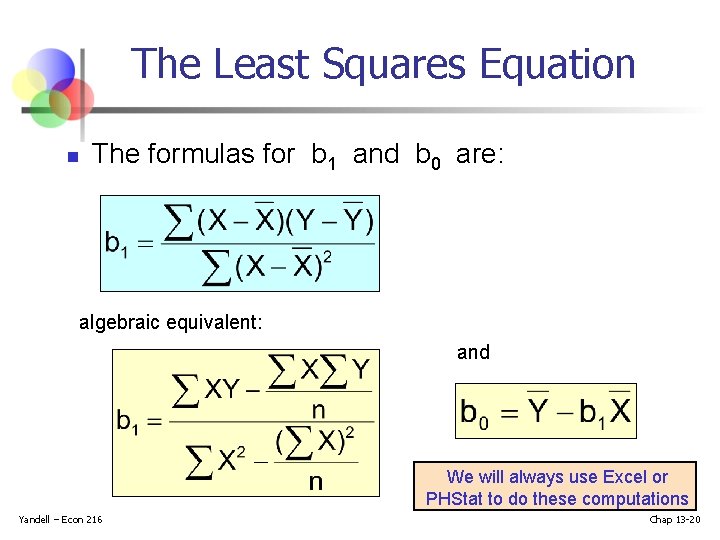
The Least Squares Equation n The formulas for b 1 and b 0 are: algebraic equivalent: and We will always use Excel or PHStat to do these computations Yandell – Econ 216 Chap 13 -20
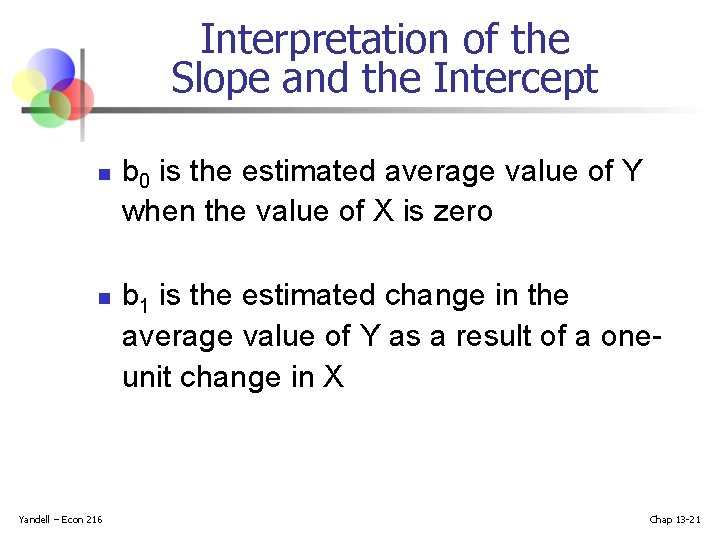
Interpretation of the Slope and the Intercept n n Yandell – Econ 216 b 0 is the estimated average value of Y when the value of X is zero b 1 is the estimated change in the average value of Y as a result of a oneunit change in X Chap 13 -21
Finding the Least Squares Equation n n The coefficients b 0 and b 1 will be found using computer software, such as Excel or PHStat Other regression measures will also be computed as part of computer-based regression analysis Yandell – Econ 216 Chap 13 -22
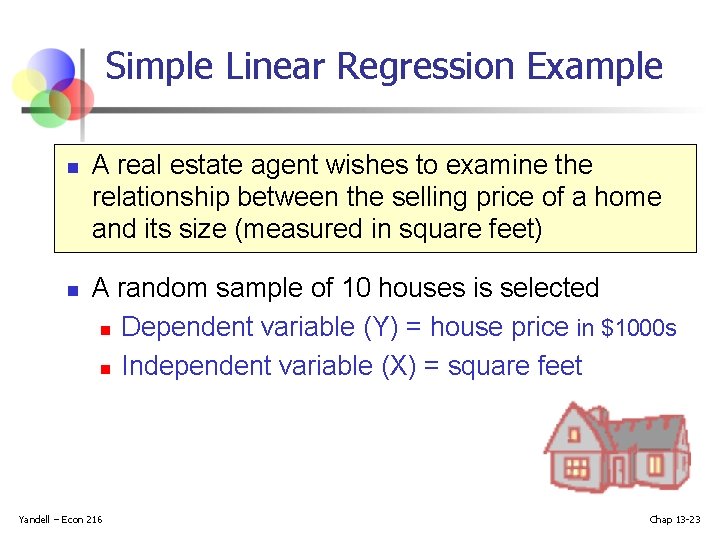
Simple Linear Regression Example n n A real estate agent wishes to examine the relationship between the selling price of a home and its size (measured in square feet) A random sample of 10 houses is selected n Dependent variable (Y) = house price in $1000 s n Independent variable (X) = square feet Yandell – Econ 216 Chap 13 -23
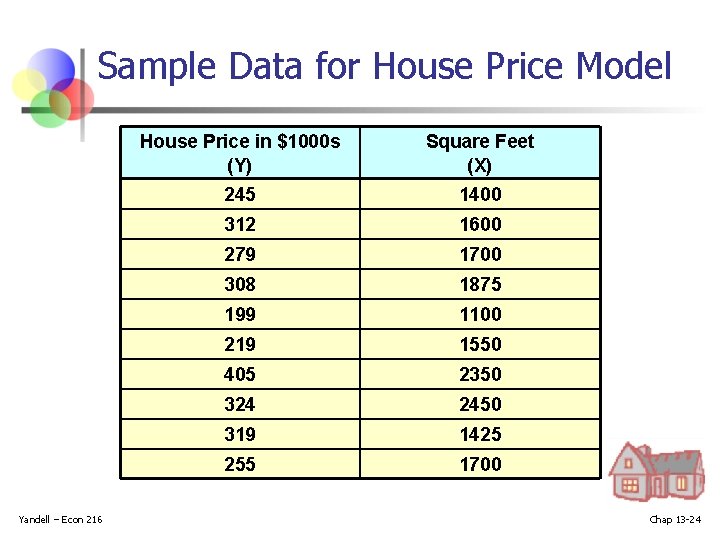
Sample Data for House Price Model Yandell – Econ 216 House Price in $1000 s (Y) Square Feet (X) 245 1400 312 1600 279 1700 308 1875 199 1100 219 1550 405 2350 324 2450 319 1425 255 1700 Chap 13 -24
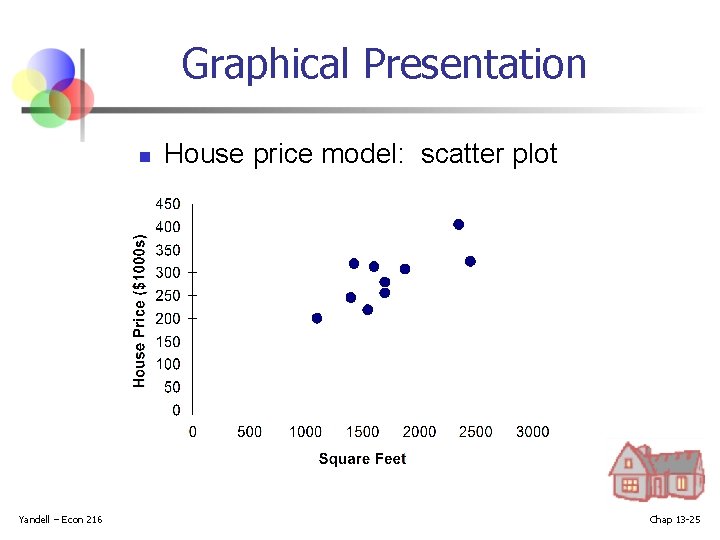
Graphical Presentation n Yandell – Econ 216 House price model: scatter plot Chap 13 -25
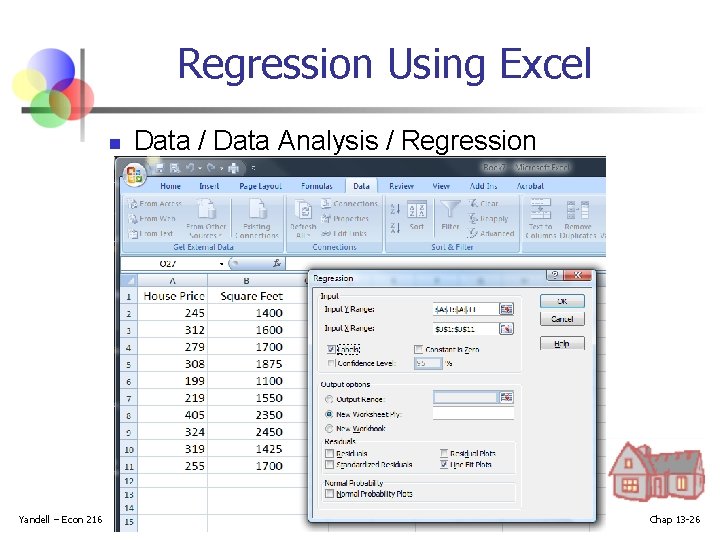
Regression Using Excel n Yandell – Econ 216 Data / Data Analysis / Regression Chap 13 -26
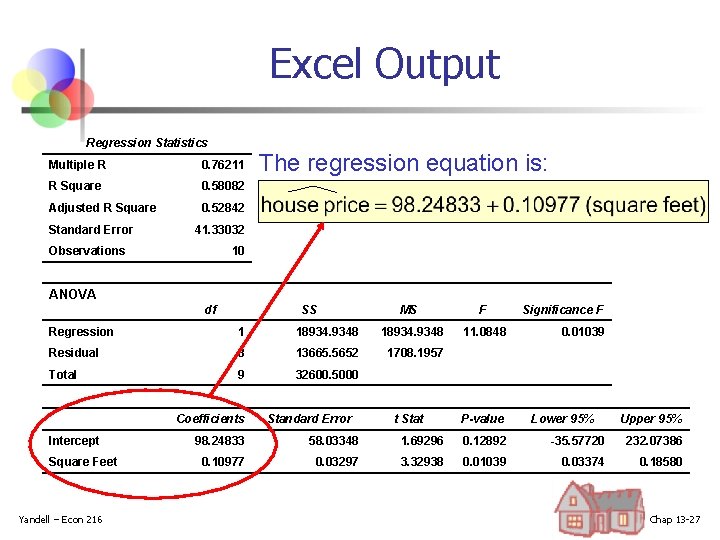
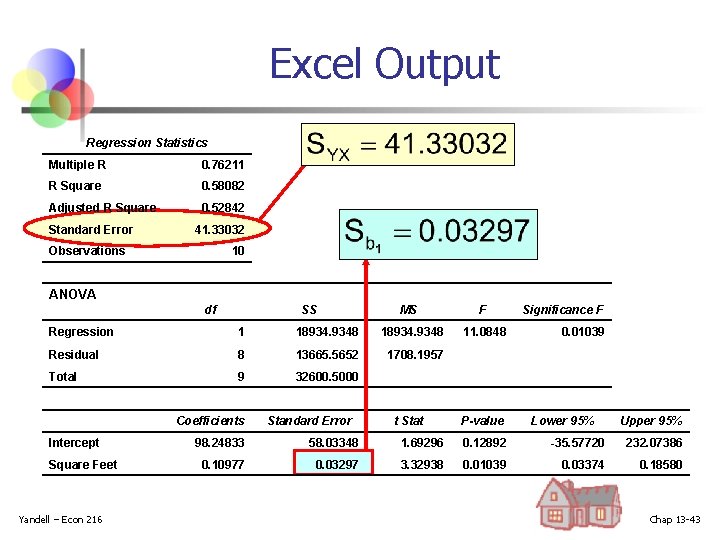
Excel Output Regression Statistics Multiple R 0. 76211 R Square 0. 58082 Adjusted R Square 0. 52842 Standard Error The regression equation is: 41. 33032 Observations 10 ANOVA df SS MS Regression 1 18934. 9348 Residual 8 13665. 5652 1708. 1957 Total 9 32600. 5000 Intercept Square Feet Yandell – Econ 216 Coefficients Standard Error F 11. 0848 t Stat Significance F 0. 01039 P-value Lower 95% Upper 95% 98. 24833 58. 03348 1. 69296 0. 12892 -35. 57720 232. 07386 0. 10977 0. 03297 3. 32938 0. 01039 0. 03374 0. 18580 Chap 13 -27
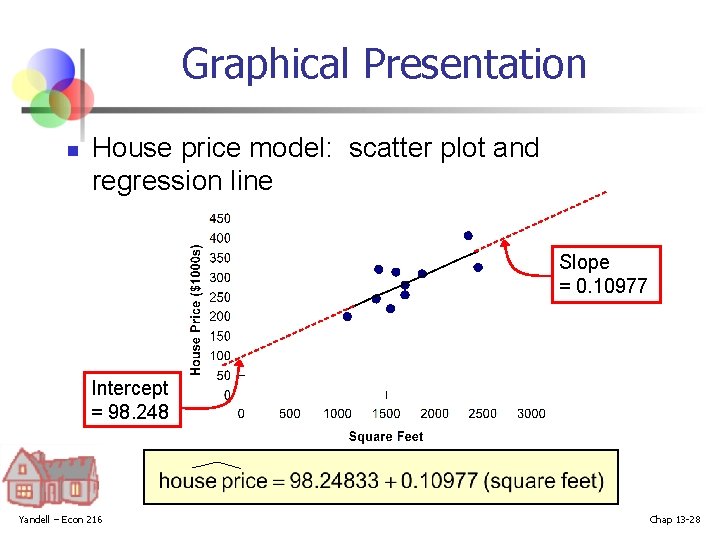
Graphical Presentation n House price model: scatter plot and regression line Slope = 0. 10977 Intercept = 98. 248 Yandell – Econ 216 Chap 13 -28
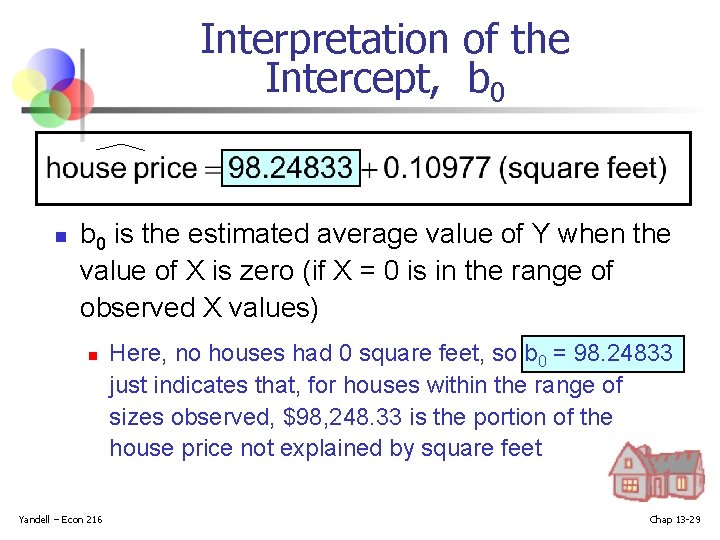
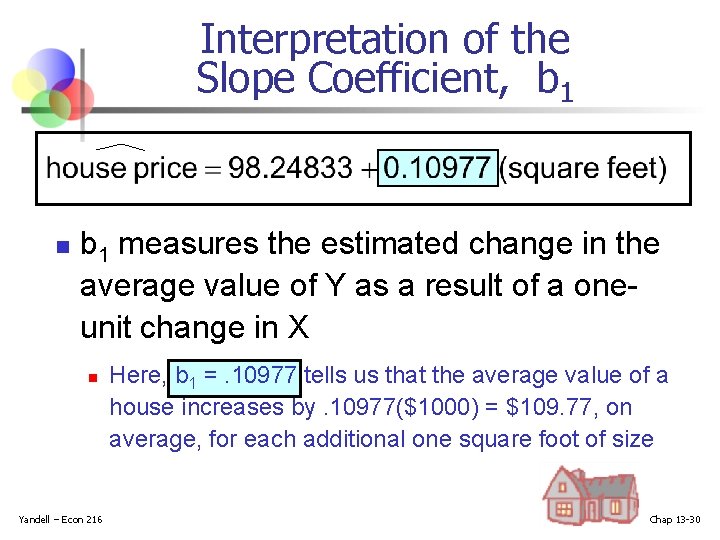
Interpretation of the Intercept, b 0 n b 0 is the estimated average value of Y when the value of X is zero (if X = 0 is in the range of observed X values) n Yandell – Econ 216 Here, no houses had 0 square feet, so b 0 = 98. 24833 just indicates that, for houses within the range of sizes observed, $98, 248. 33 is the portion of the house price not explained by square feet Chap 13 -29
Interpretation of the Slope Coefficient, b 1 n b 1 measures the estimated change in the average value of Y as a result of a oneunit change in X n Yandell – Econ 216 Here, b 1 =. 10977 tells us that the average value of a house increases by. 10977($1000) = $109. 77, on average, for each additional one square foot of size Chap 13 -30
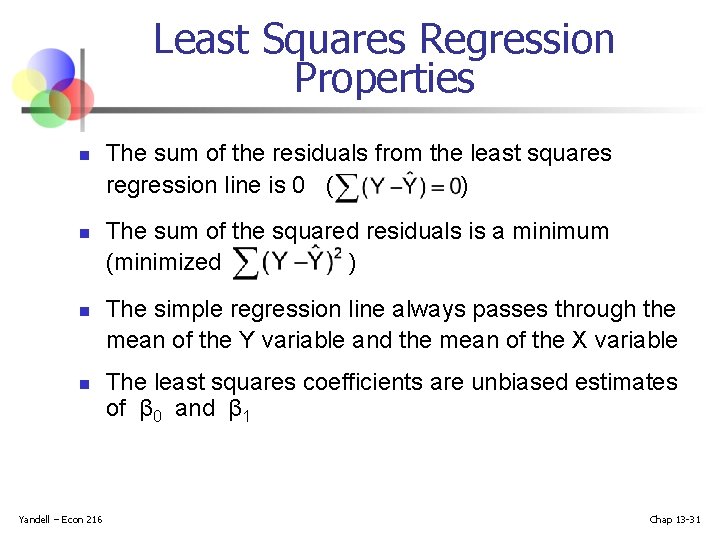
Least Squares Regression Properties n n Yandell – Econ 216 The sum of the residuals from the least squares regression line is 0 ( ) The sum of the squared residuals is a minimum (minimized ) The simple regression line always passes through the mean of the Y variable and the mean of the X variable The least squares coefficients are unbiased estimates of β 0 and β 1 Chap 13 -31
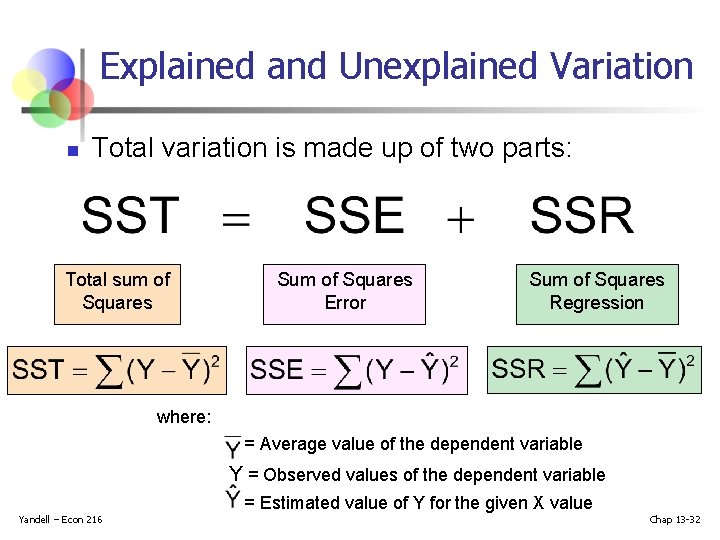
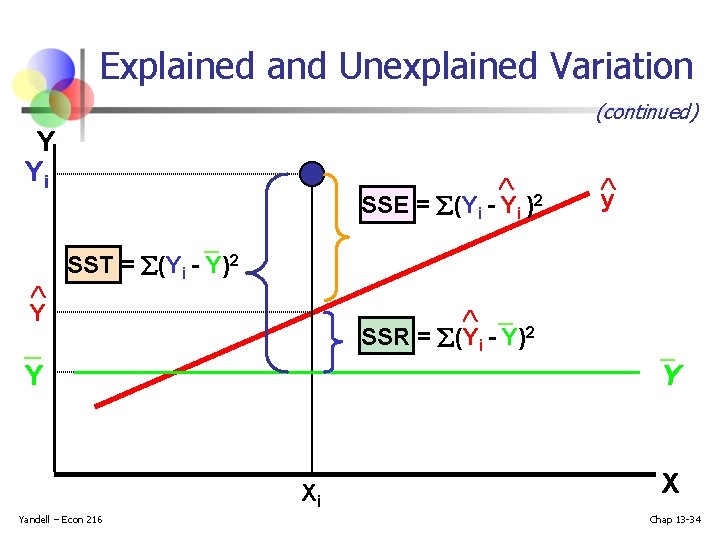
Explained and Unexplained Variation n Total variation is made up of two parts: Total sum of Squares Sum of Squares Error Sum of Squares Regression where: = Average value of the dependent variable Y = Observed values of the dependent variable Yandell – Econ 216 = Estimated value of Y for the given X value Chap 13 -32
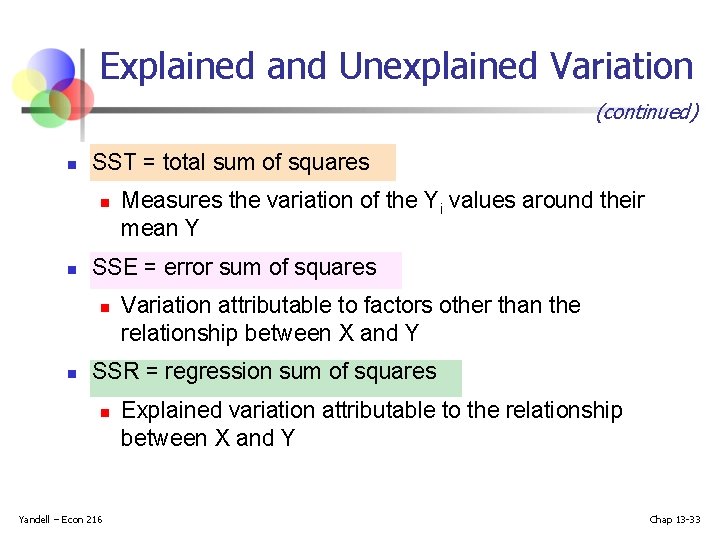
Explained and Unexplained Variation (continued) n SST = total sum of squares n n SSE = error sum of squares n n Measures the variation of the Yi values around their mean Y Variation attributable to factors other than the relationship between X and Y SSR = regression sum of squares n Yandell – Econ 216 Explained variation attributable to the relationship between X and Y Chap 13 -33
Explained and Unexplained Variation (continued) Y Yi SSE = (Yi - Yi )2 _ Y y SST = (Yi - Y)2 _ _ SSR = (Yi - Y)2 Y Xi Yandell – Econ 216 _ Y X Chap 13 -34
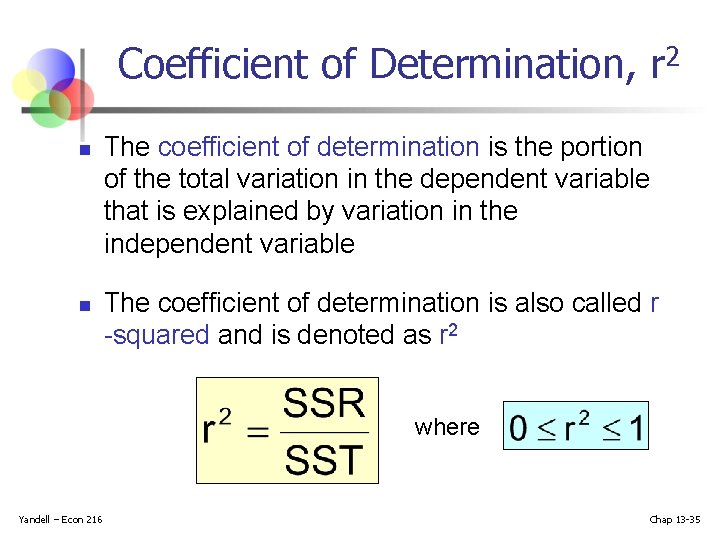
Coefficient of Determination, r 2 n n The coefficient of determination is the portion of the total variation in the dependent variable that is explained by variation in the independent variable The coefficient of determination is also called r -squared and is denoted as r 2 where Yandell – Econ 216 Chap 13 -35
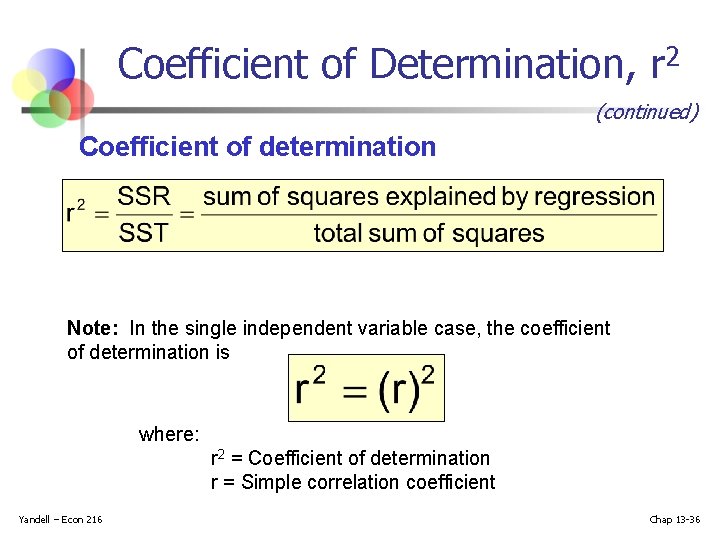
Coefficient of Determination, r 2 (continued) Coefficient of determination Note: In the single independent variable case, the coefficient of determination is where: r 2 = Coefficient of determination r = Simple correlation coefficient Yandell – Econ 216 Chap 13 -36
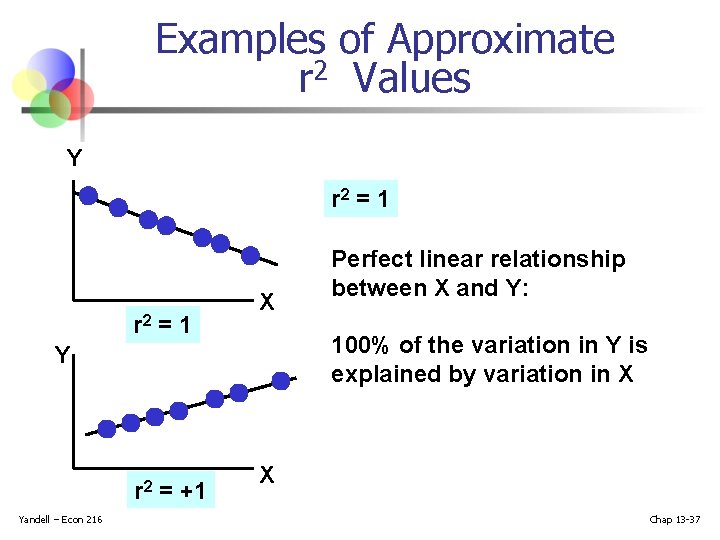
Examples of Approximate r 2 Values Y r 2 = 1 X 100% of the variation in Y is explained by variation in X Y r 2 = +1 Yandell – Econ 216 Perfect linear relationship between X and Y: X Chap 13 -37
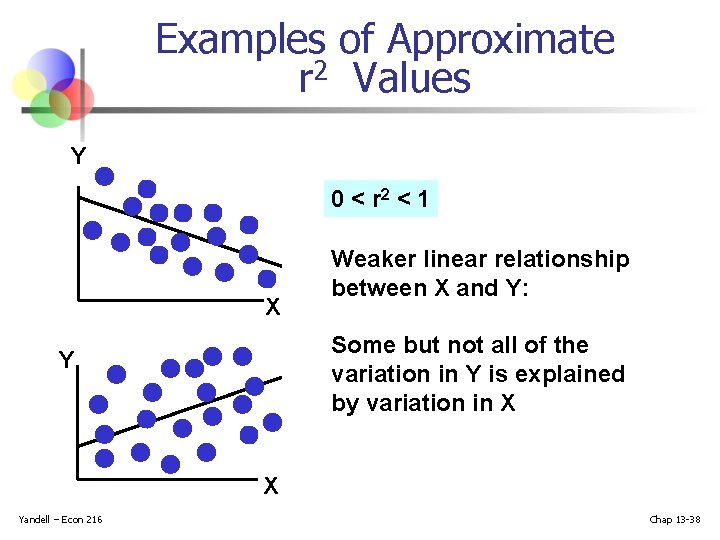
Examples of Approximate r 2 Values Y 0 < r 2 < 1 X Weaker linear relationship between X and Y: Some but not all of the variation in Y is explained by variation in X Yandell – Econ 216 Chap 13 -38
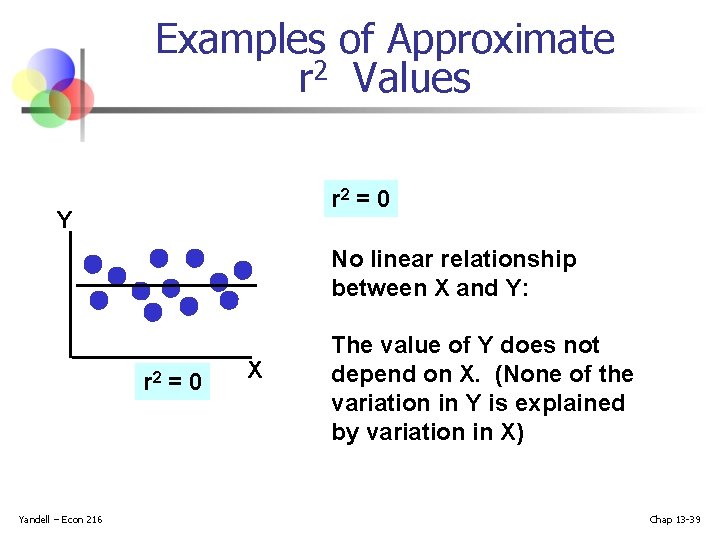
Examples of Approximate r 2 Values r 2 = 0 Y No linear relationship between X and Y: r 2 = 0 Yandell – Econ 216 X The value of Y does not depend on X. (None of the variation in Y is explained by variation in X) Chap 13 -39
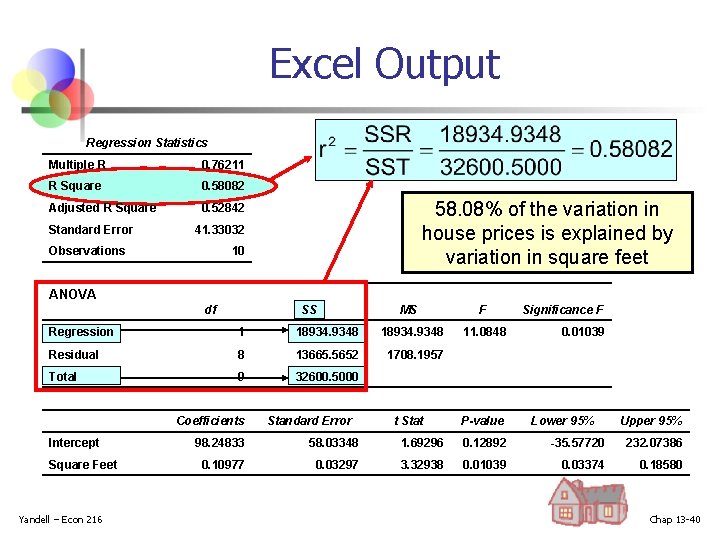
Excel Output Regression Statistics Multiple R 0. 76211 R Square 0. 58082 Adjusted R Square 0. 52842 Standard Error 58. 08% of the variation in house prices is explained by variation in square feet 41. 33032 Observations 10 ANOVA df SS MS Regression 1 18934. 9348 Residual 8 13665. 5652 1708. 1957 Total 9 32600. 5000 Intercept Square Feet Yandell – Econ 216 Coefficients Standard Error F 11. 0848 t Stat Significance F 0. 01039 P-value Lower 95% Upper 95% 98. 24833 58. 03348 1. 69296 0. 12892 -35. 57720 232. 07386 0. 10977 0. 03297 3. 32938 0. 01039 0. 03374 0. 18580 Chap 13 -40
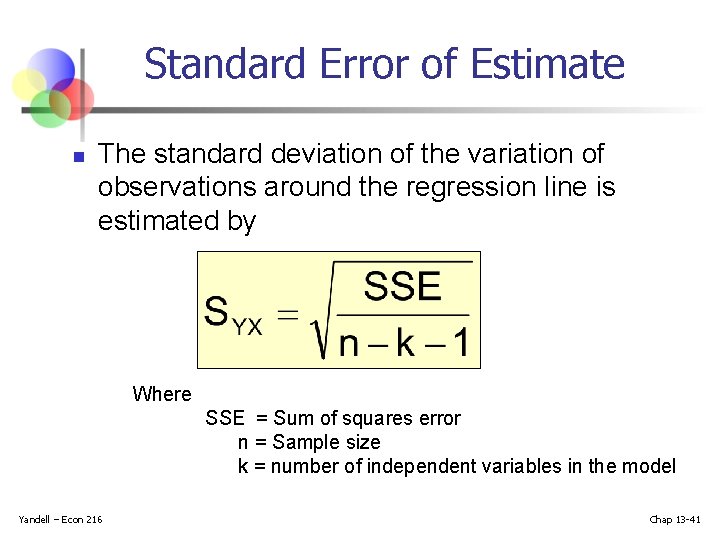
Standard Error of Estimate n The standard deviation of the variation of observations around the regression line is estimated by Where SSE = Sum of squares error n = Sample size k = number of independent variables in the model Yandell – Econ 216 Chap 13 -41
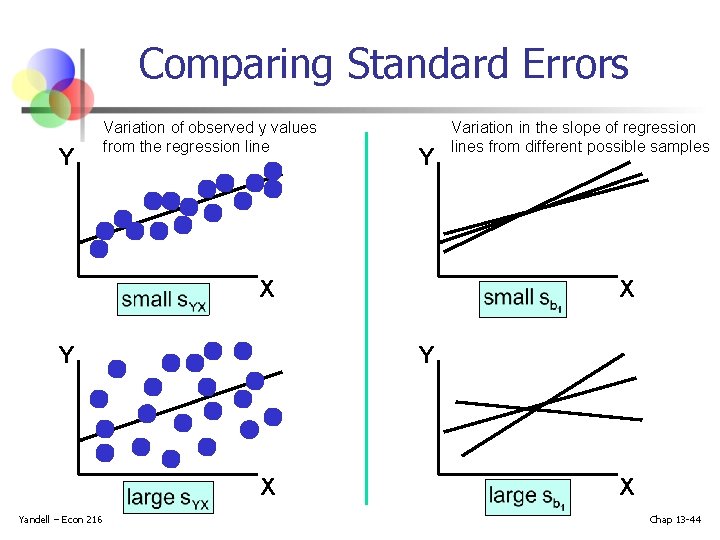
The Standard Deviation of the Regression Slope n The standard error of the regression slope coefficient (b 1) is estimated by where: = Estimate of the standard error of the least squares slope = Sample standard error of the estimate Yandell – Econ 216 Chap 13 -42
Excel Output Regression Statistics Multiple R 0. 76211 R Square 0. 58082 Adjusted R Square 0. 52842 Standard Error 41. 33032 Observations 10 ANOVA df SS MS Regression 1 18934. 9348 Residual 8 13665. 5652 1708. 1957 Total 9 32600. 5000 Intercept Square Feet Yandell – Econ 216 Coefficients Standard Error F 11. 0848 t Stat Significance F 0. 01039 P-value Lower 95% Upper 95% 98. 24833 58. 03348 1. 69296 0. 12892 -35. 57720 232. 07386 0. 10977 0. 03297 3. 32938 0. 01039 0. 03374 0. 18580 Chap 13 -43
Comparing Standard Errors Y Variation of observed y values from the regression line Y X Y X Yandell – Econ 216 Variation in the slope of regression lines from different possible samples X Chap 13 -44
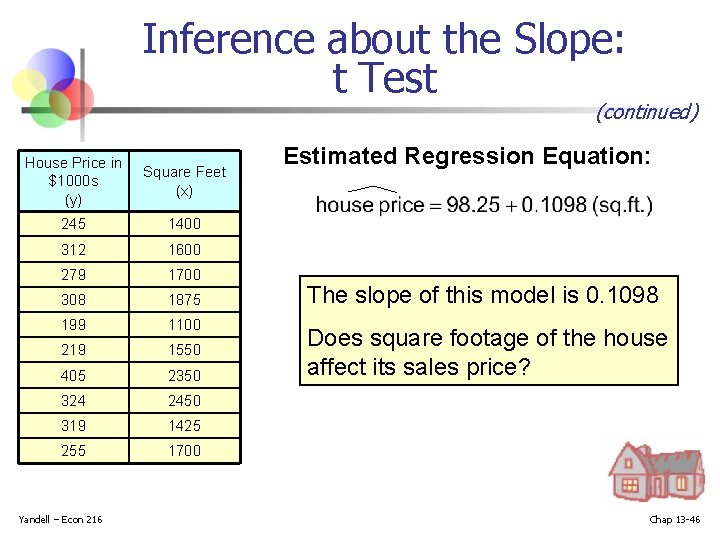
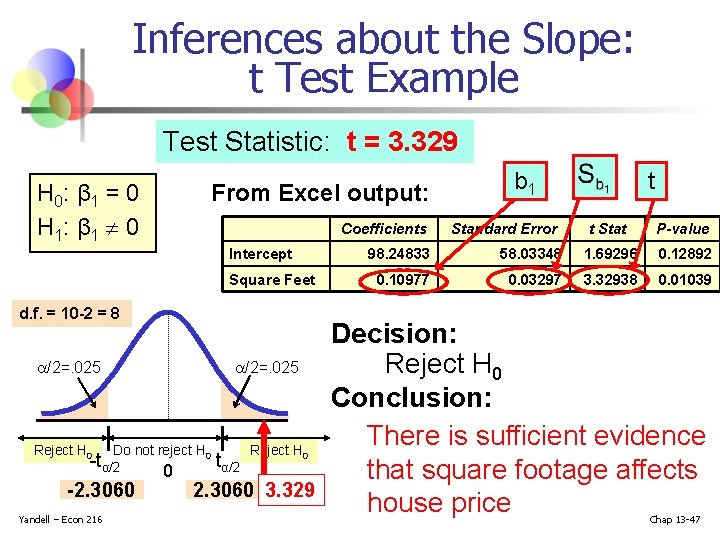
Inference about the Slope: t Test n t test for a population slope n n Is there a linear relationship between X and Y? Null and alternative hypotheses H 0: β 1 = 0 H 1: β 1 0 n (no linear relationship) (linear relationship does exist) Test statistic where: b 1 = Sample regression slope coefficient β 1 = Hypothesized slope Sb 1 = Estimator of the standard error of the slope Yandell – Econ 216 Chap 13 -45
Inference about the Slope: t Test (continued) House Price in $1000 s (y) Square Feet (x) 245 1400 312 1600 279 1700 308 1875 199 1100 219 1550 405 2350 324 2450 319 1425 255 1700 Yandell – Econ 216 Estimated Regression Equation: The slope of this model is 0. 1098 Does square footage of the house affect its sales price? Chap 13 -46
Inferences about the Slope: t Test Example Test Statistic: t = 3. 329 H 0: β 1 = 0 H 1: β 1 0 From Excel output: Intercept Square Feet d. f. = 10 -2 = 8 a/2=. 025 Reject H 0 a/2=. 025 Do not reject H 0 -tα/2 -2. 3060 Yandell – Econ 216 0 Reject H 0 tα/2 2. 3060 3. 329 Coefficients b 1 Standard Error t t Stat P-value 98. 24833 58. 03348 1. 69296 0. 12892 0. 10977 0. 03297 3. 32938 0. 01039 Decision: Reject H 0 Conclusion: There is sufficient evidence that square footage affects house price Chap 13 -47
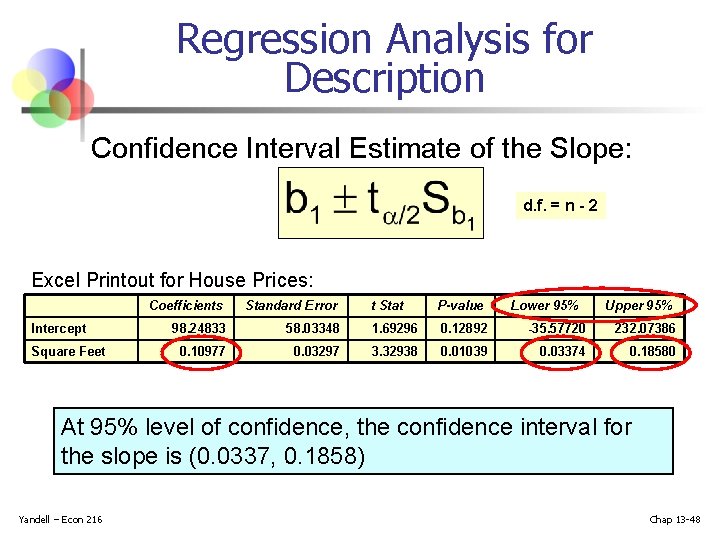
Regression Analysis for Description Confidence Interval Estimate of the Slope: d. f. = n - 2 Excel Printout for House Prices: Coefficients Standard Error Intercept 98. 24833 0. 10977 Square Feet t Stat P-value Lower 95% Upper 95% 58. 03348 1. 69296 0. 12892 -35. 57720 232. 07386 0. 03297 3. 32938 0. 01039 0. 03374 0. 18580 At 95% level of confidence, the confidence interval for the slope is (0. 0337, 0. 1858) Yandell – Econ 216 Chap 13 -48
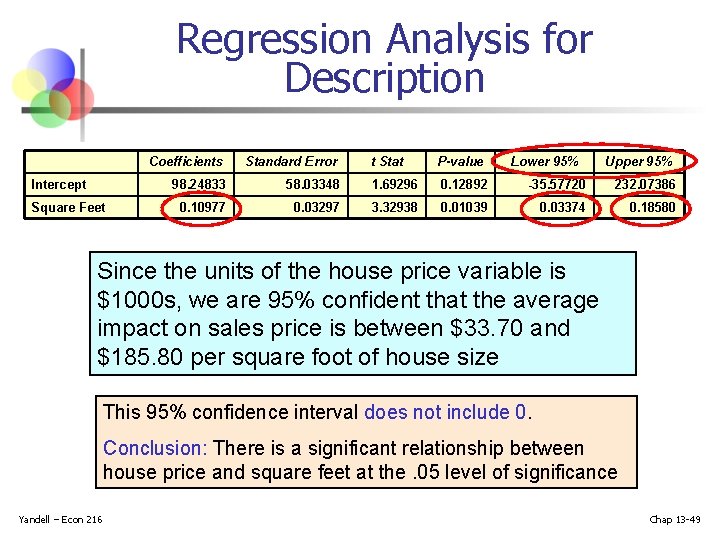
Regression Analysis for Description Coefficients Standard Error Intercept 98. 24833 0. 10977 Square Feet t Stat P-value Lower 95% Upper 95% 58. 03348 1. 69296 0. 12892 -35. 57720 232. 07386 0. 03297 3. 32938 0. 01039 0. 03374 0. 18580 Since the units of the house price variable is $1000 s, we are 95% confident that the average impact on sales price is between $33. 70 and $185. 80 per square foot of house size This 95% confidence interval does not include 0. Conclusion: There is a significant relationship between house price and square feet at the. 05 level of significance Yandell – Econ 216 Chap 13 -49
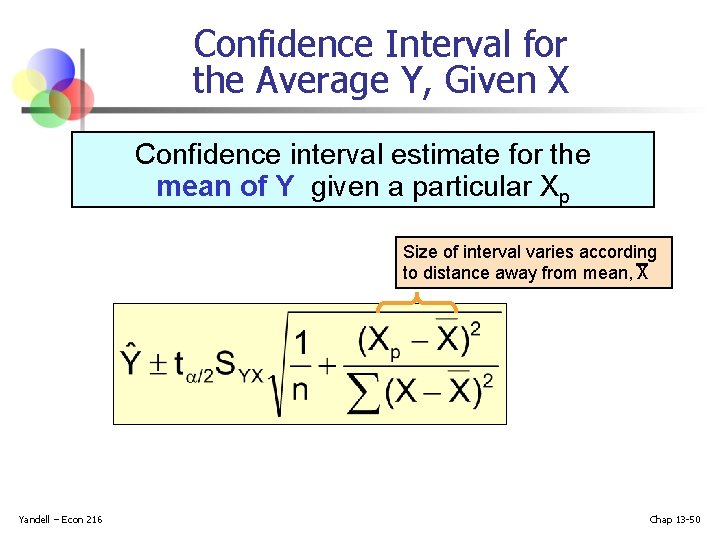
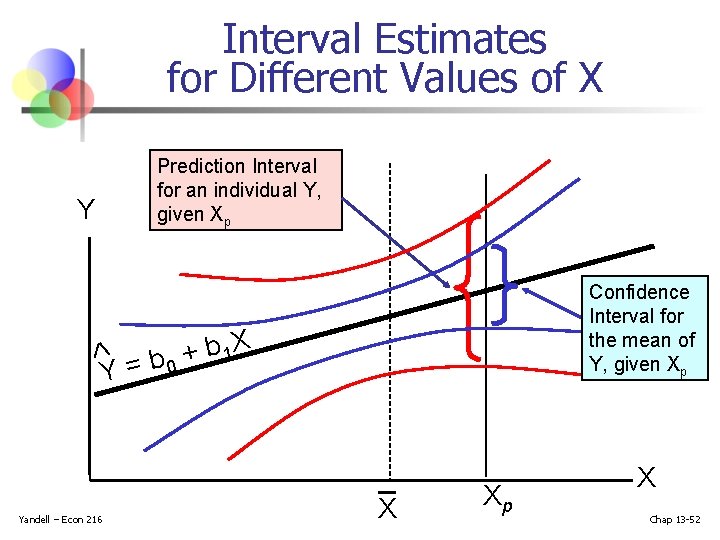
Confidence Interval for the Average Y, Given X Confidence interval estimate for the mean of Y given a particular Xp Size of interval varies according to distance away from mean, X Yandell – Econ 216 Chap 13 -50
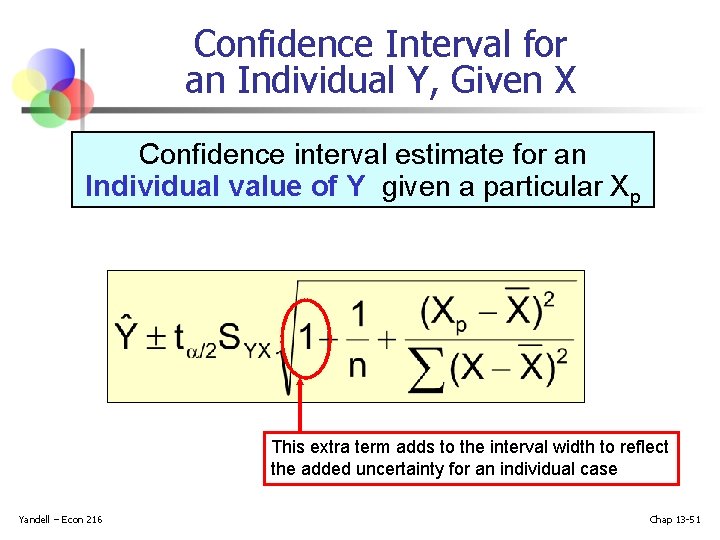
Confidence Interval for an Individual Y, Given X Confidence interval estimate for an Individual value of Y given a particular Xp This extra term adds to the interval width to reflect the added uncertainty for an individual case Yandell – Econ 216 Chap 13 -51
Interval Estimates for Different Values of X Y Prediction Interval for an individual Y, given Xp Confidence Interval for the mean of Y, given Xp b + b 1 X Y= 0 Yandell – Econ 216 X Xp X Chap 13 -52
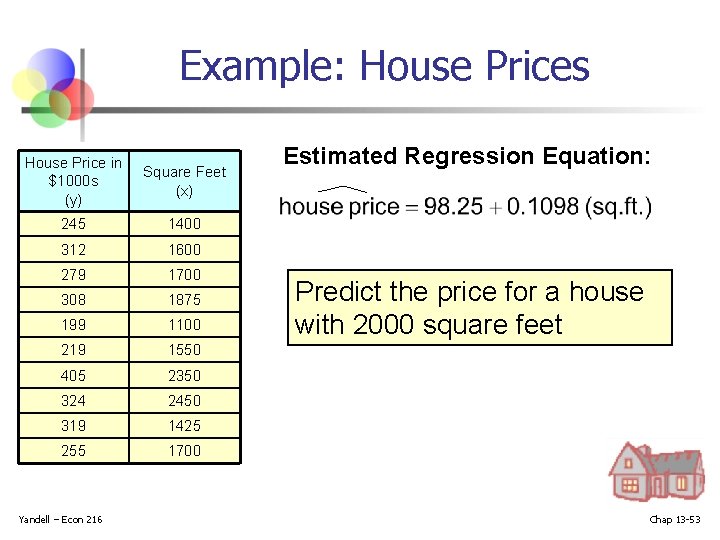
Example: House Prices House Price in $1000 s (y) Square Feet (x) 245 1400 312 1600 279 1700 308 1875 199 1100 219 1550 405 2350 324 2450 319 1425 255 1700 Yandell – Econ 216 Estimated Regression Equation: Predict the price for a house with 2000 square feet Chap 13 -53
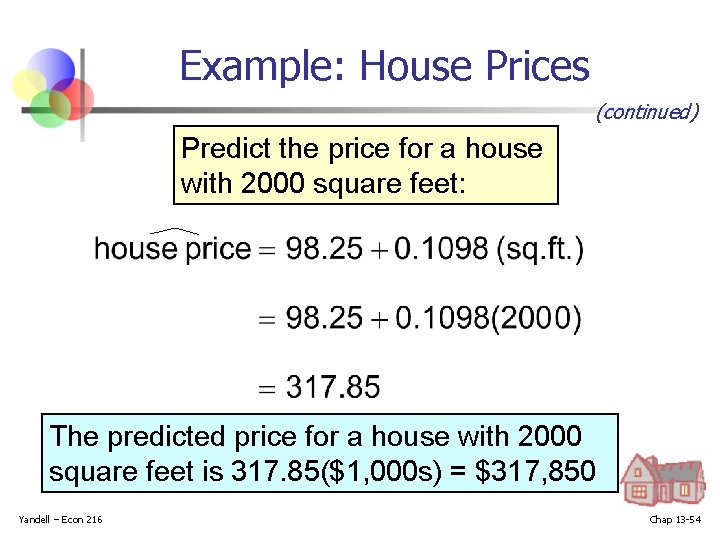
Example: House Prices (continued) Predict the price for a house with 2000 square feet: The predicted price for a house with 2000 square feet is 317. 85($1, 000 s) = $317, 850 Yandell – Econ 216 Chap 13 -54
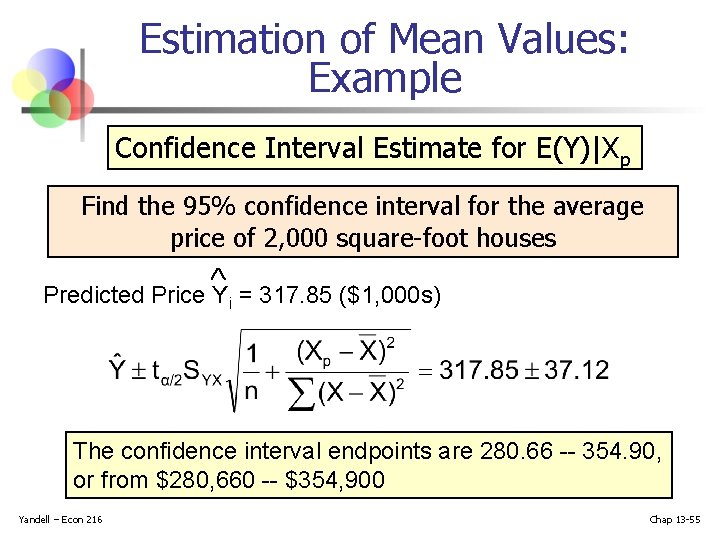
Estimation of Mean Values: Example Confidence Interval Estimate for E(Y)|Xp Find the 95% confidence interval for the average price of 2, 000 square-foot houses Predicted Price Yi = 317. 85 ($1, 000 s) The confidence interval endpoints are 280. 66 -- 354. 90, or from $280, 660 -- $354, 900 Yandell – Econ 216 Chap 13 -55
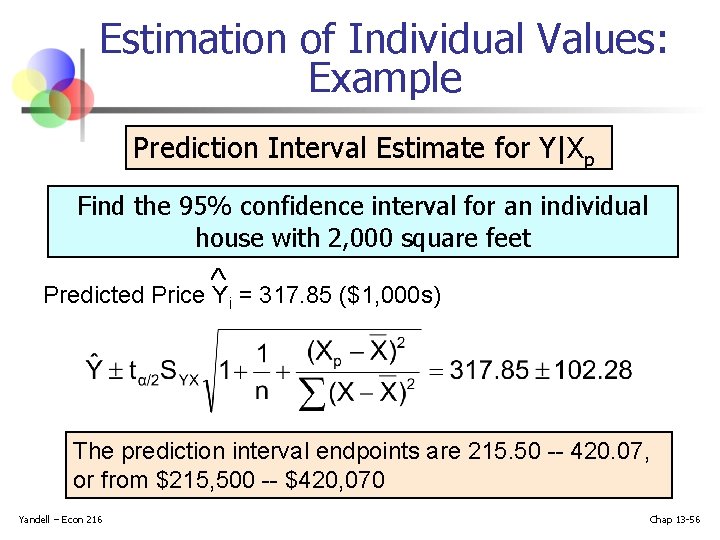
Estimation of Individual Values: Example Prediction Interval Estimate for Y|Xp Find the 95% confidence interval for an individual house with 2, 000 square feet Predicted Price Yi = 317. 85 ($1, 000 s) The prediction interval endpoints are 215. 50 -- 420. 07, or from $215, 500 -- $420, 070 Yandell – Econ 216 Chap 13 -56
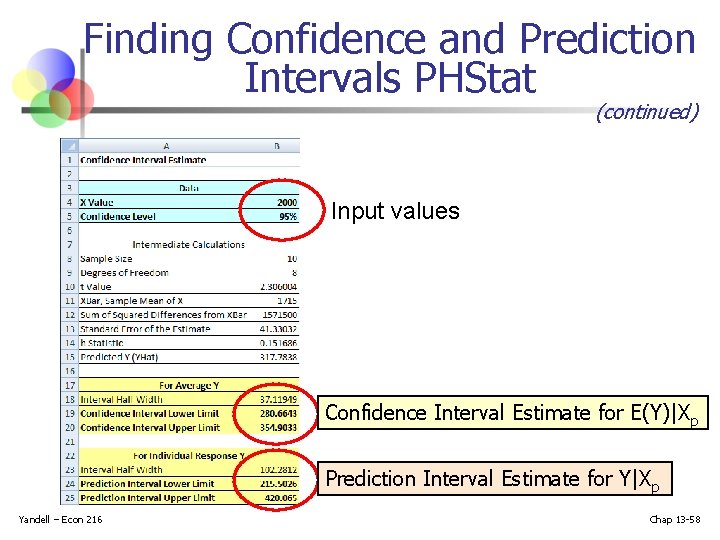
Finding Confidence and Prediction Intervals PHStat n In Excel, use PHStat | regression | simple linear regression … n Check the “confidence and prediction interval for X=” box and enter the X-value and confidence level desired Yandell – Econ 216 Chap 13 -57
Finding Confidence and Prediction Intervals PHStat (continued) Input values Confidence Interval Estimate for E(Y)|Xp Prediction Interval Estimate for Y|Xp Yandell – Econ 216 Chap 13 -58
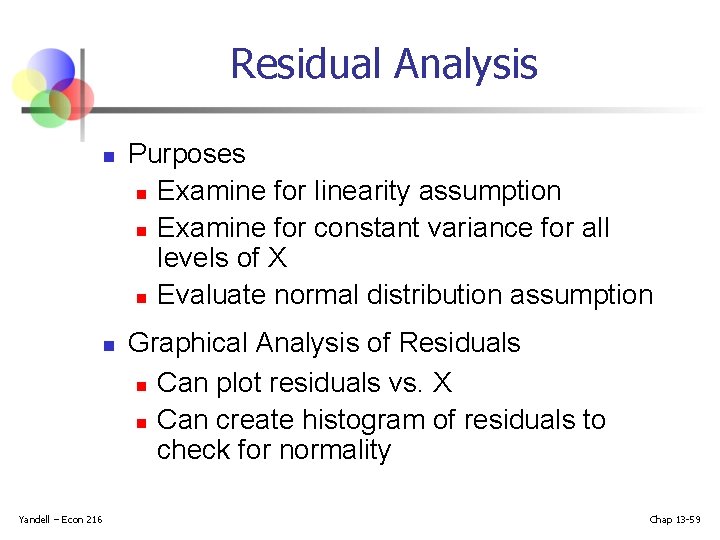
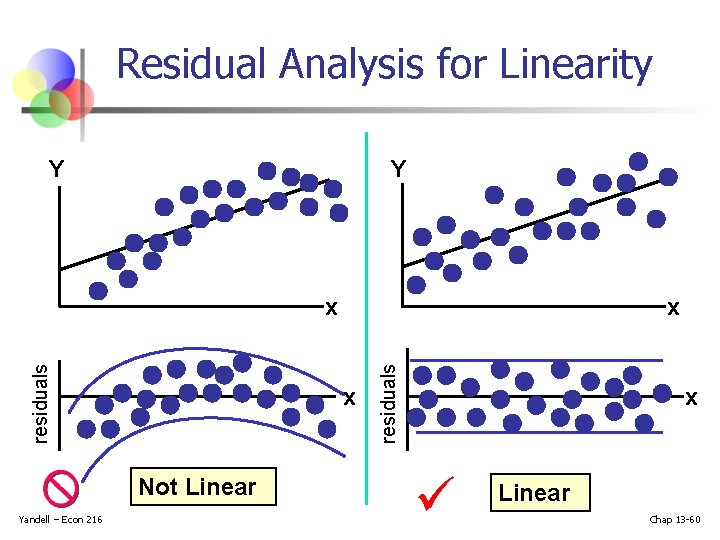
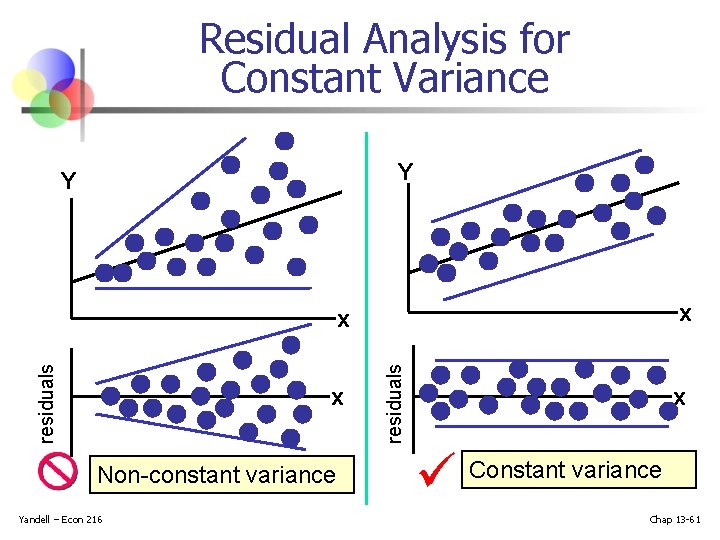
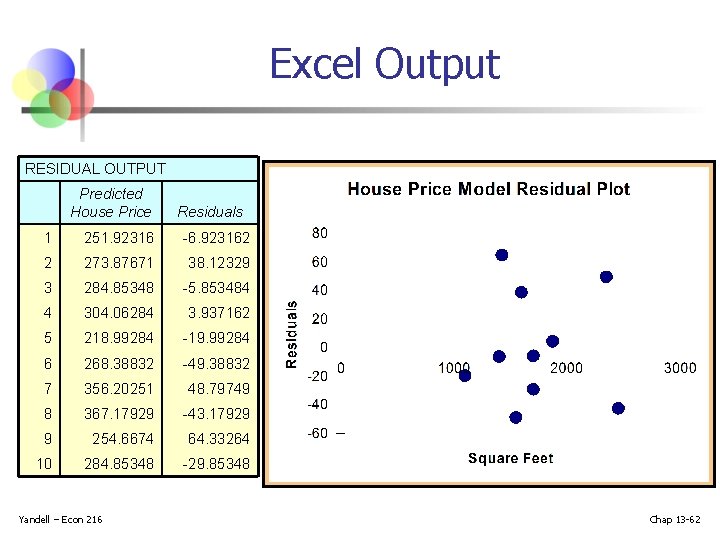
Residual Analysis n n Yandell – Econ 216 Purposes n Examine for linearity assumption n Examine for constant variance for all levels of X n Evaluate normal distribution assumption Graphical Analysis of Residuals n Can plot residuals vs. X n Can create histogram of residuals to check for normality Chap 13 -59
Residual Analysis for Linearity Y Y x Not Linear Yandell – Econ 216 x residuals x x Linear Chap 13 -60
Residual Analysis for Constant Variance Y Y x x Non-constant variance Yandell – Econ 216 residuals x x Constant variance Chap 13 -61
Excel Output RESIDUAL OUTPUT Predicted House Price Residuals 1 251. 92316 -6. 923162 2 273. 87671 38. 12329 3 284. 85348 -5. 853484 4 304. 06284 3. 937162 5 218. 99284 -19. 99284 6 268. 38832 -49. 38832 7 356. 20251 48. 79749 8 367. 17929 -43. 17929 9 254. 6674 64. 33264 10 284. 85348 -29. 85348 Yandell – Econ 216 Chap 13 -62
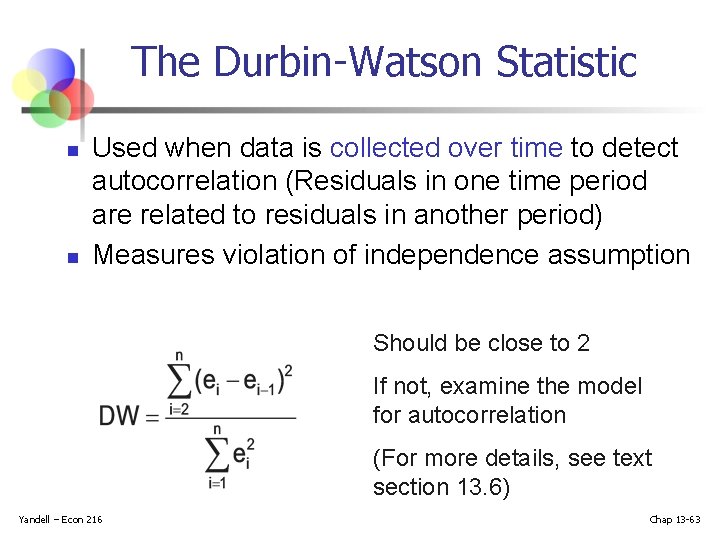
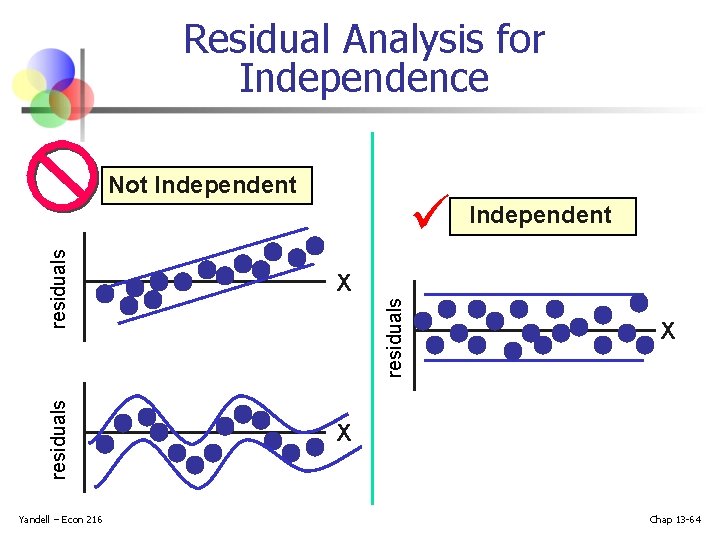
The Durbin-Watson Statistic n n Used when data is collected over time to detect autocorrelation (Residuals in one time period are related to residuals in another period) Measures violation of independence assumption Should be close to 2 If not, examine the model for autocorrelation (For more details, see text section 13. 6) Yandell – Econ 216 Chap 13 -63
Residual Analysis for Independence Not Independent X Yandell – Econ 216 residuals X residuals Independent X Chap 13 -64
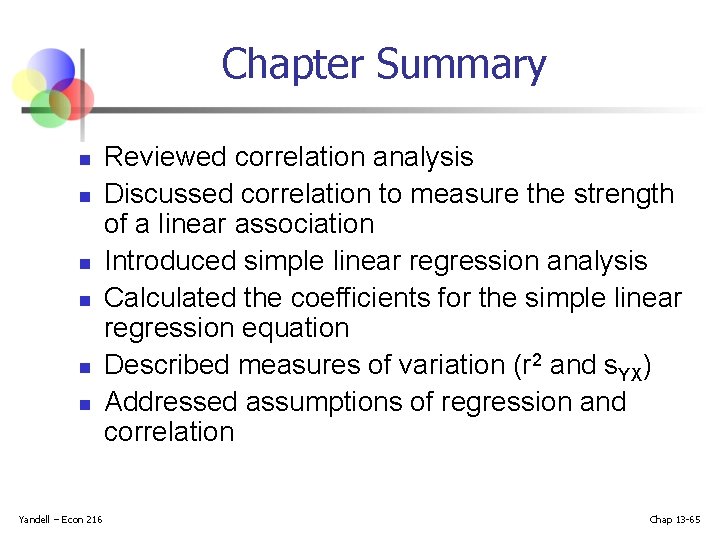
Chapter Summary n n n Yandell – Econ 216 Reviewed correlation analysis Discussed correlation to measure the strength of a linear association Introduced simple linear regression analysis Calculated the coefficients for the simple linear regression equation Described measures of variation (r 2 and s. YX) Addressed assumptions of regression and correlation Chap 13 -65
Chapter Summary (continued) n n n Yandell – Econ 216 Described inference about the slope Addressed estimation of mean values and prediction of individual values Discussed residual analysis Chap 13 -66
Regression Demonstrations Using PHStat Click here to see a regression demonstration using PHStat (Part 1) Click here to see a regression demonstration using PHStat (Part 2) Yandell – Econ 216 Chap 13 -67