CHAPTER 13 RETURN RISK AND THE SECURITY MARKET


- Slides: 34
CHAPTER 13 RETURN, RISK, AND THE SECURITY MARKET LINE Copyright © 2016 by Mc. Graw-Hill Global Education LLC. All rights reserved.
EXPECTED RETURNS • Expected returns are based on the probabilities of possible outcomes • In this context, “expected” means average if the process is repeated many times • The “expected” return does not even have to be a possible return Copyright © 2016 by Mc. Graw-Hill Global Education LLC. All rights reserved. 13 -2
EXAMPLE: EXPECTED RETURNS • Suppose you have predicted the following returns for stocks C and T in three possible states of the economy. What are the expected returns? State Boom Normal Recession Probability 0. 3 0. 5 ? ? ? C 0. 15 0. 10 0. 02 T___ 0. 25 0. 20 0. 01 • RC =. 3(15) +. 5(10) +. 2(2) = 9. 9% • RT =. 3(25) +. 5(20) +. 2(1) = 17. 7% Copyright © 2016 by Mc. Graw-Hill Global Education LLC. All rights reserved. 13 -3
VARIANCE AND STANDARD DEVIATION • Variance and standard deviation measure the volatility of returns • Using unequal probabilities for the entire range of possibilities • Weighted average of squared deviations Copyright © 2016 by Mc. Graw-Hill Global Education LLC. All rights reserved. 13 -4
EXAMPLE: VARIANCE AND STANDARD DEVIATION • Consider the previous example. What are the variance and standard deviation for each stock? • Stock C § 2 =. 3(0. 15 -0. 099)2 +. 5(0. 10 -0. 099)2 +. 2(0. 02 -0. 099)2 = 0. 002029 § = 4. 50% • Stock T § 2 =. 3(0. 25 -0. 177)2 +. 5(0. 20 -0. 177)2 +. 2(0. 01 -0. 177)2 = 0. 007441 § = 8. 63% Copyright © 2016 by Mc. Graw-Hill Global Education LLC. All rights reserved. 13 -5
ANOTHER EXAMPLE • Consider the following information: State Boom Normal Slowdown. 15 Recession. 10 Probability. 25. 50 ABC, Inc. Return 0. 15 0. 08 0. 04 -0. 03 • What is the expected return? • What is the variance? • What is the standard deviation? Copyright © 2016 by Mc. Graw-Hill Global Education LLC. All rights reserved. 13 -6
PORTFOLIOS • A portfolio is a collection of assets • An asset’s risk and return are important in how they affect the risk and return of the portfolio • The risk-return trade-off for a portfolio is measured by the portfolio expected return and standard deviation, just as with individual assets Copyright © 2016 by Mc. Graw-Hill Global Education LLC. All rights reserved. 13 -7
EXAMPLE: PORTFOLIO WEIGHTS • Suppose you have $15, 000 to invest and you have purchased securities in the following amounts. What are your portfolio weights in each security? § $2000 of C § $3000 of KO § $4000 of INTC § $6000 of BP § § C: 2/15 =. 133 KO: 3/15 =. 2 INTC: 4/15 =. 267 BP: 6/15 =. 4 Copyright © 2016 by Mc. Graw-Hill Global Education LLC. All rights reserved. 13 -8
PORTFOLIO EXPECTED RETURNS • The expected return of a portfolio is the weighted average of the expected returns of the respective assets in the portfolio • You can also find the expected return by finding the portfolio return in each possible state and computing the expected value as we did with individual securities Copyright © 2016 by Mc. Graw-Hill Global Education LLC. All rights reserved. 13 -9
EXAMPLE: EXPECTED PORTFOLIO RETURNS • Consider the portfolio weights computed previously. If the individual stocks have the following expected returns, what is the expected return for the portfolio? § § C: 19. 69% KO: 5. 25% INTC: 16. 65% BP: 18. 24% • E(RP) =. 133(19. 69%) +. 2(5. 25%). 267(16. 65%) +. 4(18. 24%) = 15. 41% Copyright © 2016 by Mc. Graw-Hill Global Education LLC. All rights reserved. + 13 -10
PORTFOLIO VARIANCE • Compute the portfolio return for each state: R P = w 1 R 1 + w 2 R 2 + … + w m. R m • Compute the expected portfolio return using the same formula as for an individual asset • Compute the portfolio variance and standard deviation using the same formulas as for an individual asset Copyright © 2016 by Mc. Graw-Hill Global Education LLC. All rights reserved. 13 -11
EXAMPLE: PORTFOLIO VARIANCE • Consider the following information on returns and probabilities: § Invest 50% of your money in Asset A State Boom Bust Probability. 4. 6 A 30% -10% B -5% 25% Portfolio 12. 5% 7. 5% • What are the expected return and standard deviation for each asset? • What are the expected return and standard deviation for the portfolio? Copyright © 2016 by Mc. Graw-Hill Global Education LLC. All rights reserved. 13 -12
ANOTHER EXAMPLE • Consider the following information on returns and probabilities: State Boom Normal Recession. 15 Probability. 25. 60 5% X 15% 10% Z 10% 9% 10% • What are the expected return and standard deviation for a portfolio with an investment of $6, 000 in asset X and $4, 000 in asset Z? Copyright © 2016 by Mc. Graw-Hill Global Education LLC. All rights reserved. 13 -13
EXPECTED VS. UNEXPECTED RETURNS • Realized returns are generally not equal to expected returns • There is the expected component and the unexpected component § At any point in time, the unexpected return can be either positive or negative § Over time, the average of the unexpected component is zero Copyright © 2016 by Mc. Graw-Hill Global Education LLC. All rights reserved. 13 -14
SYSTEMATIC RISK • Risk factors that affect a large number of assets • Also known as non-diversifiable risk or market risk • Includes such things as changes in GDP, inflation, interest rates, etc. Copyright © 2016 by Mc. Graw-Hill Global Education LLC. All rights reserved. 13 -15
UNSYSTEMATIC RISK • Risk factors that affect a limited number of assets • Also known as unique risk and asset-specific risk • Includes such things as labor strikes, part shortages, etc. Copyright © 2016 by Mc. Graw-Hill Global Education LLC. All rights reserved. 13 -16
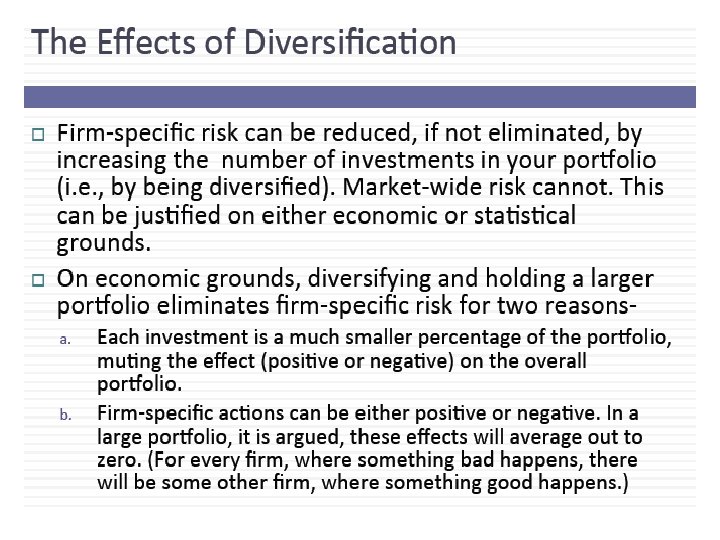
DIVERSIFICATION • Portfolio diversification is the investment in several different asset classes or sectors • Diversification is not just holding a lot of assets • For example, if you own 50 Internet stocks, you are not diversified • However, if you own 50 stocks that span 20 different industries, then you are diversified Copyright © 2016 by Mc. Graw-Hill Global Education LLC. All rights reserved. 13 -18
THE PRINCIPLE OF DIVERSIFICATION • Diversification can substantially reduce the variability of returns without an equivalent reduction in expected returns • This reduction in risk arises because worse than expected returns from one asset are offset by better than expected returns from another • However, there is a minimum level of risk that cannot be diversified away and that is the systematic portion Copyright © 2016 by Mc. Graw-Hill Global Education LLC. All rights reserved. 13 -19
FIGURE 13. 1 Copyright © 2016 by Mc. Graw-Hill Global Education LLC. All rights reserved. 13 -20
TOTAL VS. SYSTEMATIC RISK • Consider the following information: Standard Deviation Beta Security C 20% Security K 1. 25 30% 0. 95 • Which security has more total risk? • Which security has more systematic risk? • Which security should have the higher expected return? Copyright © 2016 by Mc. Graw-Hill Global Education LLC. All rights reserved. 13 -33
EXAMPLE: PORTFOLIO BETAS • Consider the previous example with the following four securities Security C KO INTC BP Weight Beta. 133. 2. 267. 4 2. 685 0. 195 2. 161 2. 434 • What is the portfolio beta? • . 133(2. 685) +. 2(. 195) +. 267(2. 161) +. 4(2. 434) = 1. 947 Copyright © 2016 by Mc. Graw-Hill Global Education LLC. All rights reserved. 13 -34