
Chapter 13 Capital Structure Management in Practice Copyright
- Slides: 17
Chapter 13 Capital Structure Management in Practice Copyright © 2003 South-Western/Thomson Learning
Introduction • This chapter focuses on tools of analysis that can assist managers in making capital structure decisions that will lead to a maximization of shareholder wealth. • It develops techniques, derived from accounting data, for measuring operating and financial leverage.
Operating and Financial Leverage • From fixed operating or fixed capital costs • Operating costs – Costs of sales – General & administrative costs • Capital costs – Interest charges – Preferred dividends – Income taxes
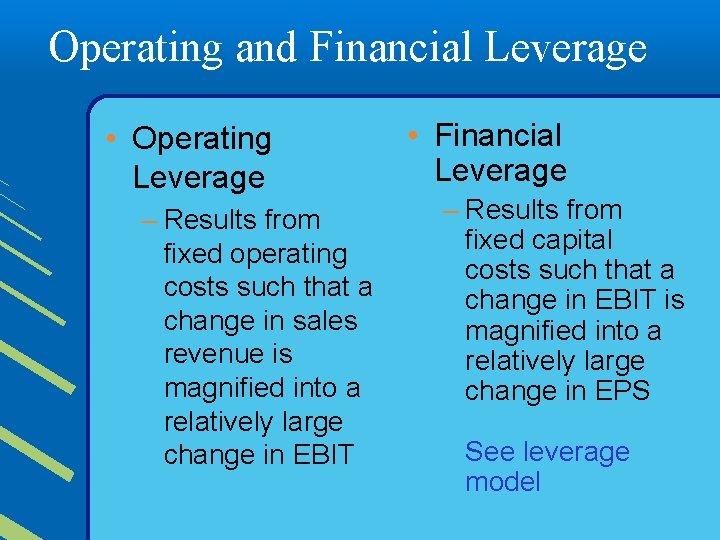
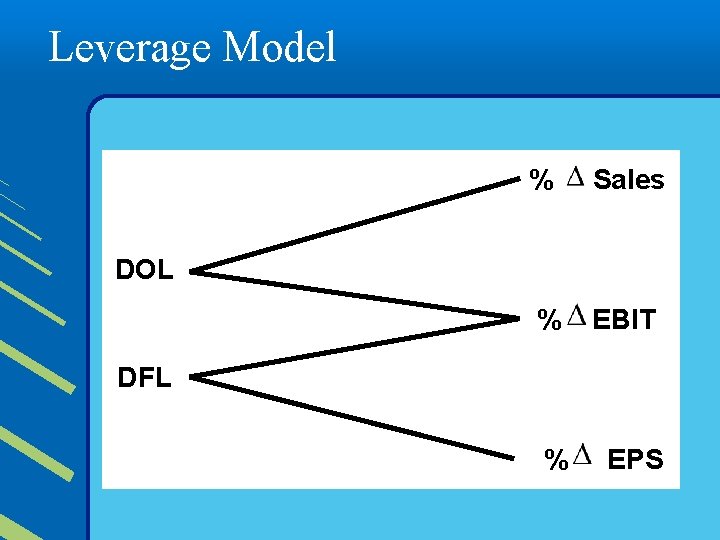
Operating and Financial Leverage • Operating Leverage – Results from fixed operating costs such that a change in sales revenue is magnified into a relatively large change in EBIT • Financial Leverage – Results from fixed capital costs such that a change in EBIT is magnified into a relatively large change in EPS See leverage model
Leverage Model % Sales % EBIT % EPS DOL DFL
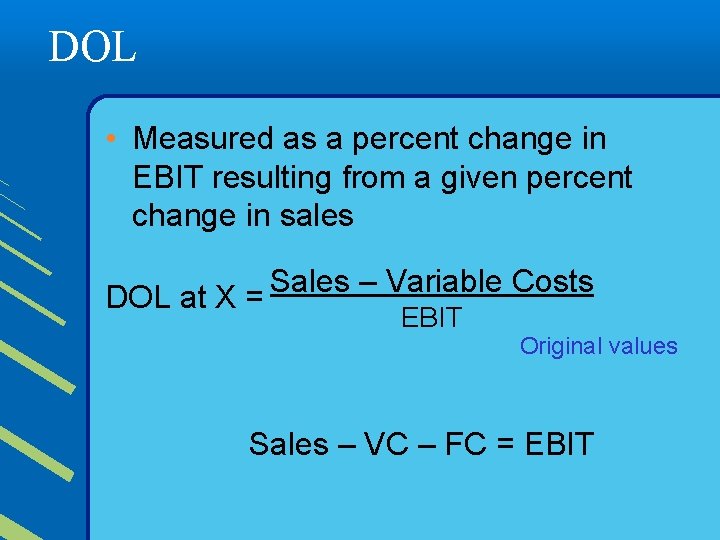
DOL • Measured as a percent change in EBIT resulting from a given percent change in sales DOL at X = Sales – Variable Costs EBIT Original values Sales – VC – FC = EBIT
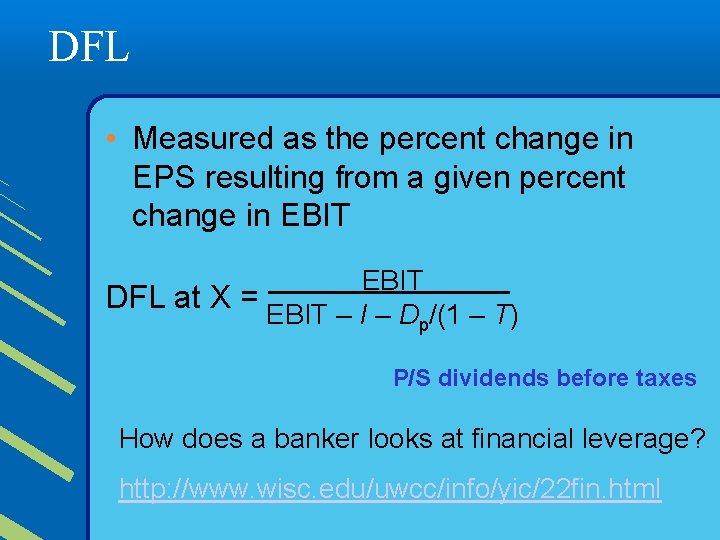
DFL • Measured as the percent change in EPS resulting from a given percent change in EBIT DFL at X = EBIT – I – D /(1 – T) p P/S dividends before taxes How does a banker looks at financial leverage? http: //www. wisc. edu/uwcc/info/yic/22 fin. html
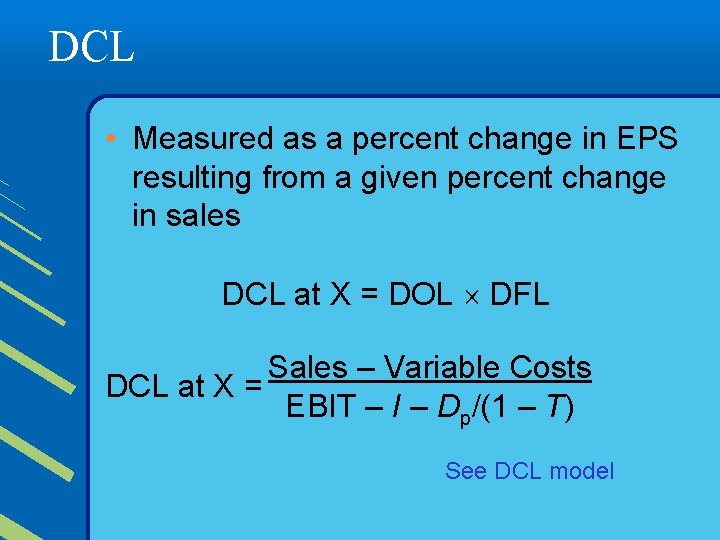
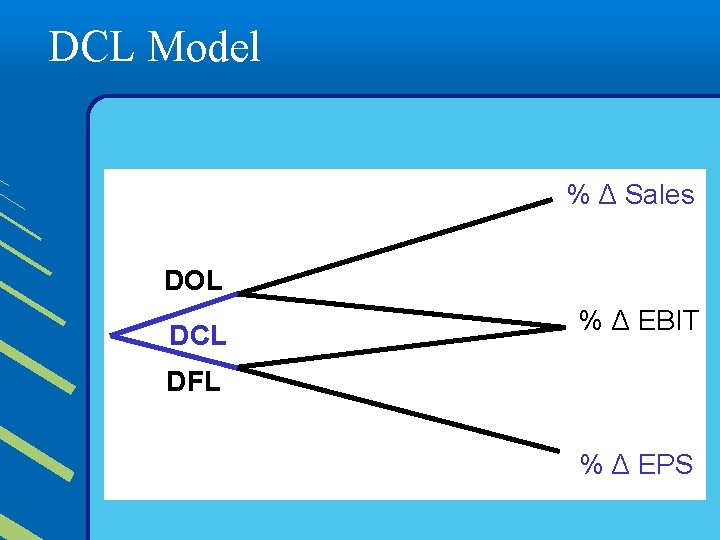
DCL • Measured as a percent change in EPS resulting from a given percent change in sales DCL at X = DOL DFL Sales – Variable Costs DCL at X = EBIT – I – Dp/(1 – T) See DCL model
DCL Model % Δ Sales DOL DCL % Δ EBIT DFL % Δ EPS
DOL & DFL Trade Off • A firm can trade off operating and financial leverage to control DCL. • A firm with a high DOL may choose a capital structure with a low DFL to avoid a high DCL.
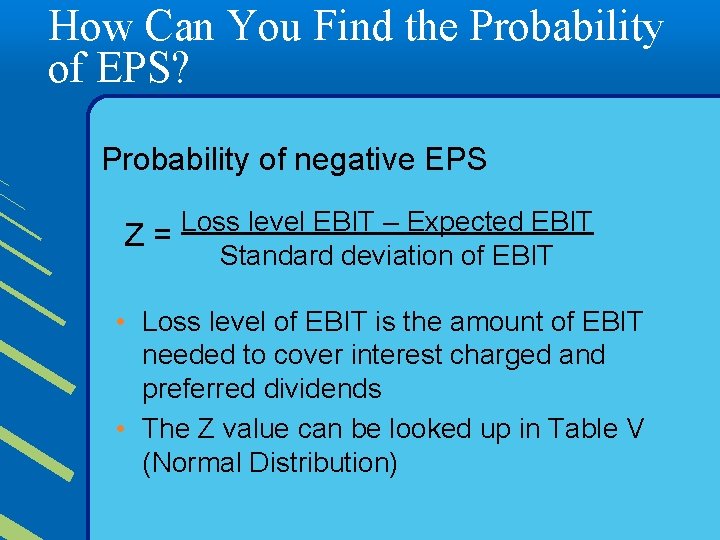
How Can You Find the Probability of EPS? Probability of negative EPS Loss level EBIT – Expected EBIT Z= Standard deviation of EBIT • Loss level of EBIT is the amount of EBIT needed to cover interest charged and preferred dividends • The Z value can be looked up in Table V (Normal Distribution)
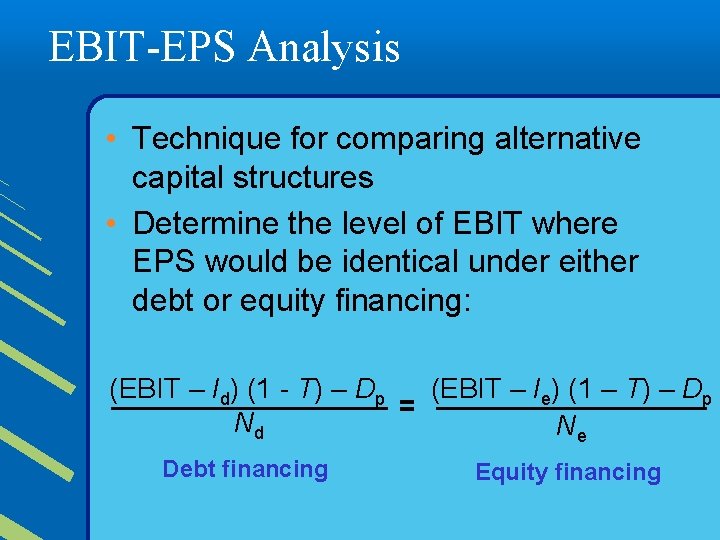
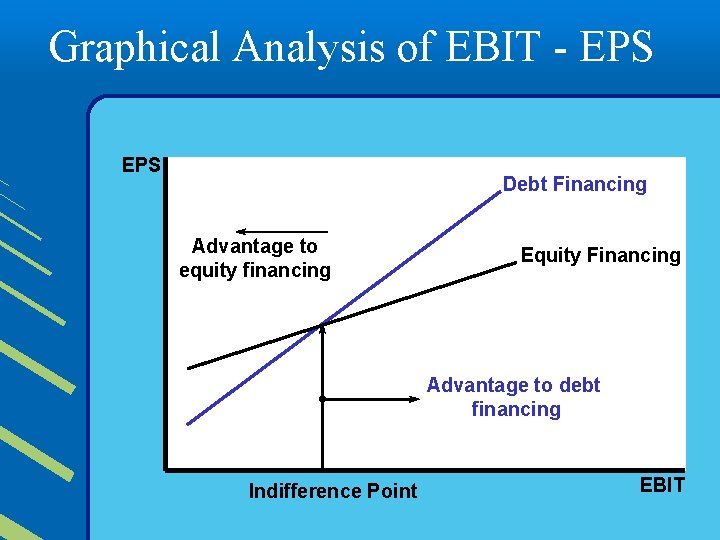
EBIT-EPS Analysis • Technique for comparing alternative capital structures • Determine the level of EBIT where EPS would be identical under either debt or equity financing: (EBIT – Id) (1 - T) – Dp (EBIT – Ie) (1 – T) – Dp = Nd Ne Debt financing Equity financing
Graphical Analysis of EBIT - EPS Debt Financing Advantage to equity financing Equity Financing Advantage to debt financing Indifference Point EBIT
Analyze the Riskiness of the Capital Structure • Compute the expected level of EBIT after expansion. • Estimate the variability of operating income. • Compute the indifference point between two financing plans. • Estimate the probability that EBIT will exceed the indifference point.
Analyze the Riskiness of the Capital Structure • Examine the market evidence to see if the capital structure is too risky in relation to the firm’s level of – Business risk – Industry norms for leverage and coverage ratios – Recommendation of the firm’s investment bankers • Check out the glossary of risk management terms at this Web site: http: //www. contingencyanalysis. com/
Cash Insolvency Analysis • Helps managers choose their capital structure during a recession when liquidity is important CBR = CB 0 + FCFR • The firm needs cash (or access to cash) to survive a recession
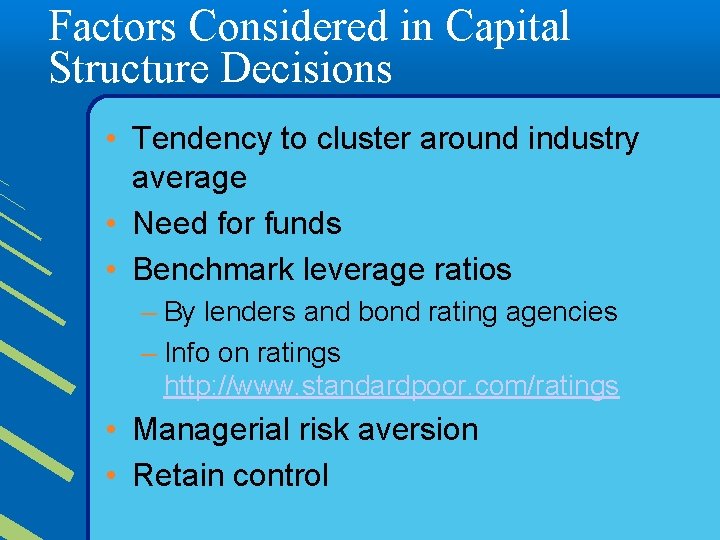
Factors Considered in Capital Structure Decisions • Tendency to cluster around industry average • Need for funds • Benchmark leverage ratios – By lenders and bond rating agencies – Info on ratings http: //www. standardpoor. com/ratings • Managerial risk aversion • Retain control