CHAPTER 12 PROJECT CASH FLOW 1 2 3


 q The projection of income and expense during")
 FIGURE 12. 1 Development of the S-curve 3")
 Profit or markup: 25% Retainage: 10%")
 q The prime rate is the")
 $250 K : Total Billed $200 K : Total")
 부족 자금 FIGURE 12. 5 Composite overdraft profiles 8")
 The IRR for a given sequence of")
 20% 25% 22% 보간법 이용 10")
 최대 신용 규모 $0 $17, 500 $37,")
 30% 32% 34% 수익률 증가 20. 45%")
- Slides: 13
CHAPTER 12 PROJECT CASH FLOW
제 1장 제 2장 제 3장 제 4장 제 5장 제 6장 제 7장 제 8장 제 9장 제 10장 제 11장 제 12장 제 13장 제 14장 제 15장 제 16장 제 17장 제 18장 제 19장 제 20장 History and Basic Concepts Preparing the Bid Package Issues During Construction Contracts Legal Structure Impact of Taxes Project Planning Project Scheduling: Program Evaluation and Review Technique Networks and Linear Operations Resource-Related and Advanced Linear Scheduling Techniques The Mathematics of Money Project Cash Flow Project Funding Equipment Ownership Equipment Productivity Construction Labor Estimating Process Cost Control Materials Management Safety
12. 1 Cash Flow Projection (1/2) q The projection of income and expense during the life of a project can be developed from several time-scheduling aids used by the contractor. 스케줄링 도구를 이용하여 프로 젝트 기간 내 발생하는 수입과 비용 추산 가능 q The owner requires the contractor to provide an S-curve of estimated progress and costs across the life of the project. 발주자는 시공사에 시간 축과 준공률 축을 갖는 S-Curve (Production curve, Objective chart) 제공을 요구 q The contractor develops this by constructing a simple bar chart of the project, assigning costs to the bars, and smoothly connecting the projected amounts of expenditures over time. 시공사는 공정별로 바차트에 비용을 할당한 후 이를 스무딩 (Smoothing)하여 S-Curve를 작성 2
12. 1 Cash Flow Projection (2/2) FIGURE 12. 1 Development of the S-curve 3
12. 2 Cash Flow to the Contractor (1/2) Profit or markup: 25% Retainage: 10% 지불유예금: 공정이 50%를 넘어서면 부과하지 않음 Pay = 1. 25(indirect expense + direct expense) − 0. 10[1. 25(indirect expense + direct expense)] = 1. 125(indirect expense + direct expense) Total Expense : $200, 000 1. 25 200 1. 25 180 – 12. 5(Retainage) Total Bid Price : $250, 000 비용 자금 부족 누적 Retainage = 125 – 112. 5 = 12. 5 1. 125 100 수입 30일 지연 지급 1. 25 30 – 0. 125 30 = 1. 125 30 = 33. 75 FIGURE 12. 2 Expenses and payments profiles 4
12. 2 Cash Flow to the Contractor (2/2) q The prime rate is the interest rate charged preferred customers who are rated as reliable and who represent an extremely small risk of default. 기본 이율: 최소의 위험을 가 진 고객에 대한 이자율 q Construction Contractor = Prime Rate + Customer Risk. 대출 이율 = 기본 이율 + 위험 할증 q 선수금, 착수금 지급: 시공자에 대한 신뢰가 있는 경우 금융비용 절감을 위해 발주자가 지급 금융비 용 절감으로 인해 원가절감 효과 발생 자금 부족 완화 금융 비용 절감 자금 부족 선수금, 착수금 동원지불 대금지급을 3개월 앞당김 FIGURE 12. 3 Influence of front (or mobilization) payment on profiles 5
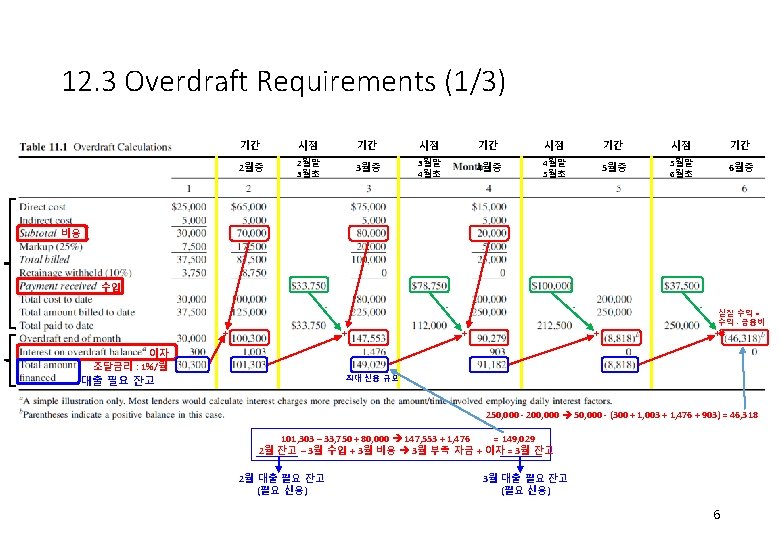
12. 3 Overdraft Requirements (2/3) $250 K : Total Billed $200 K : Total Cost $180 K : Direct Cost 수입 실질 수익 = 수익(=수입 – 지출) – 금융비용 250, 000 – 200, 000 50, 000 – (300 + 1, 003 + 1, 476 + 903) = 46, 318 자금 부족 0월말 1월초 1월말 2월초 2월말 3월초 3월말 4월초 4월말 5월초 5월말 6월초 6월말 7월초 FIGURE 12. 4 Plot of maximum overdraft 7
12. 3 Overdraft Requirements (3/3) 부족 자금 FIGURE 12. 5 Composite overdraft profiles 8
12. 4 Comparison of Payment Schemes (1/4) The IRR for a given sequence of payments and expenditures 수익률은 수익의 현재가치와 비용의 현재가치의 합을 0으로 만들어 주는 이자율 비용 + 이자 수익 FIGURE 12. 6 ROR for small bar chart problem 9
12. 4 Comparison of Payment Schemes (2/4) 20% 25% 22% 보간법 이용 10
12. 4 Comparison of Payment Schemes (3/4) 최대 신용 규모 $0 $17, 500 $37, 500 $17, 500 FIGURE 12. 7 ROR for small bar chart problem with mobilization payment : 동원 지불 $20, 000 11
12. 4 Comparison of Payment Schemes (4/4) 30% 32% 34% 수익률 증가 20. 45% 32. 62% 12