Chapter 12 Population Growth and Urbanization Myth or

Chapter 12 Population Growth and Urbanization

Myth or Fact? § The most important factor § The U. S. achieved zero population growth when in controlling world the birthrate dropped population growth is below replacement rate in technology, especially the 1970 s. contraception. § U. S. cities are segregated § Suburban growth in the U. S. began because whites and nonpeople wanted larger whites don’t want to live in homes and more land. the same neighborhoods. Myth

Studying Population § Total # of people inhabiting a particular geographic area at a specific time § Demography § Study of the size, composition and distribution of human populations § Change over time § U. S. Census § Since 1790 § Mailed for first time in 1960

Elements of Demographic Change § Fertility § Crude birth rate—the # of live births in year per 1, 000 § Fecundity—biological max # of children a woman could bear § Mortality § Crude death rate—total # of deaths a year per 1, 000 § Infant mortality—rate of death among infants under 1 year § Life Expectancy § Average # of years people expected to live § Longevity—life span § Rate of natural increase § The difference between crude birth and death rates § Migration § Permanent change of residence § Immigration—movement into a country § Emigration—movement out of a country

Global Fertility Rates 2008

Global Life Expectancy 2008

Global Infant Mortality Rates 2008

Global Migration

Population Change in the U. S. 2008

World Population Growth over 2, 000 Years

World Population Clock 2008

World Population Clock 2008

Population Projections

World Population Trends § Demographic transition § Change in patterns of birth and death rates § Due to Industrialization § Demographic gap § Gap between high birth rates and low death rates § Carrying capacity § The upper limit imposed on a population by its resources § Cannot exceed

Four Stages of Demographic Transition Preindustrial Stage High Birth Rates and High Death Rates Early Industrial Stage High Birth Rates and Declining Death Rates Industrial Stage Declining Death Rates and Declining Birth Rates Postindustrial Stage Low Birth Rates and Low Death Rates

Demographic Transition

Video Presentation: “NOVA— World in the Balance: The Population Paradox”

Perspectives on Population Growth § Functionalism § Thomas Malthus § Population boom in Europe—Industrial Revolution § The Malthusian Theorem § Food production growth: additive § Population growth: exponential § Focus on exhaustion of resources § Conflict Theory § Focus on inequitable distribution of resources § Rather than lack § Artificial limits benefit some § Interactionism § Focus on subjective experience § Definition of what is desirable or essential

Population Growth Consequences: § Crowding § Related to other social problems § Poverty, violence, crime § Food shortages § Focus on yield increases § Biotechnology and genetic modification § Depletion of resources § Shortages of fossil fuels § Inter-group conflict § Compete for resources Future Prospects: § Zero Population Growth § Produce no natural increase § Family Planning § Programs to change cultural values § Economic Development § Urbanization, rising standards of living § Incentives § Tax breaks, trust funds § Status of Women § Equality through education, jobs, vote

History Cities § Humans form communities § Groups who share: § § § Common territory Identity or belonging Interaction § Cities: § Large, permanent § Rely on outside areas for food § Urbanization: § Cities grow more urban § Industrialization (18 th— 19 th century) § Change in the U. S. § 1800: ~ 6% lived in cities § 2000: ~ 80% lived in cities Growth § Suburbs: § City outskirts § Less density § Mostly residential § Suburbanization: § Government programs (1930 s) § Federal Housing Administration (FHA) § Veteran’s Administration (VA) § Economy and technology (1940 s-50 s) § Change in U. S. § 1970: 75% of residents both live and work in suburbs § 2000: 60% of urban population lives in suburbs

Urban/Rural Makeup of U. S.

How Urban Is Your State?

Urban Density in the U. S.
 § Population per square mile § U.")
Urban Density in the U. S. (2009) § Population per square mile § U. S. average: 80 § California average: 270 § Urban density § Minneapolis: 1, 800 § Portland: 3, 000 § Los Angeles: 8, 000 § Philadelphia: 11, 000 § Chicago: 14, 000 § San Francisco: 16, 000 § Isla Vista: 18, 000 (per ½ sq. mile) § New York City: 27, 000 (Manhattan: 67, 000)

Shrinking and Growing Cities

Global Cities: 1, 000+ residents

Global Megacities 1975 -2015

Video Presentation: “NOVA— World in the Balance: China Revs Up”

Problems in U. S. Cities

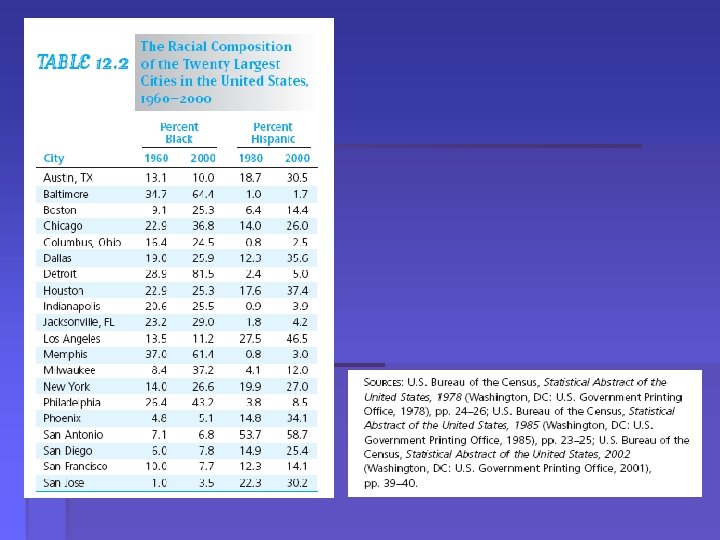
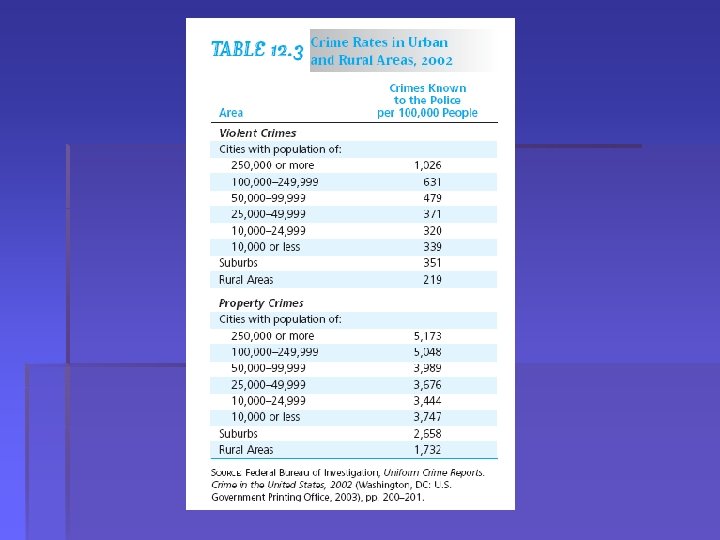
Problems in U. S. Cities § Economic Decline § Flight of people and jobs § NE and Midwest § Housing § Deterioration and abandonment of neighborhoods § Lack of affordable housing § Segregation § Ghetto § Neighborhood inhabited largely by single ethnic or racial group § Exacerbates poverty, racial tensions § Crime § Larger city, higher crime rate § More in inner-cities § Public Education § Poor communities cannot afford expenses

Urban Flight

Perspectives on Urbanization § Functionalism § Urban conditions become social problems § When they become dysfunctional § When they lead to social disorganization § Conflict Theory § Urban conditions become social problems § Due to social inequality § Inner-city residents have little economic and political power § Interactionism § Urban conditions become social problems § When defined subjectively § Urban conditions “worsened” in 1980 s-90 s

Future Prospects: Urban Problems § Federal Grants and Programs § Urban renewal § Rebuild § Provide low-cost housing § Stimulate investment § Private Investment § Make cities better places to live § “Enterprise zones” § Community Development § Join private and public stakeholders § Resettlement of Cities § Encourage return § “Urban homesteading” § “Gentrification” § Regional Planning and Cooperation § Benefit from regional decision making
- Slides: 35