
Chapter 11 Section 5 11 5 SecondDegree Inequalities
- Slides: 15
Chapter 11 Section 5
11. 5 Second-Degree Inequalities and Systems of Inequalities Objectives 1 • Graph second-degree inequalities. 2 • Graph the solution set of a system of inequalities. Copyright © 2012, 2008, 2004 Pearson Education, Inc.
Objective 1 Graph second-degree inequalities. Copyright © 2012, 2008, 2004 Pearson Education, Inc. Slide 11. 5 - 3
Graph second-degree inequalities. A second-degree inequality is an inequality with at least one variable of degree 2 and no variable with degree greater than 2. Copyright © 2012, 2008, 2004 Pearson Education, Inc. Slide 11. 5 - 4
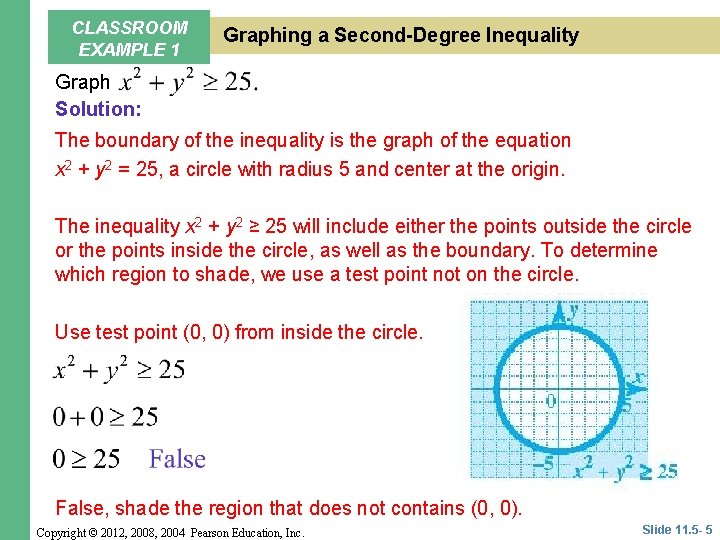
CLASSROOM EXAMPLE 1 Graphing a Second-Degree Inequality Graph Solution: The boundary of the inequality is the graph of the equation x 2 + y 2 = 25, a circle with radius 5 and center at the origin. The inequality x 2 + y 2 ≥ 25 will include either the points outside the circle or the points inside the circle, as well as the boundary. To determine which region to shade, we use a test point not on the circle. Use test point (0, 0) from inside the circle. False, shade the region that does not contains (0, 0). Copyright © 2012, 2008, 2004 Pearson Education, Inc. Slide 11. 5 - 5
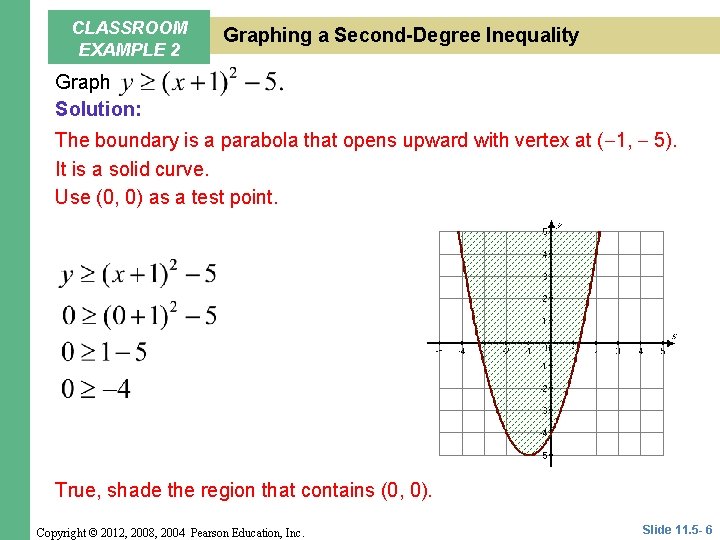
CLASSROOM EXAMPLE 2 Graphing a Second-Degree Inequality Graph Solution: The boundary is a parabola that opens upward with vertex at ( 1, 5). It is a solid curve. Use (0, 0) as a test point. True, shade the region that contains (0, 0). Copyright © 2012, 2008, 2004 Pearson Education, Inc. Slide 11. 5 - 6
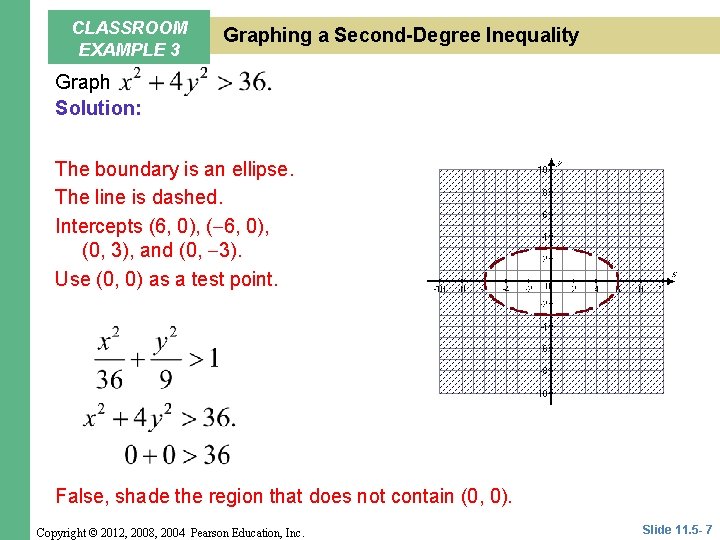
CLASSROOM EXAMPLE 3 Graphing a Second-Degree Inequality Graph Solution: The boundary is an ellipse. The line is dashed. Intercepts (6, 0), (0, 3), and (0, 3). Use (0, 0) as a test point. False, shade the region that does not contain (0, 0). Copyright © 2012, 2008, 2004 Pearson Education, Inc. Slide 11. 5 - 7
Objective 2 Graph the solution set of a system of inequalities. Copyright © 2012, 2008, 2004 Pearson Education, Inc. Slide 11. 5 - 8
Graph the solution set of a system of inequalities. If two or more inequalities are considered at the same time, we have a system of inequalities. To find the solution set of the system, we find the intersection of the graphs (solution sets) of the inequalities in the system. Copyright © 2012, 2008, 2004 Pearson Education, Inc. Slide 11. 5 - 9
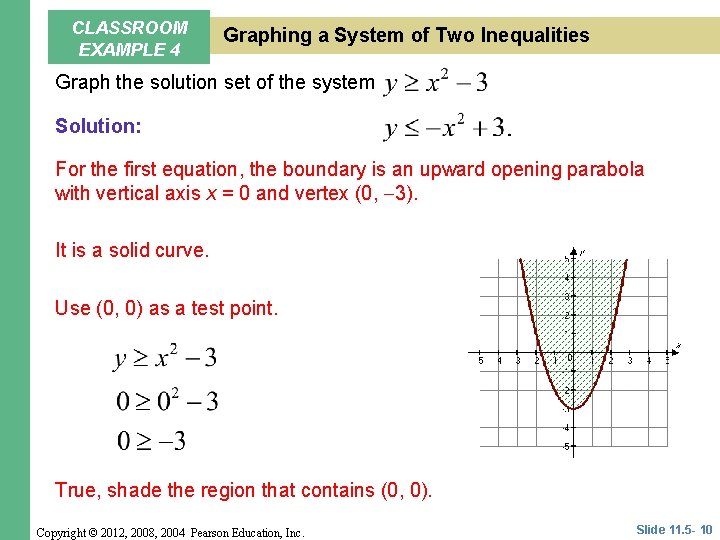
CLASSROOM EXAMPLE 4 Graphing a System of Two Inequalities Graph the solution set of the system Solution: For the first equation, the boundary is an upward opening parabola with vertical axis x = 0 and vertex (0, 3). It is a solid curve. Use (0, 0) as a test point. True, shade the region that contains (0, 0). Copyright © 2012, 2008, 2004 Pearson Education, Inc. Slide 11. 5 - 10
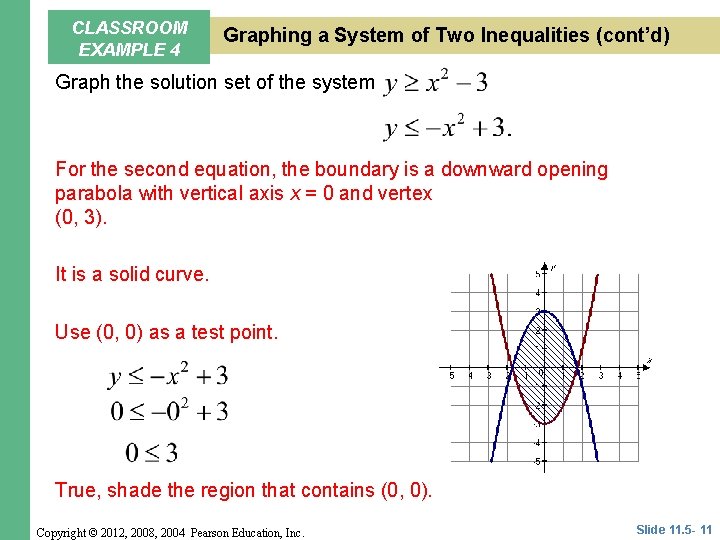
CLASSROOM EXAMPLE 4 Graphing a System of Two Inequalities (cont’d) Graph the solution set of the system For the second equation, the boundary is a downward opening parabola with vertical axis x = 0 and vertex (0, 3). It is a solid curve. Use (0, 0) as a test point. True, shade the region that contains (0, 0). Copyright © 2012, 2008, 2004 Pearson Education, Inc. Slide 11. 5 - 11
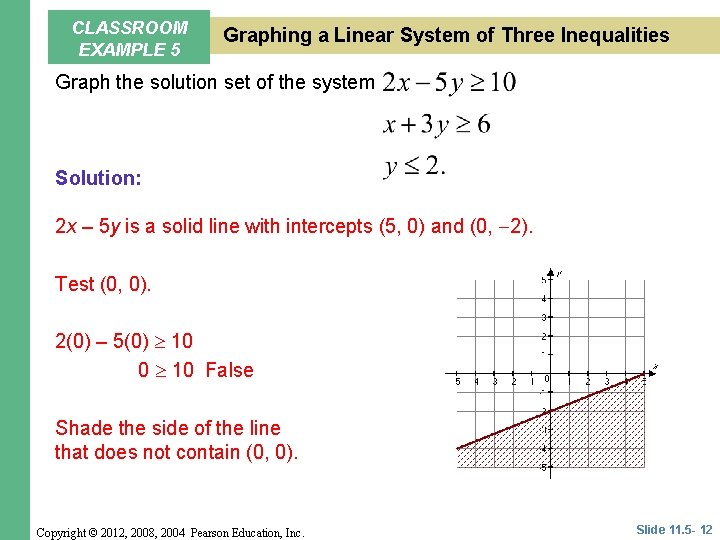
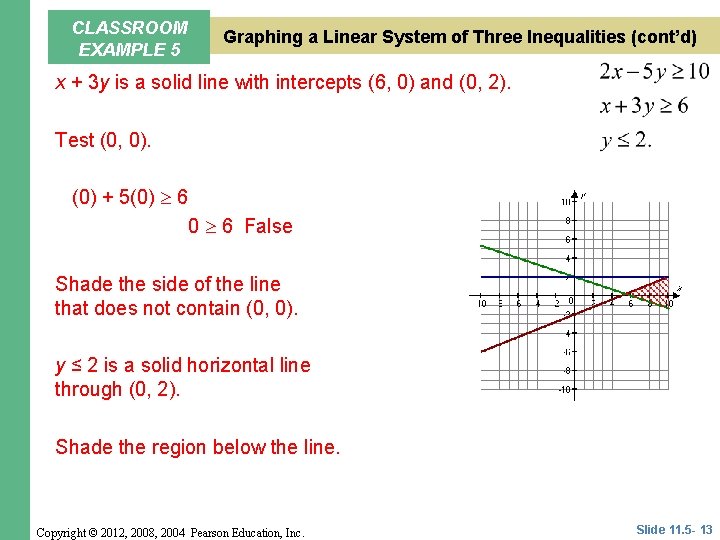
CLASSROOM EXAMPLE 5 Graphing a Linear System of Three Inequalities Graph the solution set of the system Solution: 2 x – 5 y is a solid line with intercepts (5, 0) and (0, 2). Test (0, 0). 2(0) – 5(0) 10 0 10 False Shade the side of the line that does not contain (0, 0). Copyright © 2012, 2008, 2004 Pearson Education, Inc. Slide 11. 5 - 12
CLASSROOM EXAMPLE 5 Graphing a Linear System of Three Inequalities (cont’d) x + 3 y is a solid line with intercepts (6, 0) and (0, 2). Test (0, 0). (0) + 5(0) 6 0 6 False Shade the side of the line that does not contain (0, 0). y ≤ 2 is a solid horizontal line through (0, 2). Shade the region below the line. Copyright © 2012, 2008, 2004 Pearson Education, Inc. Slide 11. 5 - 13
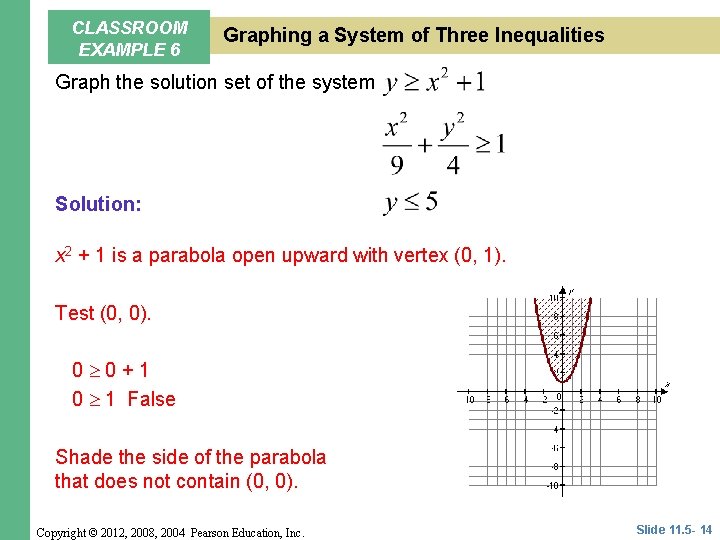
CLASSROOM EXAMPLE 6 Graphing a System of Three Inequalities Graph the solution set of the system Solution: x 2 + 1 is a parabola open upward with vertex (0, 1). Test (0, 0). 0 0+1 0 1 False Shade the side of the parabola that does not contain (0, 0). Copyright © 2012, 2008, 2004 Pearson Education, Inc. Slide 11. 5 - 14
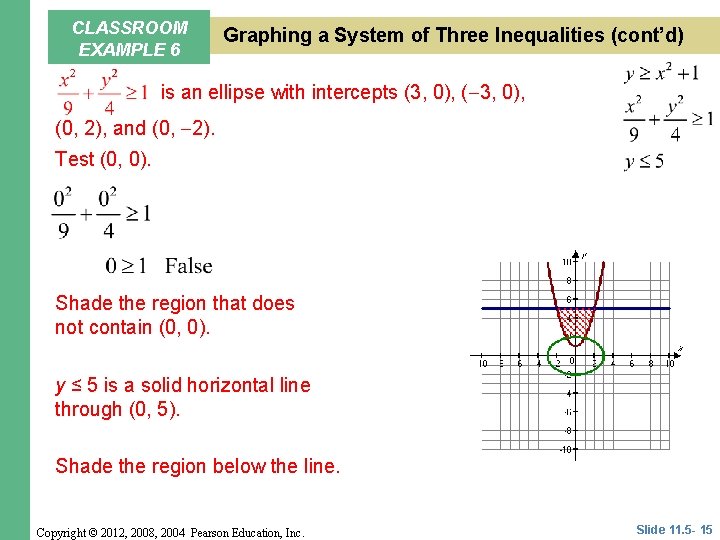
CLASSROOM EXAMPLE 6 Graphing a System of Three Inequalities (cont’d) is an ellipse with intercepts (3, 0), (0, 2), and (0, 2). Test (0, 0). Shade the region that does not contain (0, 0). y ≤ 5 is a solid horizontal line through (0, 5). Shade the region below the line. Copyright © 2012, 2008, 2004 Pearson Education, Inc. Slide 11. 5 - 15