Chapter 11 Performance Measurement in Decentralized Organizations Balanced

Chapter 11 - Performance Measurement in Decentralized Organizations, Balanced Scorecard. M 11 -Chp-11 -1 -Performance-Measurement-2011 -0731 Edited July 31, 2011. Copyright © 2011, Dr. Howard Godfrey This file contains illustrative problems that will be used in the lecture to illustrate important concepts and procedures. Copyright 2011. Dr. Howard Godfrey - M 11 -Chp-11 -1 -Performance Measurement-2011 -0731 1

After studying Chapter 11, you should be able to: LO 1 Compute return on investment (ROI) and show changes in sales, expenses, and assets affect ROI. LO 2 Compute residual income and understand its strengths and weaknesses. LO 3 Compute delivery cycle time, throughput time, and manufacturing cycle efficiency (MCE). LO 4 Construct and use a balanced scorecard. LO 5 (Appendix 11 A) Determine range, if any, within which a negotiated transfer price should fall. LO 6 (Appendix 11 B) Charge operating departments for services provided by service departments. 2

1. Decentralizationadvantages and disadvantages

Decentralization in Organizations Benefits of Decentralization Top management freed to concentrate on strategy. Lower-level decisions often based on better information. Lower level managers can respond quickly to customers. Lower-level managers gain experience in decision-making. Decision-making authority leads to job satisfaction.

Decentralization in Organizations May be a lack of coordination among autonomous managers. Lower-level manager’s objectives may not be those of the organization. Lower-level managers may make decisions without seeing the “big picture. ” Disadvantages of Decentralization May be difficult to spread innovative ideas in the organization.

2. Cost Centers, Profit Centers, Investment Centers

Cost, Profit, and Investments Centers Cost Center Cost, profit, and investment centers are all known as responsibility centers. Profit Center Responsibility Center Investment Center

Cost Center A segment whose manager has control over costs, but not over revenues or investment funds.

Profit Center A segment whose manager has control over both costs and revenues, but no control over investment funds. Revenues Sales Interest Other Costs Mfg. costs Commissions Salaries Other

Investment Center Corporate Headquarters A segment whose manager has control over costs, revenues, and investments in operating assets.

Profit Center and Cost Center Division A manufactures washing machines and ships them to customers on the east cost. Division B manufactures refrigerators and ships them to customers on the east cost. Division A is operated as a cost center and the plant manager is paid a bonus based on reaching goals related to cost control. Division B is operated as a profit center and the plant manager is paid a bonus based on reaching profit goals. Which manager will be most concerned about customer service? 11

Responsibility-1 The manager of a store in a local shopping center is paid a bonus based on store profitability for the year. No bonus will be paid for 2010 because the store did not earn a profit. - continued 12

Responsibility-2 A store was very profitable for the first ten months of 2011. A storm in November destroyed many buildings near the shopping center. Customers avoided the shopping center in November and December because extensive construction activity in the area makes it inconvenient to drive to the shopping center. 13

3. Return on Investment

15

16

17

18
 and show changes in sales, expenses,")
Learning Objective 1 Compute return on investment (ROI) and show changes in sales, expenses, and assets affect ROI.
 Formula Income before interest and taxes (EBIT) Net operating income")
Return on Investment (ROI) Formula Income before interest and taxes (EBIT) Net operating income ROI = Average operating assets Cash, accounts receivable, inventory, plant and equipment, and other productive assets.

Net Book Value versus Gross Cost Most companies use the net book value of depreciable assets to calculate average operating assets.

Understanding ROI Net operating income ROI = Average operating assets Net operating income Margin = Sales Turnover = Average operating assets ROI = Margin Turnover

Increasing ROI – An Example Regal Company reports the following: Net operating income $ 30, 000 Average operating assets $ 200, 000 Sales $ 500, 000 Operating expenses $ 470, 000 What is Regal Company’s ROI? ROI = Margin Turnover ROI = Net operating income Sales × Sales Average operating assets

Increasing ROI – An Example ROI = Margin Turnover ROI = Net operating income Sales $30, 000 ROI = $500, 000 × × ROI = 6% 2. 5 = 15% Sales Average operating assets $500, 000 $200, 000

Investing in Operating Assets to Increase Sales Assume that Regal's manager invests in a $30, 000 piece of equipment that increases sales by $35, 000, while increasing operating expenses by $15, 000. Regal Company reports the following: Net operating income Average operating assets Sales Operating expenses $ 50, 000 $ 230, 000 $ 535, 000 $ 485, 000 Let’s calculate the new ROI.

Investing in Operating Assets to Increase Sales ROI = Margin Turnover ROI = Net operating income Sales ROI = $50, 000 $535, 000 × × Sales Average operating assets $535, 000 $230, 000 ROI = 9. 35% 2. 33 = 21. 8% ROI increased from 15% to 21. 8%.

Criticisms of ROI In the absence of the balanced scorecard, management may not know how to increase ROI. Managers often inherit many committed costs over which they have no control. Managers evaluated on ROI may reject profitable investment opportunities.

28

29

30

32

33

36

37

38

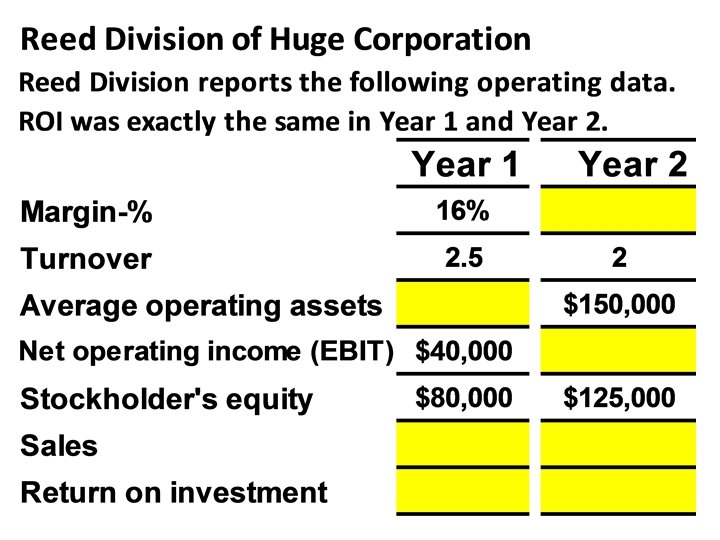
Big Corporation Slide 4. Each division has the opportunity to make an additional investment of $500, 000, and increase EBIT by $290, 000. If both divisions make the investment, what will they report as ROI for the second year? 39

40

41

42

Big Corporation Slide 8. Each division has the opportunity to make an additional investment of $500, 000, and increase EBIT by $290, 000. Which division is likely to accept approve the investment? 43

45

46

4. Residual Income

Residual income tells you how much a company’s after-tax operating income exceeds what it is paying for the use of capital (cost of capital). 48

Residual Income - Another Measure of Performance Net operating income above some minimum return on operating assets
 This computation differs from ROI measures net operating income")
Calculating Residual Income ( ) This computation differs from ROI measures net operating income earned relative to the investment in average operating assets. Residual income measures net operating income earned less the minimum required return on average operating assets.

Residual Income – An Example • The Retail Division of Zephyr, Inc. has • average operating assets of $100, 000 and is required to earn a return of 20% on these assets. In the current period, the division earns $30, 000. Let’s calculate residual income.

Residual Income – An Example

Motivation and Residual Income Residual income encourages managers to make profitable investments that would be rejected by managers using ROI.

Quick Check Redmond Awnings, a division of Wrap-up Corp. , has a net operating income of $60, 000 and average operating assets of $300, 000. The required rate of return for the company is 15%. What is the division’s ROI? a. 25% b. 5% c. 15% d. 20%

Quick Check Redmond Awnings, a division of Wrap-up Corp. , has a net operating income of $60, 000 and average operating assets of $300, 000. The required rate of return for the company is 15%. What is the division’s ROI? a. 25% b. 5% ROI = NOI/Average operating assets = $60, 000/$300, 000 = 20% c. 15% d. 20%

Quick Check Redmond Awnings, a division of Wrap-up Corp. , has a net operating income of $60, 000 and average operating assets of $300, 000. If the manager of the division is evaluated based on ROI, will she want to make an investment of $100, 000 that would generate additional net operating income of $18, 000 per year? a. Yes b. No

Quick Check Redmond Awnings, a division of Wrap-up Corp. , has a net operating income of $60, 000 and average operating assets of $300, 000. If the manager of the division is evaluated based on ROI, will she want to make an investment of $100, 000 that would generate additional net operating income of $18, 000 per year? a. Yes b. No ROI = $78, 000/$400, 000 = 19. 5% This lowers the division’s ROI from 20. 0% down to 19. 5%.

Quick Check The company’s required rate of return is 15%. Would the company want the manager of the Redmond Awnings division to make an investment of $100, 000 that would generate additional net operating income of $18, 000 per year? a. Yes b. No

Quick Check The company’s required rate of return is 15%. Would the company want the manager of the Redmond Awnings division to make an investment of $100, 000 that would generate additional net operating income of $18, 000 per year? a. Yes b. No ROI = $18, 000/$100, 000 = 18% The return on the investment exceeds the minimum required rate of return.

Quick Check Redmond Awnings, a division of Wrap-up Corp. , has a net operating income of $60, 000 and average operating assets of $300, 000. The required rate of return for the company is 15%. What is the division’s residual income? a. $240, 000 b. $ 45, 000 c. $ 15, 000 d. $ 51, 000

Quick Check Redmond Awnings, a division of Wrap-up Corp. , has a net operating income of $60, 000 and average operating assets of $300, 000. The required rate of return for the company is 15%. What is the division’s residual income? a. $240, 000 b. $ 45, 000 c. $ 15, 000 d. $ 51, 000 Net operating income Required return (15% of $300, 000) Residual income $60, 000 (45, 000) $15, 000

Quick Check If the manager of the Redmond Awnings division is evaluated based on residual income, will she want to make an investment of $100, 000 that would generate additional net operating income of $18, 000 per year? a. Yes b. No

Quick Check If the manager of the Redmond Awnings division is evaluated based on residual income, will she want to make an investment of $100, 000 that would generate additional net operating income of $18, 000 per year? a. Yes b. No Net operating income Required return (15% of $400, 000) Residual income $78, 000 (60, 000) $18, 000 Yields an increase of $3, 000 in the residual income.

Divisional Comparisons and Residual Income The residual income approach has one major disadvantage. It cannot be used to compare the performance of divisions of different sizes.

Zephyr, Inc. - Continued Recall the following information for the Retail Division of Zephyr, Inc. Assume the following information for the Wholesale Division of Zephyr, Inc.

Zephyr, Inc. - Continued The residual income numbers suggest that the Wholesale Division outperformed the Retail Division because its residual income is $10, 000 higher. However, the Retail Division earned an ROI of 30% compared to an ROI of 22% for the Wholesale Division. The Wholesale Division’s residual income is larger than the Retail Division simply because it is a bigger division.

67

68

ABC Corporation – Slide 1. See next slide. Assume each division has a cost of capital of 12%. What will each report as residual income? 69

70

71

Residual Income Method - 1 James is manager of the Industrial Division. His performance is measured using the residual income method. James forecasted the following for his division for next year: Category Amount Working capital $ 2, 800, 000 Revenue 30, 000 Plant and equipment 17, 200, 000 With an imputed interest charge is 15% and a residual income target of $2, 000, what will costs have to be in order to achieve the target? a. $9, 000 b. $25, 000 c. $25, 150, 000 d. $25, 690, 000

73

74

5. EVA, an adaptation of Residual Income

6. Delivery Cycle Time
.")
Learning Objective 3 Compute delivery cycle time, throughput time, and manufacturing cycle efficiency (MCE).

Delivery Performance Measures Order Received Wait Time Production Started Goods Shipped Process Time + Inspection Time + Move Time + Queue Time Throughput Time Delivery Cycle Time Process time is the only value-added time.

Delivery Performance Measures Order Received Wait Time Production Started Goods Shipped Process Time + Inspection Time + Move Time + Queue Time Throughput Time Delivery Cycle Time Manufacturing Cycle = Efficiency Value-added time Manufacturing cycle time

Quick Check A TQM team at Narton Corp has recorded the following average times for production: Wait 3. 0 days Inspection 0. 4 days Process 0. 2 days Move 0. 5 days Queue 9. 3 days What is the throughput time? a. 10. 4 days. b. 0. 2 days. c. 4. 1 days. d. 13. 4 days.

Quick Check A TQM team at Narton Corp has recorded the following average times for production: Wait 3. 0 days Inspection 0. 4 days Process 0. 2 days Move 0. 5 days Queue 9. 3 days What is the throughput time? a. 10. 4 days. b. 0. 2 days. Throughput time = Process + Inspection + Move + Queue c. 4. 1 days. = 0. 2 days + 0. 4 days + 0. 5 days + 9. 3 days d. 13. 4 days. = 10. 4 days

Quick Check A TQM team at Narton recorded the following average production times: Wait 3. 0 days Inspection 0. 4 days Process 0. 2 days Move 0. 5 days Queue 9. 3 days What is the Manufacturing Cycle Efficiency (MCE)? a. 50. 0%. b. 1. 9%. c. 52. 0%. d. 5. 1%.

Quick Check A TQM team at Nartonrecorded the following average production times: Wait 3. 0 days Inspection 0. 4 days Process 0. 2 days Move 0. 5 days Queue 9. 3 days What is Manufacturing Cycle Efficiency (MCE)? a. 50. 0%. MCE = Value-added time ÷ Throughput time b. 1. 9%. = Process time ÷ Throughput time c. 52. 0%. = 0. 2 days ÷ 10. 4 days d. 5. 1%. = 1. 9%

Quick Check A TQM team at Narton Corp has recorded the following average times for production: Wait 3. 0 days Inspection 0. 4 days Process 0. 2 days Move 0. 5 days Queue 9. 3 days What is the delivery cycle time (DCT)? a. 0. 5 days. b. 0. 7 days. c. 13. 4 days. d. 10. 4 days.

Quick Check A TQM team at Narton Corp has recorded the following average times for production: Wait 3. 0 days Inspection 0. 4 days Process 0. 2 days Move 0. 5 days Queue 9. 3 days What is the delivery cycle time (DCT)? a. 0. 5 days. b. 0. 7 days. DCT = Wait time + Throughput time = 3. 0 days + 10. 4 days c. 13. 4 days. = 13. 4 days d. 10. 4 days.

Balance Scorecard

The Balanced Scorecard Management translates its strategy into performance measures that employees understand influence. Customer Financial Performance measures Internal business processes Learning and growth

The Balanced Scorecard: From Strategy to Performance Measures Financial What are our financial goals? Customer What customers do we want to serve and how are we going to win and retain them? Internal Business Processes What internal business processes are critical to providing value to customers? Has our financial performance improved? Do customers recognize that we are delivering more value? Have we improved key business processes so that we can deliver more value to customers? Learning and Growth Are we maintaining our ability to change and improve? Vision and Strategy

The Balanced Scorecard: Non-financial Measures The balanced scorecard relies on non-financial measures in addition to financial measures for two reasons: Financial measures are lag indicators that summarize the results of past actions. Non-financial measures are leading indicators of future financial performance. Top managers are ordinarily responsible for financial performance measures – not lower level managers. Non-financial measures are more likely to be understood and controlled by lower level managers.

Balanced Scorecard - Individuals The entire organization should have an overall balanced scorecard. Each individual should have a personal balanced scorecard. A personal scorecard should contain measures that can be influenced by the individual being evaluated and that support the measures in the overall balanced scorecard.

The Balanced Scorecard A balanced scorecard should have measures that are linked together on a cause-and-effect basis. If we improve one performance measure. . . Then Another desired performance measure will improve. The balanced scorecard lays out concrete actions to attain desired outcomes.

The Balanced Scorecard and Compensation Incentive compensation should be linked to balanced scorecard performance measures.

The Balanced Scorecard ─ Jaguar Example Profit Financial Contribution per car Number of cars sold Customer satisfaction with options Internal Business Processes Learning and Growth Number of options available Time to install option Employee skills in installing options

The Balanced Scorecard ─ Jaguar Example Profit Contribution per car Number of cars sold Customer satisfaction with options Strategies Increase Options Increase Skills Number of options available Time to install option Employee skills in installing options Results Satisfaction Increases Time Decreases

The Balanced Scorecard ─ Jaguar Example Profit Contribution per car Results Number of cars sold Customer satisfaction with options Number of options available Time to install option Employee skills in installing options Cars sold Increase Satisfaction Increases

The Balanced Scorecard ─ Jaguar Example Profit Results Contribution per car Contribution Increases Number of cars sold Customer satisfaction with options Number of options available Time to install option Employee skills in installing options Satisfaction Increases Time Decreases

The Balanced Scorecard ─ Jaguar Example Results Profit If number of cars sold and contribution per car increase, profit should increase. Profits Increase Contribution per car Contribution Increases Number of cars sold Cars Sold Increases Customer satisfaction with options Number of options available Time to install option Employee skills in installing options

Transfer Pricing

Centralization and Decentralization Issues A company has two subsidiaries. The first subsidiary manufactures washing machines and ships them to customers on the east cost. The second subsidiary has a trucking company that delivers freight throughout the east cost. Both subsidiaries are operated on a decentralized basis. The president of each subsidiary receives a substantial bonus based on the amount of his or her company’s profit. What are the issues if the parent company requires the trucking company to allow a 40% discount for all freight hauled for the washing machine subsidiary? 99

General rule for transfer pricing and use it to assess transfer prices based on total costs, variable costs, and market prices. 100

Bicycle Problem -1 Maximum and Minimum Transfer Price Biwheels Company makes bicycles. Components are made in various divisions and transferred to the Omaha Division for assembly of bicycles. The Omaha Division can also buy components from external suppliers. The wheels are made in the Lincoln Division, which also sells wheels to external customers. All divisions are profit centers, and managers are free to negotiate transfer prices. Prices and costs for the Lincoln and Omaha divisions are: 103

Bicycle Problem-2 Lincoln Division Transfer Price Sales price to external customers $13 Internal transfer price ? Costs Variable costs per wheel $9 Total fixed costs $320, 000 Budgeted Production 64, 000 wheels* *Includes production for transfer to Omaha 104

Bicycle Problem-3 Maximum and Minimum Transfer Price Omaha Division Sales price to external customers $160 Cost of Wheels, per bicycle ? Other components, per bicycle $80 Other variable costs, per bicycle $40 Total fixed costs $640, 000 Budgeted production 16, 000 bicycles Fixed costs in both divisions will be unaffected by the transfer of wheels from Lincoln to Omaha. 105

Bicycle Problem-4 1. Compute the maximum transfer price per wheel the Omaha Division would be willing to pay to buy wheels from the Lincoln Division. 2. Compute the minimum transfer price per wheel at which the Lincoln Division would be willing to produce and sell wheels to the Omaha Division. Assume that Lincoln has excess capacity. 106

Bicycle Problem-5 1. If wheels were available for $12 each in the market, Omaha would not be willing to pay more than $12 to Lincoln. If wheels could not be purchased in the market, the maximum price would be $20, computed as follows: Sales price $160 Variable costs (except for wheels) 120 Contribution available for wheels and to cover fixed costs and profit $ 40 The $40 must pay for two wheels, so the most that can be paid per wheel is $40÷ 2 = $20. 107

Bicycle Problem-6 The Omaha Division would likely not pay $20 per wheel, because that would leave no contribution to fixed costs plus profit. However, any price less that $20 would produce a positive contribution margin and therefore be better than not producing the bicycles.

Bicycle Problem-7 2. Because there is excess capacity, any transfer price above the variable cost of $9 would result in a positive contribution margin. No price below $9 would be acceptable. If there were no excess capacity, the minimum transfer price would be the market price of $13. Why? Because the Lincoln division would have to forgo $13 of revenue from an external sale in order to transfer a wheel internally.

Transfer Prices Division A is currently operating at 50% capacity. It produces a single product and sells all its production to outside customers for $20 per unit. Variable costs are $7 per unit, and fixed costs are $6 per unit at the current production level. Division B, which currently purchases this product from an outside supplier for $12 per unit, would like to purchase the product from Division A will operate at 80% capacity to meet outside customers’ and Division B’s demand. What is the minimum price that Division A should charge Division B for this product? a. $7. 00 per unit. b. $10. 40 per unit. c. $12. 00 per unit. d. $13. 00 per unit. 110

Transfer Prices The Alpha Division of a company, which is operating at capacity, produces and sells 1, 000 units of a certain electronic component in a perfectly competitive market. Revenue and cost data are as follows: Sales $50, 000 Variable costs 34, 000 Fixed costs 12, 000 The minimum transfer price that should be charged to the Beta Division of the same company for each component is: a. $12 b. $34 c. $46 d. $50 111

112

113

The End 114
- Slides: 114